. 2016 Jun 1;310(11):F1229-42.
doi: 10.1152/ajprenal.00547.2015. Epub 2016 Mar 23.

Proximal tubule-specific glutamine synthetase deletion alters basal and acidosis-stimulated ammonia metabolism

Affiliations

Proximal tubule-specific glutamine synthetase deletion alters basal and acidosis-stimulated ammonia metabolism

Hyun-Wook Lee et al. Am J Physiol Renal Physiol. .

Abstract

Glutamine synthetase (GS) catalyzes the recycling of NH4 (+) with glutamate to form glutamine. GS is highly expressed in the renal proximal tubule (PT), suggesting ammonia recycling via GS could decrease net ammoniagenesis and thereby limit ammonia available for net acid excretion. The purpose of the present study was to determine the role of PT GS in ammonia metabolism under basal conditions and during metabolic acidosis. We generated mice with PT-specific GS deletion (PT-GS-KO) using Cre-loxP techniques. Under basal conditions, PT-GS-KO increased urinary ammonia excretion significantly. Increased ammonia excretion occurred despite decreased expression of key proteins involved in renal ammonia generation. After the induction of metabolic acidosis, the ability to increase ammonia excretion was impaired significantly by PT-GS-KO. The blunted increase in ammonia excretion occurred despite greater expression of multiple components of ammonia generation, including SN1 (Slc38a3), phosphate-dependent glutaminase, phosphoenolpyruvate carboxykinase, and Na(+)-coupled electrogenic bicarbonate cotransporter. We conclude that 1) GS-mediated ammonia recycling in the PT contributes to both basal and acidosis-stimulated ammonia metabolism and 2) adaptive changes in other proteins involved in ammonia metabolism occur in response to PT-GS-KO and cause an underestimation of the role of PT GS expression.

Keywords: acid-base; ammonia; glutamine synthetase; proximal tubule.


Figures
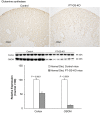
Fig. 1.
Fig. 1.
Glutamine synthetase (GS) expression in GSfl/fl, phosphoenolpyruvate carboxykinase (PEPCK)-Cre-negative and GSfl/fl, PEPCK-Cre-positive mice. Top: representative low-power micrographs of GS expression in control mouse kidneys and kidneys from mice with proximal tubule (PT)-specific GS deletion (PT-GS-KO). A clear decrease in GS immunoreactivity was evident in PEPCK-Cre-positive kidneys. Results are representative of findings of n = 6 mice/genotype. Bottom: immunoblot analysis of GS expression in the cortex and outer stripe of the outer medulla (OSOM) of control and PT-GS-KO mice. PT-GS-KO resulted in significant decreases in GS expression in both the cortex and OSOM. Values are means ± SE; n = 8 mice/genotype.
Fig. 2.
Fig. 2.
Double immunolabel of GS with Na+-coupled bicarbonate cotransporter (NBCe1) in PT-GS-KO kidneys. To determine the extent of GS deletion from the PT, we used double immunolabel of GS (brown) with the PT-specific marker NBCe1 (blue). DIC imaging with contrast enhancement was used to identify cell nuclei. Representative micrographs of the proximal convoluted tubule (PCT) in the cortex (top left), proximal straight tubule (PST) in the cortex (top right), and PST in the outer medulla (bottom left) are shown. The proportion of nucleated cells in the PST with GS deletion is shown in the bottom right. There was significant GS deletion throughout the entire PT, with greater levels of deletion in the PST than in the PCT. GS immunolabel is present in intercalated cells in the cortical collecting duct (CCD) and in the outer medullary collecting duct (OMCD). No immunolabel is present in the thick ascending limb of the loop of Henle (TAL). G, glomerulus. n = 4 mice for each PT region. Statistical analysis was performed using a paired t-test.
Fig. 3.
Fig. 3.
GS expression in intercalated cells in the cortex, OSOM, and inner stripe of the outer medulla (ISOM). Intercalated cell GS immunolabel (arrows) was present in PT-GS-KO mice in a pattern similar to that observed in control mice (left). In the OSOM, intercalated cell GS immunolabel intensity appeared greater in PT-GS-KO mice than in control mice. Quantitative immunohistochemistry (top right) confirmed this observation. There was no significant difference in intercalated cell GS immunolabel intensity in either the cortex or ISOM. PT-GS-KO did not significantly alter intercalated cell mean area in either the cortex, OSOM, or ISOM (bottom right). n = 4 mice/genotype. NS, not significant.
Fig. 4.
Fig. 4.
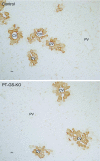
Hepatic GS expression in control and PT-GS-KO mice. GS was expressed normally in the liver in pericentral hepatocytes and was present in both control (top) and PT-GS-KO (bottom) mouse livers. There was no detectable difference in GS expression between control and PT-GS-KO mice. PV, portal vein; CV, central vein.
Fig. 5.
Fig. 5.
Effect of PT-GS-KO on urinary ammonia and pH. Left: PT-GS-KO caused a significant increase in basal urinary ammonia excretion. Right: PT-GS-KO did not alter urinary pH under basal conditions.
Fig. 6.
Fig. 6.
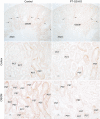
Effect of PT-GS-KO on SN1 expression in mice fed a normal diet. Top: low-power micrographs of SN1 immunolabel in control and PT-GS-KO kidneys. Strong SN1 immunoreactivity was evident in the OSOM and extended into the medullary rays (arrows) in the deep inner cortex of control kidneys. In PT-GS-KO, SN1 immunoreactivity in these regions was markedly reduced. Middle: high-power micrographs of basolateral SN1 immunolabel in the midcortex. Although SN1 immunolabel was decreased by PT-GS-KO in the PST in the deep inner cortex, in the mid and outer cortical PST, SN1 immunolabel was not appreciably different between control and PT-GS-KO mice. SN1 label in the PCT was negligible in both genotypes. Bottom: SN1 immunolabel in the OSOM. In PSTs in the OSOM, SN1 immunoreactivity was less intense than in mice with PT-GS-KO compared with control mice.
Fig. 7.
Fig. 7.
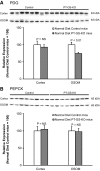
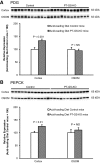
Effect of PT-GS-KO on renal phosphate-dependent glutaminase (PDG) and PEPCK protein expression in mice fed a normal diet. Top: effects of PT-GS-KO on PDG expression by immunoblot analysis. In the cortex, PDG expression was not significantly different between control and PT-GS-KO mice. In the OSOM, PDG expression was significantly decreased in PT-GS-KO mice. Bottom: effects of PT-GS-KO on PEPCK expression. Cortical and OSOM PEPCK expression were not significantly different between control and PT-GS-KO mice. Values are means ± SE; n = 8 mice/genotype.
Fig. 8.
Fig. 8.
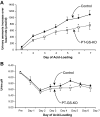
Urinary ammonia and pH response to metabolic acidosis. Top: change in urinary ammonia excretion in response to HCl-induced metabolic acidosis over basal excretion. During days 5–7 of acid loading, the increase in ammonia excretion was significantly less in mice with PT-GS-KO than in control mice. However, during the initial phase of acid loading, there was no significant difference in the increase in urinary ammonia excretion in mice with PT-GS-KO. Bottom: urine pH in response to HCl-induced metabolic acidosis. On almost all days of acid loading, with the exception of day 5, urinary pH did not differ significantly between control and PT-GS-KO mice. Values are means ± SE; n = 12 mice/genotype. *P < 0.05 vs. control mice.
Fig. 9.
Fig. 9.
Effect of PT-GS-KO on titratable acid excretion. Titratable acid excretion is a fundamental component of renal net acid excretion. Before acid loading, there was no significant difference in titratable acid excretion between mice with intact GS expression and those with PT-GS-KO. After acid loading, there continued to be no significant effect of PT-GS-KO on titratable acid excretion. n = 8–12 mice/genotype on each day.
Fig. 10.
Fig. 10.
GS expression after acid loading. Top: GS protein expression by immunoblot analysis after acid loading. GS protein expression was significantly less in mice with PT-GS-KO compared with control mice in both the cortex and OSOM. Values are means ± SE; n = 12 mice/genotype.
Fig. 11.
Fig. 11.
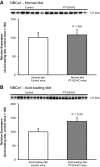
Effect of PT-GS-KO on renal PDG and PEPCK expression in acid-loaded mice. Top: effects of PT-GS-KO on PDG expression by immunoblot analysis. In the cortex, PDG expression was significantly greater in PT-GS-KO mice than in control mice. Bottom: effects of PT-GS-KO on PEPCK expression. In the cortex, PEPCK expression was significantly greater in PT-GS-KO mice than in control mice. Values are means ± SE; n = 12 mice/genotype.
Fig. 12.
Fig. 12.
Effect of PT-GS-KO on expression of the glutamine transporter SN1 in acid-loaded mice. Top: SN1 immunolabel in acid-loaded control and PT-GS-KO mice in the cortex. Bottom: SN1 immunolabel in the OSOM. In both regions, SN1 immunolabel was more intense in acid-loaded PT-GS-KO mouse kidneys than in acid-loaded control mouse kidneys. Results are representative of findings of 6 mice/genotype.
Fig. 13.
Fig. 13.
Effect of PT-GS-KO on NBCe1 expression in mice fed normal and acid-loaded diets. Top: NBCe1 expression by immunoblot analysis did not differ significantly between control and PT-GS-KO mice fed a normal diet. Bottom: PT-GS-KO significantly increased NBCe1 expression by immunoblot analysis in acid-loaded mice. Values are means ± SE; n = 8 mice fed a normal diet and n = 12 mice fed an acid-loaded diet in each genotype.
Fig. 14.
Fig. 14.
Effect of PT-GS-KO on Na+/H+ exchanger (NHE)3 expression. Top: NHE3 expression by immunoblot analysis did not differ significantly between control and PT-GS-KO mice fed either a normal diet (top left) or after acid loading (top right). Bottom: NHE3 expression by immunohistochemistry. There was no observable difference in NHE3 expression using light microscopic analysis as a result of PT-GS-KO when mice received either a normal diet (bottom left) or an acid-loaded diet (bottom right). Values are means ± SE; n = 8 mice fed a normal diet in each genotype and n = 10 control mice and n = 12 PT-GS-KO mice fed an acid-loaded diet.

Similar articles

Cited by

References

    1. Bishop JM, Lee HW, Handlogten ME, Han KH, Verlander JW, Weiner ID. Intercalated cell-specific Rh B glycoprotein deletion diminishes renal ammonia excretion response to hypokalemia. Am J Physiol Renal Physiol 304: F422–F431, 2013. - PMC - PubMed
    1. Bishop JM, Verlander JW, Lee HW, Nelson RD, Weiner AJ, Handlogten ME, Weiner ID. Role of the Rhesus glycoprotein, Rh B Glycoprotein, in renal ammonia excretion. Am J Physiol Renal Physiol 299: F1065–F1077, 2010. - PMC - PubMed
    1. Biver S, Belge H, Bourgeois S, Van Vooren P, Nowik M, Scohy S, Houillier P, Szpirer J, Szpirer C, Wagner CA, Devuyst O, Marini AM. A role for Rhesus factor Rhcg in renal ammonium excretion and male fertility. Nature 456: 339–343, 2008. - PubMed
    1. Boulland JL, Osen KK, Levy LM, Danbolt NC, Edwards RH, Storm-Mathisen J, Chaudhry FA. Cell-specific expression of the glutamine transporter SN1 suggests differences in dependence on the glutamine cycle. Eur J Neurosci 15: 1615–1631, 2002. - PubMed
    1. Busque SM, Wagner CA. Potassium restriction, high protein intake, and metabolic acidosis increase expression of the glutamine transporter SNAT3 (Slc38a3) in mouse kidney. Am J Physiol Renal Physiol 297: F440–F450, 2009. - PubMed

Publication types

LinkOut - more resources