. 2016 Mar 24:7:11075.
doi: 10.1038/ncomms11075.

Single-cell RNA sequencing reveals molecular and functional platelet bias of aged haematopoietic stem cells

Affiliations

Single-cell RNA sequencing reveals molecular and functional platelet bias of aged haematopoietic stem cells

Amit Grover et al. Nat Commun. .

Abstract

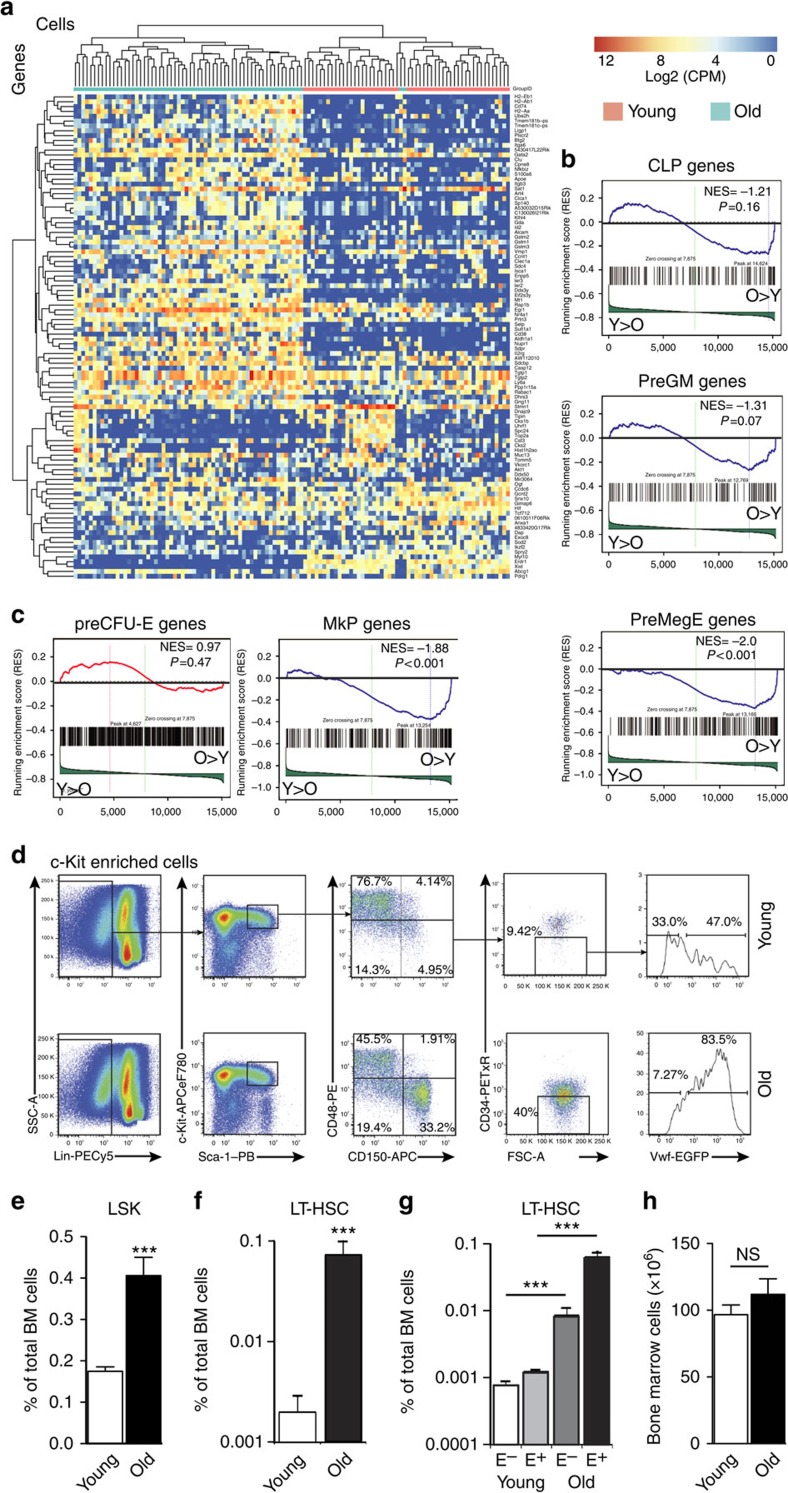
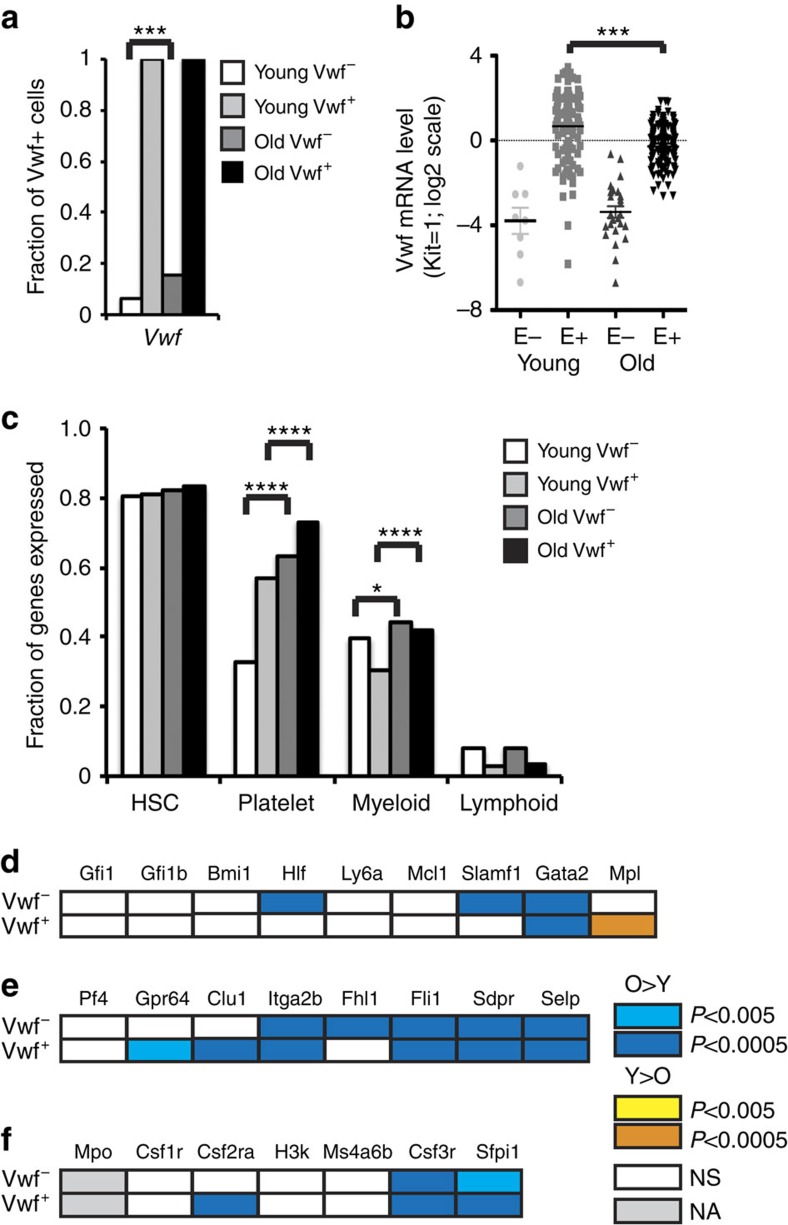
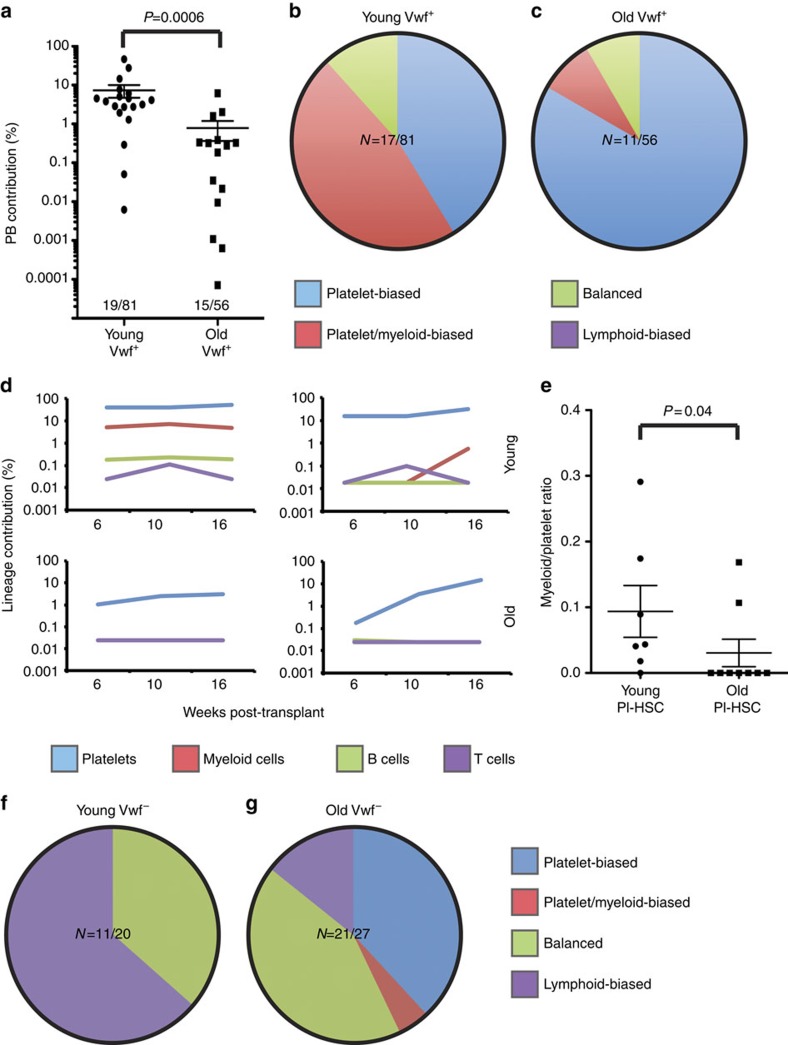
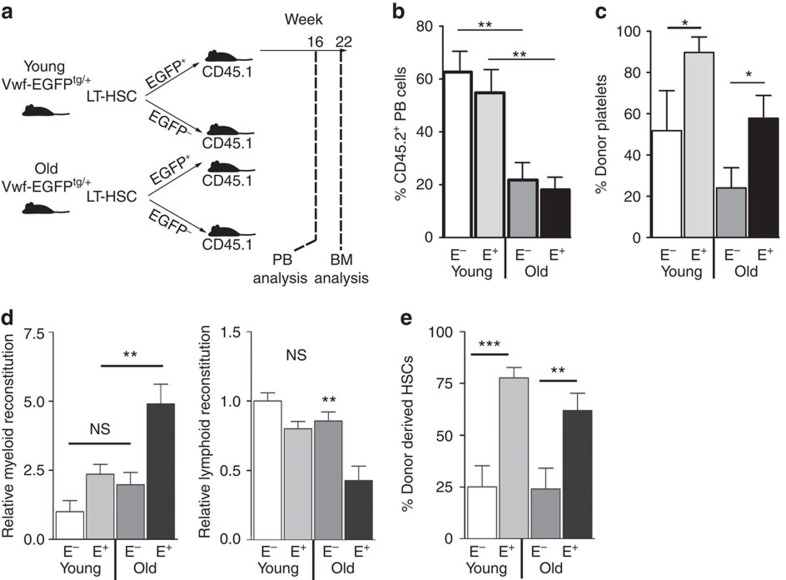
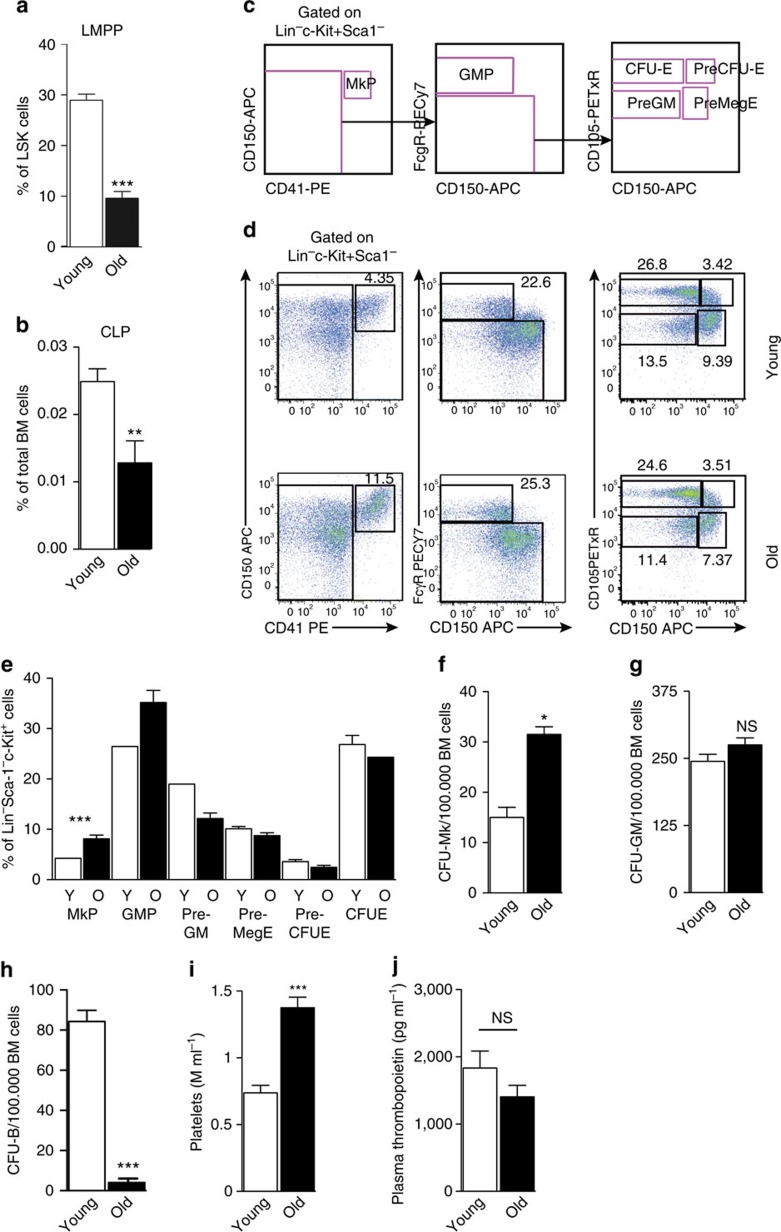
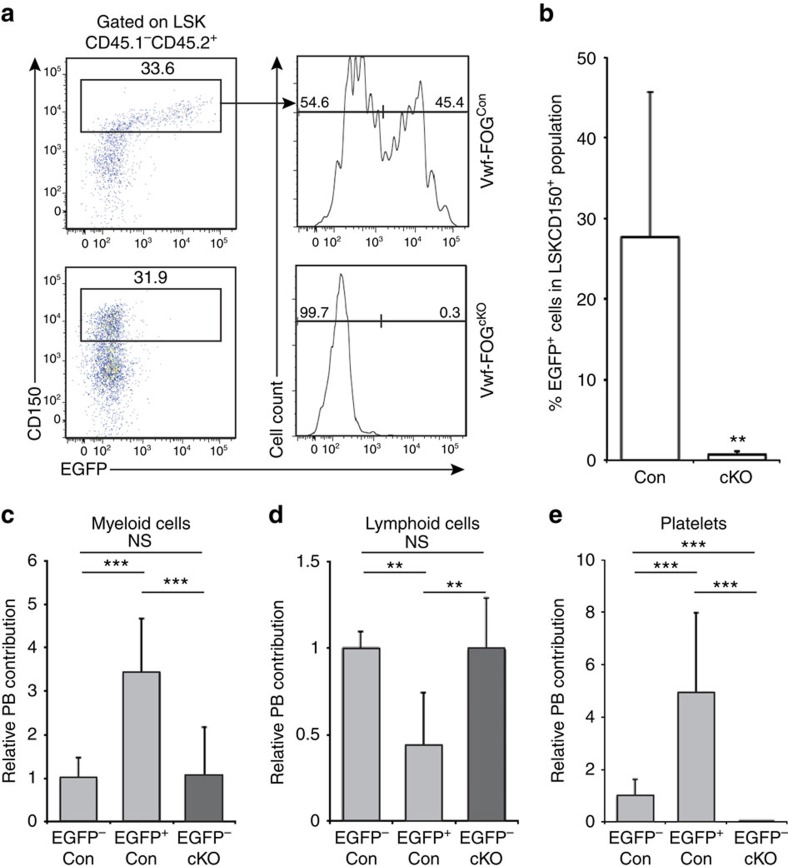
Aged haematopoietic stem cells (HSCs) generate more myeloid cells and fewer lymphoid cells compared with young HSCs, contributing to decreased adaptive immunity in aged individuals. However, it is not known how intrinsic changes to HSCs and shifts in the balance between biased HSC subsets each contribute to the altered lineage output. Here, by analysing HSC transcriptomes and HSC function at the single-cell level, we identify increased molecular platelet priming and functional platelet bias as the predominant age-dependent change to HSCs, including a significant increase in a previously unrecognized class of HSCs that exclusively produce platelets. Depletion of HSC platelet programming through loss of the FOG-1 transcription factor is accompanied by increased lymphoid output. Therefore, increased platelet bias may contribute to the age-associated decrease in lymphopoiesis.


Figures

Figure 1
Figure 1. Expansion of platelet-primed HSCs in old mice.
(a) Hierarchical clustering of young and old LSKCD150+CD48 HSC single-cell transcriptomes using the top 100 variable genes from components 1–3 of combined PCA of young and old HSCs. Data are from two independent experiments (young mice N=1; old mice N=1). (b) Signature enrichment plots from GSEA analysis using CLP, preGM and preMegE signature gene sets. The values indicated on individual plots are the Normalised Enrichment Score (NES) and P-value of the enrichment (permutation analysis). Note the significant upregulation of preGM, and preMegE signatures in old HSCs. (c) Signature enrichment as in b using CFU-E and MkP signature gene sets. Note the significant upregulation of the MkP signature in old HSCs. (d) Representative FACS plots for isolation of Vwf- and Vwf+ LT-HSCs (defined as LSKCD48CD150+CD34 cells) in BM from young and old Vwf-EGFP transgenic mice after performing c-Kit enrichment. Numbers indicate percentage of the parental gate. (e) Frequencies of LSK cells in total BM in young (N=24) and old (N=5) mice. Data are from five independent experiments. Values show mean±s.e.m. ***P<0.001. (Student's t-test). (f) Frequencies of LSKCD48CD150+CD34 LT-HSCs as percentage of live singlets in young (N=31) and old (N=7) mice. Note: Log10 scale. Data are from six independent experiments. (g) Frequencies of Vwf- and Vwf+ LT-HSCs as percentage of live singlets in young (N=31) and old (N=7) mice. E, Vwf-EGFP; E+, Vwf-EGFP+. Note: Log10 scale. Data are from six independent experiments. (h) Bone marrow cellularity of young (N=29) and old (N=7) Vwf-EGFP transgenic mice. Cellularity was determined from two iliac cristae, two tibiae and two femora after RBC lysis. Values show mean±s.e.m. ***P<0.001. (Student's t-test); NS, not significant. Data are from six independent experiments.
Figure 2
Figure 2. Aged LT-HSCs show increased transcriptional priming of platelet- and myeloid-lineage genes.
(a) Bars show the frequency of cells in which Vwf expression was detected within the indicated LT-HSC populations by single-cell PCR. Number of cells analysed: young Vwf, 123; old Vwf, 167; young Vwf+, 111; old Vwf+, 163. ***P<0.001 (Student's t-test). Data are from five independent experiments (young mice N=3, old mice N=2) and a total of 16 BioMark 48.48 Dynamic Arrays. (b) Vwf expression level in single LT-HSCs from a. Dots represent individual expressing cells. Bars indicate the average expression level for positive cells in each population. E–, Vwf-EGFP; E+, Vwf-EGFP+. ***P<0.001 (Student's t-test). (c) Bars show the frequency of expression of genes associated with HSC function and platelet, myeloid and lymphoid differentiation in single HSCs from a. The frequencies of co-expression were compared between old and young Vwf LT-HSCs (O– versus Y–), and between old and young Vwf+ LT-HSCs (O+ versus Y+) using the Kolmogorov–Smirnov test, and the level of significance is indicated. Data on individual genes are shown in Supplementary Fig. 2. (d) Diagram showing changes during ageing to the average expression level of the indicated HSC-associated genes in single Vwf+ and Vwf LT-HSCs from a. Detailed data in Supplementary Fig. 3. (e) Diagram showing changes during ageing to the average expression level of the indicated platelet-lineage-specific genes in single Vwf+ and Vwf LT-HSCs from a. Detailed data in Supplementary Fig. 4. (f) Diagram showing changes during ageing to the average expression level of the indicated myeloid lineage-specific genes in single Vwf+ and Vwf LT-HSCs from a. Data from Supplementary Fig. 5.
Figure 3
Figure 3. Aged HSCs show increased platelet bias at the single-cell level.
(a) Contribution of transplanted single young and old Vwf+ LT-HSCs to peripheral blood reconstitution, expressed as the average of their contributions to peripheral blood platelets, myeloid cells, B cells and T cells. The frequency of reconstitution is indicated as the ratio between reconstituted and transplanted mice. The significance of the difference in reconstitution between young and old Vwf+ LT-HSCs is shown (Mann–Whitney U-test). (b) Distribution of HSC subtypes in young Vwf+ LT-HSCs from a, excluding those with no contribution of at least 0.1% to at least one lineage. The number of clones fulfilling this criterion is indicated. (c) Analysis as in b for old Vwf+ LT-HSCs. (d) Representative examples of peripheral blood reconstitution by Pl-HSCs from young (top) and old (bottom) Vwf+ LT-HSC. (e) The ratio of myeloid to platelet reconstitution for Pl-HSCs derived from young and old Vwf+ LT-HSCs, respectively. The frequency of clones with only detectable platelet output was significantly higher for old Vwf+ LT-HSCs (Fisher's exact test). (f) Distribution of HSC lineage outputs in mice transplanted with five young Vwf LT-HSCs, excluding those with contribution <0.1% to all lineages. The number of clones fulfilling this criterion is indicated. (g) Analysis as in f for old Vwf LT-HSCs. Number of recipient mice transplanted, young Vwf+ N=81; young Vwf N=20; old Vwf+=56, old Vwf−: N=27. Time points for peripheral blood analysis post-transplantation are indicated in plots. Data are from five independent experiments (young N=3, old N=2).
Figure 4
Figure 4. Aged Vwf+ LT-HSCs show increased intrinsic myeloid bias at the population level.
(a) Experimental design to compare in vivo lineage output of transplanted young and old Vwf+ and Vwf LT-HSCs. (b) Donor contribution of young and old Vwf and Vwf+ LT-HSCs to total peripheral blood leucocytes at 16 week post-transplantation. Young Vwf: N=5; young Vwf+: N=11; old Vwf: N=9, old Vwf+: N=12). E: Vwf-EGFP; E+: Vwf-EGFP+. Data are from four independent competitive transplantation experiments. (c) Donor contribution to peripheral blood platelets measured at 16 week post-transplantation in experiments described in b. (d) Relative contribution of test cells to output of myeloid (left panel) and lymphoid (right panel) cells at 16 weeks post-transplantation from experiment described in b. Values were normalized to the level of CD45.2 chimerism (b) and are expressed relative to young Vwf recipients (=1). (e) Test cell contribution to BM LSKCD150+CD48CD34 LT-HSCs in mice from b 22 weeks after transplantation. E, Vwf-EGFP; E+, Vwf-EGFP+. Data are from three independent experiments. All data are mean values±s.e.m. *P<0.05; **P<0.01; ***P<0.001 (Student's t-test).
Figure 5
Figure 5. Alterations to phenotypic and functional progenitor levels in old mice.
(a) Lymphoid-primed multi-potent progenitors (LMPPs) as percentage of LSK cells in young (N=15) and old (N=7) mice. Data are from five independent experiments. (b) Frequencies of CLPs in total BM in young (N=9) and old (N=6) mice. Data are from five independent experiments. (c) Gating strategy for identification of myelo-erythroid progenitor populations. (d) Representative FACS plots of myelo-erythroid progenitors in BM from young (top) and old (bottom) Vwf-EGFP mice. Numbers indicate percentage of LinSca-1c-Kit+ cells. (e) Frequencies of myelo-erythroid progenitor cells as percentage of LinSca-1c-Kit+ cells in young (Y: N=6) and old (O: N=6) mice. Data are from six independent experiments. (f) Frequencies of CFU-Mk in unfractionated BM from young (N=3) and old (N=2) mice. Data are from a single experiment. (g) Frequencies of CFU-GM in unfractionated BM from young (N=3) and old (N=2) mice. Data are from a single experiment. (h) Frequencies of CFU-B in unfractionated BM from young (N=3) and old (N=2) mice. Data are from a single experiment. (i) Platelet counts in peripheral blood from young (N=22) and old (N=11) mice. Data are from three independent experiments. (j) Plasma levels of thrombopoietin in young (N=5) and old mice (N=5) each measured in triplicate by ELISA. Data are from a single experiment. All data are mean values±s.e.m. *P<0.05; **P<0.01; ***P<0.001 (Student's t-test).
Figure 6
Figure 6. FOG-1 is required for maintenance of myeloid-biased HSCs.
(a) Representative FACS plots showing CD150 and Vwf-EGFP expression in LSK cells from Vwf-FOG-1Con and Vwf-FOG-1cKO transplanted recipients. Numbers show percentages relative to parental gates. (b) Percentage of EGFP+ cells in test cell-derived (CD45.1CD45.2+) LSKCD150+ population from Vwf-FOGCon (Con; N=10) and Vwf-FOGcKO (cKO; N=8) transplanted mice. **P<0.01 (Student's t-test). Data are from two independent experiments. (c) Sixteen-week peripheral blood myeloid output from CD45.1CD45.2+Lin Vwf-EGFP and Vwf-EGFP+ fractions isolated from Vwf-FOG-1Con and Vwf-FOG-1cKO primary recipients (FOG1Con EGFP: N=13; FOG1Con EGFP+: N=7; FOG1cKO EGFP: N=10). The fraction of CD45.2 myeloid cells was normalized to the overall CD45.2 reconstitution. All data are mean values±s.d., after normalization to the mean value the FOG1Con EGFP fraction. ***P<0.0001, **P<0.01 (Student's t-test). Data are from two independent experiments. (d) Sixteen-week peripheral blood lymphoid output analysed and represented as in c. (e) Sixteen-week peripheral blood platelet output analysed and represented as in c, except that significance was measured using the Mann–Whitney U-test.

References

    1. Jones D. L. & Rando T. A. Emerging models and paradigms for stem cell ageing. Nat. Cell Biol. 13, 506–512 (2011). - PMC - PubMed
    1. Wang J., Geiger H. & Rudolph K. L. Immunoaging induced by hematopoietic stem cell aging. Curr. Opin. Immunol. 23, 532–536 (2011). - PubMed
    1. Woolthuis C. M., de Haan G. & Huls G. Aging of hematopoietic stem cells: Intrinsic changes or micro-environmental effects? Curr. Opin. Immunol. 23, 512–517 (2011). - PubMed
    1. Berliner N. Anemia in the elderly. Trans. Am. Clin. Climatol. Assoc. 124, 230–237 (2013). - PMC - PubMed
    1. Sudo K., Ema H., Morita Y. & Nakauchi H. Age-associated characteristics of murine hematopoietic stem cells. J. Exp. Med. 192, 1273–1280 (2000). - PMC - PubMed

Publication types