. 2016 Mar 29;14(12):3001-18.
doi: 10.1016/j.celrep.2016.02.078. Epub 2016 Mar 19.

Signaling Networks among Stem Cell Precursors, Transit-Amplifying Progenitors, and their Niche in Developing Hair Follicles

Affiliations

Signaling Networks among Stem Cell Precursors, Transit-Amplifying Progenitors, and their Niche in Developing Hair Follicles

Amélie Rezza et al. Cell Rep. .

Abstract

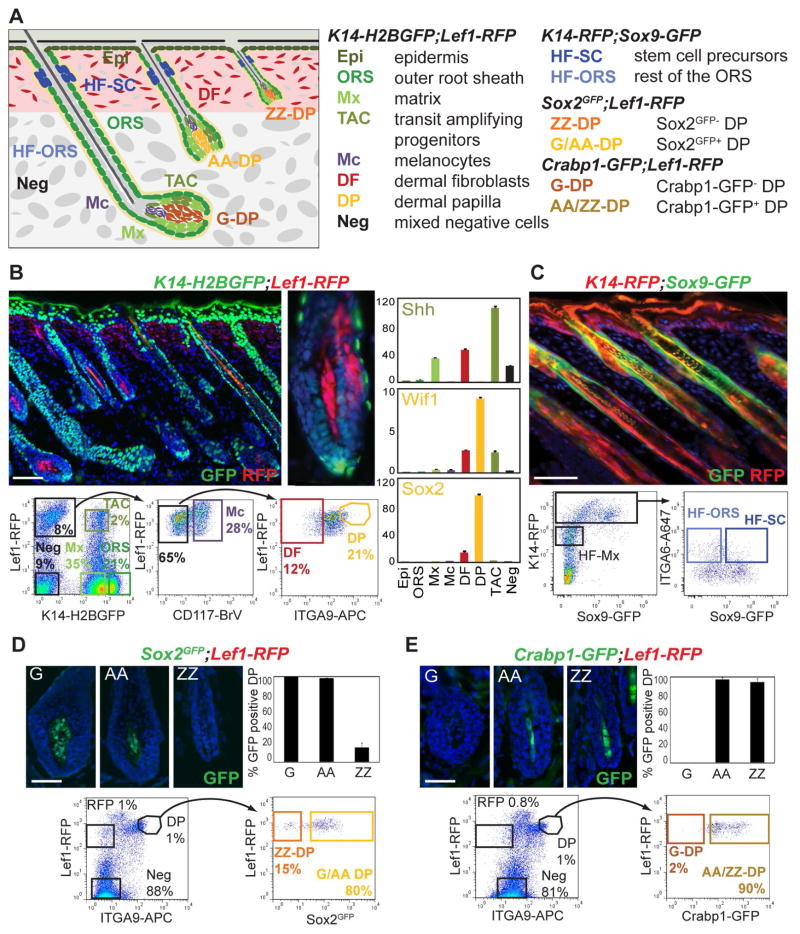
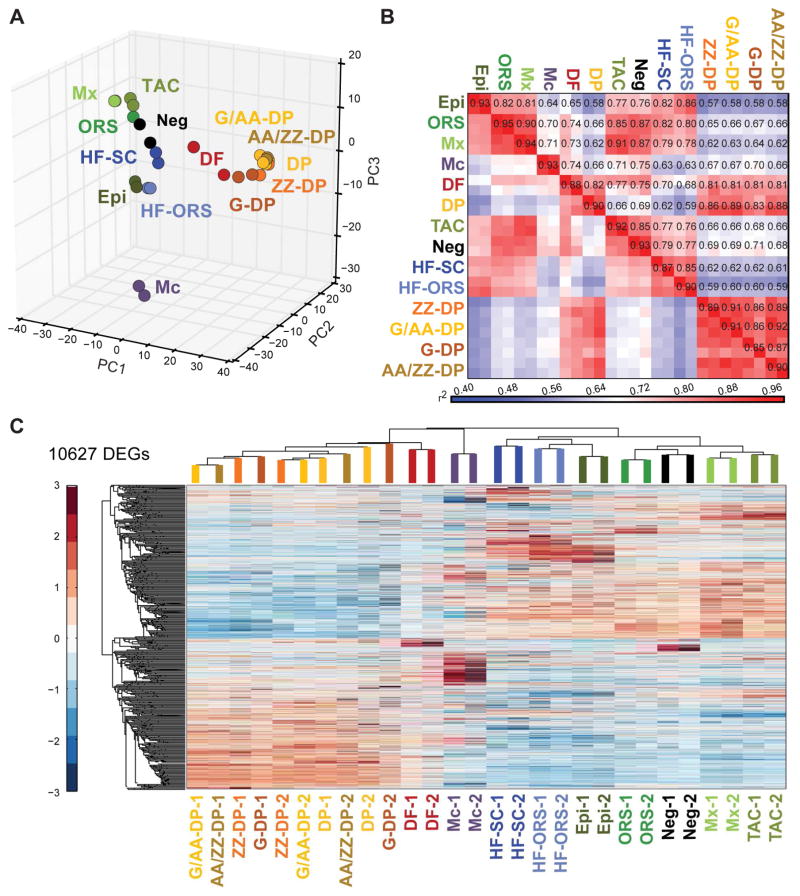
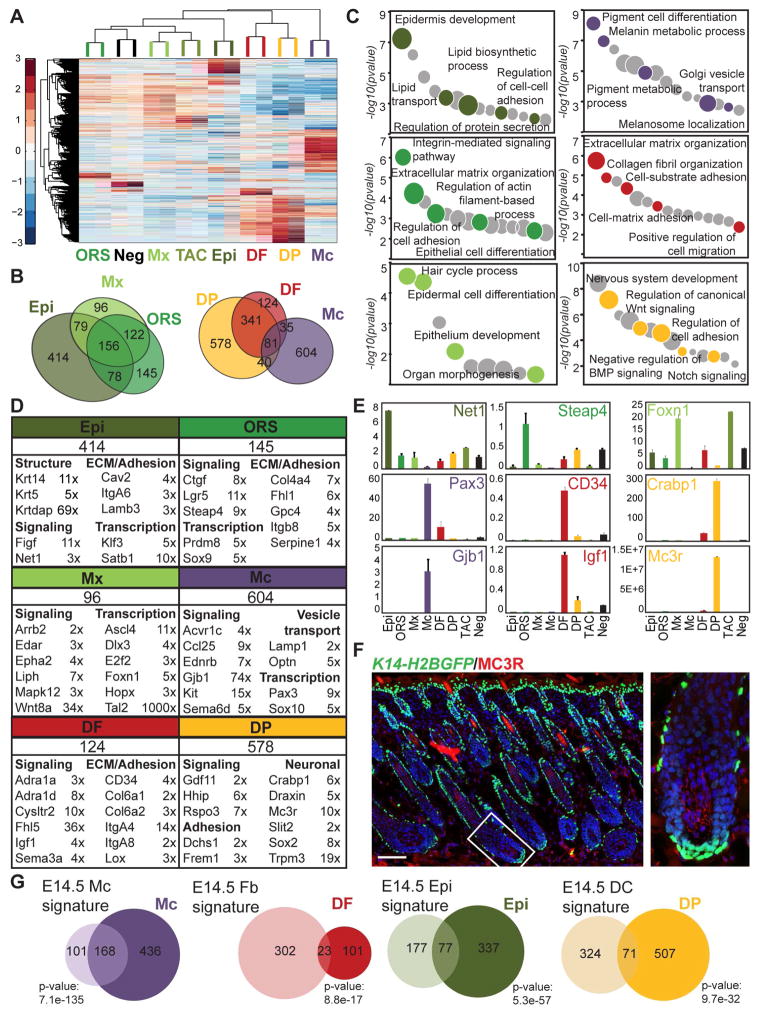
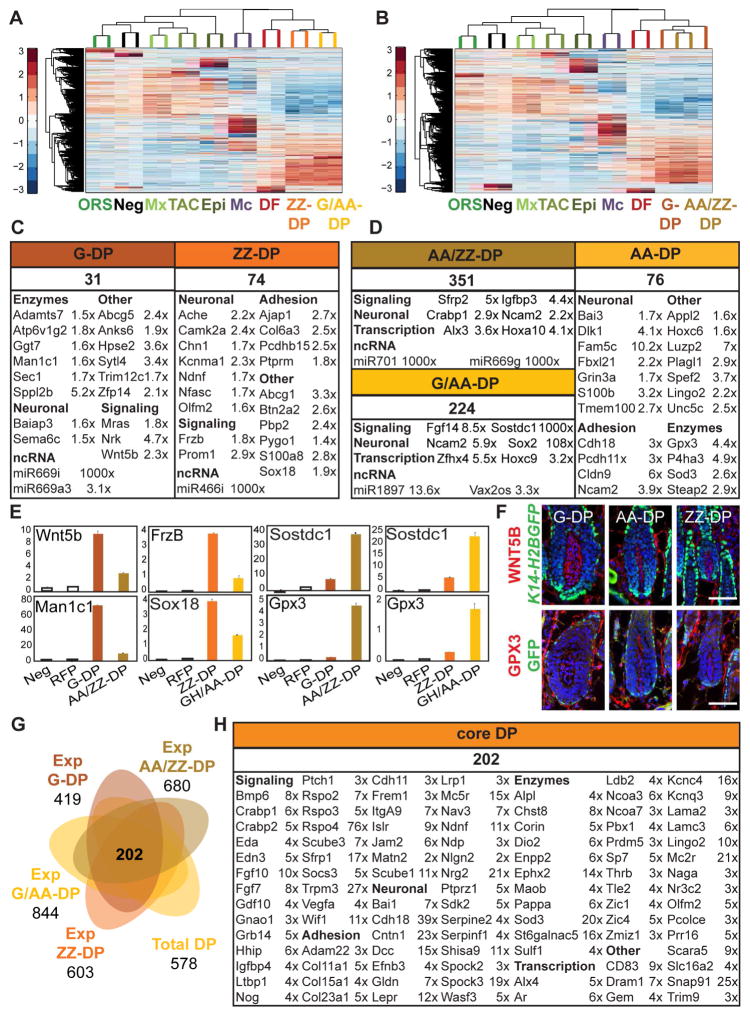
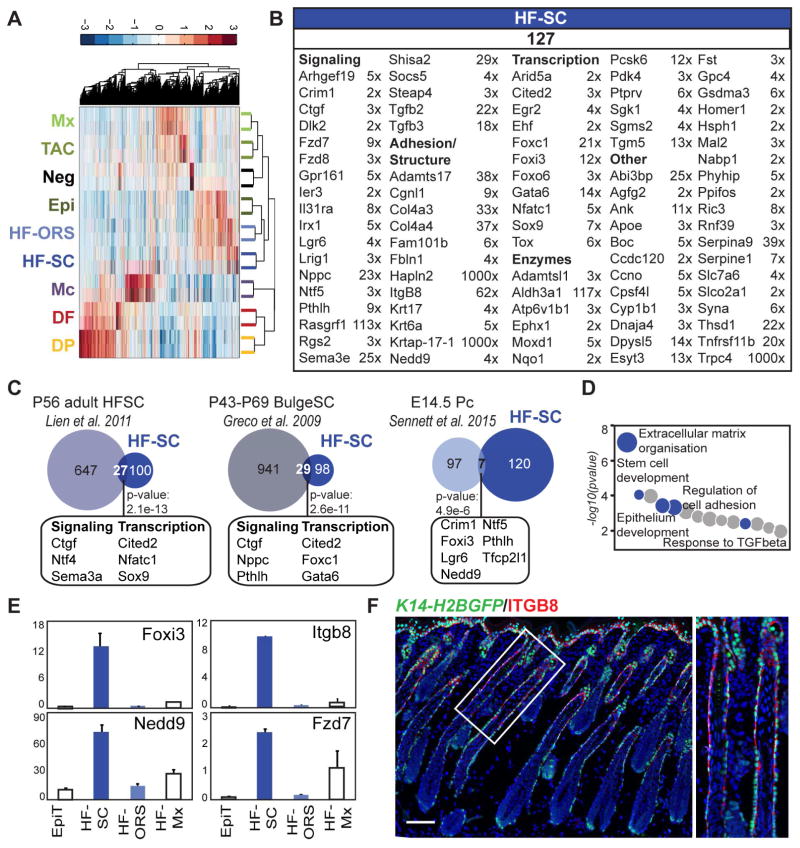
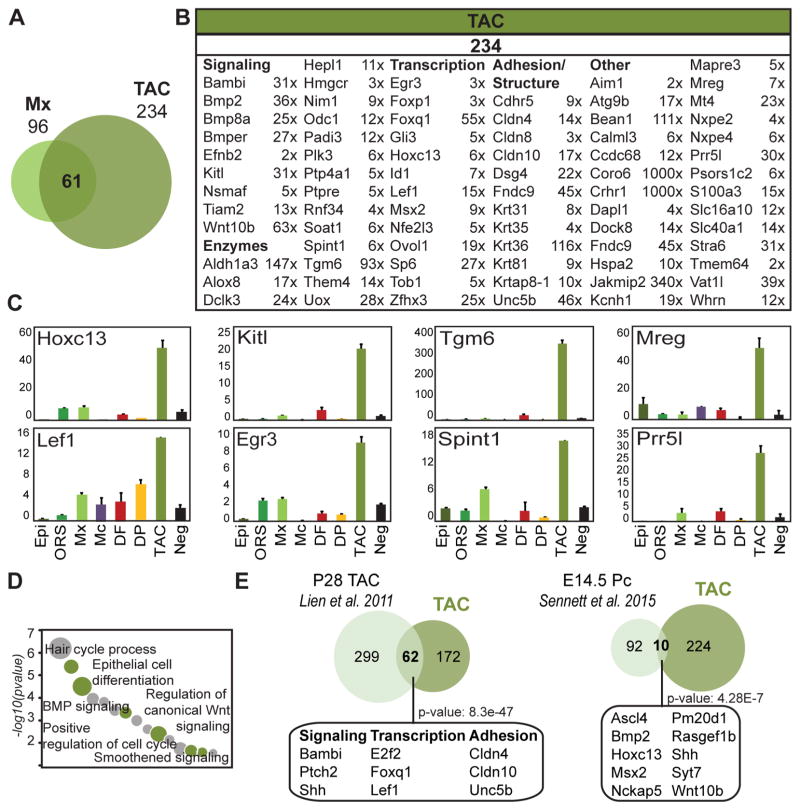
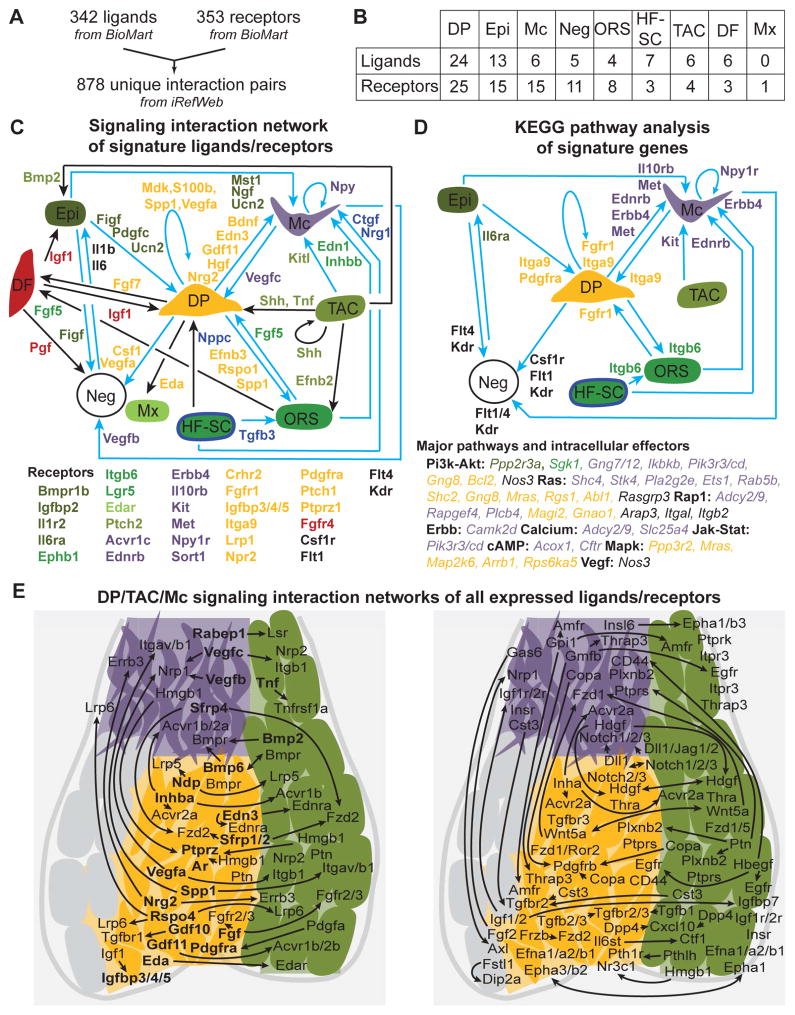
The hair follicle (HF) is a complex miniorgan that serves as an ideal model system to study stem cell (SC) interactions with the niche during growth and regeneration. Dermal papilla (DP) cells are required for SC activation during the adult hair cycle, but signal exchange between niche and SC precursors/transit-amplifying cell (TAC) progenitors that regulates HF morphogenetic growth is largely unknown. Here we use six transgenic reporters to isolate 14 major skin and HF cell populations. With next-generation RNA sequencing, we characterize their transcriptomes and define unique molecular signatures. SC precursors, TACs, and the DP niche express a plethora of ligands and receptors. Signaling interaction network analysis reveals a bird's-eye view of pathways implicated in epithelial-mesenchymal interactions. Using a systematic tissue-wide approach, this work provides a comprehensive platform, linked to an interactive online database, to identify and further explore the SC/TAC/niche crosstalk regulating HF growth.

Keywords: big data; dermal papilla; epithelial-mesenchymal interactions; hair follicle; hair growth; progenitors; signaling networks; stem cell niche; stem cells; systems biology; transcriptomics.


Figures

Figure 1
Figure 1. Multicolor cell sorting of stem cell precursors, transit amplifying progenitors, and their niche from developing hair follicles
(A) Schematic of postnatal day (P)5 back skin with hair follicles (HF) from the three HF developmental waves. Right: list of cell populations isolated from six different fluorescent reporter mouse lines in four double-transgenic combinations. (B) Isolation of eight main skin/HF populations from K14-H2BGFP;Lef1-RFP back skin. Top: P5 skin section shows strong H2BGFP expression in epithelial Epi and ORS cells, and RFP expression in upper DFs, the DP and Mc. Mx expresses low levels of H2BGFP. The Shh expressing subpopulation of TAC progenitors and few differentiating cells co-express H2BGFP and RFP. Bottom: FACS plots and gates for cell sorting from HF-enriched dermal preparations. Seven gates mark Mx, ORS, TAC, Mc, and DP from HFs, and DF and a mixture of negative cells (Neg) from the upper dermis. Right: qRT-PCR of known markers confirms TAC and DP enrichment. Data are mean ± SD from two measurements. (C) Isolation of HFSC precursors from K14-RFP;Sox9-GFP P5 back skin. Top: P5 skin section shows GFP expression in the upper ORS of the future bulge area. All epithelial cells are RFP. Bottom: FACS plots and gates for isolation of HFSC precursors and the remaining HF-ORS, and HF-Mx. (D,E) Isolation of pure DP subpopulations from P5 back skin. (D) Top: section of P5 Sox2GFP;Lef1-RFP back skin and GFP quantification shows GFP expression in G-DP and AA-DP cells, compared to ZZ-DP. (E) Top: section of P5 Crabp1-GFP;Lef1-RFP back skin and GFP quantification shows GFP expression in AA-DP and ZZ-DP cells, but not in G-DP. Bottom: FACS plots and gates for sorting. Note that all DP subpopulations are highly enriched as RFP+ and ITGA9+ cells. Scale bars are 100 μm (B, C), 20 μm (D, E). See also Figure S1.
Figure 2
Figure 2. Transcriptome analyses of 14 distinct skin/hair follicle cell populations with next-generation RNA-sequencing
(A) Principal component analysis of all expressed genes with PC1 (42.07% variance captured), PC2 (11.64% variance captured), and PC3 (7.97% variance captured). (B) Heat map of coefficient of determination (r2) for gene expression profiles of all skin/HF populations. (C) Hierarchical clustering of differentially expressed genes (DEG, p-value < 0.05). Note that DP populations are highly similar with replicates not clustering together. DEGs are listed in Table S2.
Figure 3
Figure 3. Molecular signatures of eight main skin/HF cell populations
(A) Hierarchical clustering of significantly enriched genes identified by ANOVA of the main eight skin/HF populations from the K14-H2BGFP;Lef1-RFP sort. (B) Venn diagrams of cell-type specific signatures. The overlaps represent commonly enriched genes in corresponding populations compared to all others. Overlapping gene lists are in Table S4. (C) Gene ontology analysis of molecular signatures. Notable terms are highlighted; all terms are listed in Table S5. (D) Total number of signature genes with listed representative cell-type specific markers organized according to functional categories. Fold-change enrichment is indicated. FPKM fold changes are between Epi vs. ORS, ORS vs. Mx, Mx vs. ORS, Mc vs. DF, DF vs. DP, and DP vs. DF. FDR of q < 0.05; p-value < 0.05. Gene lists are provided in Table S3. (E) qRT-PCR validation of selected signature genes, relative expression is to dermis. Data are mean ± SD from two measurements. See also Figure S2. (F) Immunofluorescence staining for DP marker MC3R on K14-H2BGFP P5 back skin section. Scale bar is 100 μm. (G) Comparison of P5 signatures with embryonic signatures from Sennett et al., 2015. Overlapping genes are listed in Table S6. Statistically significant overlap was calculated with Fisher’s exact test.
Figure 4
Figure 4. Hair type-specific DP subpopulations are highly similar and express only few signature genes
(A, B) Hierarchical clustering of significantly enriched genes identified by ANOVA for hair type-specific DP subpopulations from the (A) Sox2GFP;Lef1-RFP and (B) Crabp1-GFP;Lef1-RFP sorts. (C, D) DP subpopulation-specific molecular signatures. Signature genes are organized according to functional categories. Indicated FPKM fold changes are between (C) G-DP vs. AA/ZZ-DP, ZZ-DP vs. G/AA-DP, and (D) AA/ZZ-DP vs. G-DP, G/AA-DP vs. ZZ-DP. The AA-DP signature is a logical list of shared enriched genes in AA/ZZ-DP and G/AA- DP compared to each pure G-DP and ZZ-DP (fold change average). FDR of q < 0.05; p-value < 0.05. Gene lists are provided in Table S3. (E) qRT-PCR validation of signature genes, relative expression is to dermis. Data are mean ± SD from two measurements. See also Figure S3. (F) Immunofluorescence stainings for G-DP marker WNT5B and AA-DP marker GPX3 on K14-H2BGFP P5 back skin sections. Note that although these proteins are expressed in the DP subpopulation, they are also expressed in DPs of other hair types. Scale bar is 20 μm. (G) Venn diagram of expanded and total DP gene lists. The expanded DP subpopulation signature includes enriched genes compared to all other cell types except DP. The overlap between the four expanded DP subpopulation and total DP signatures represents the core DP signature of shared genes in all five DP populations. Expanded DP gene lists are provided in Table S3. (H) The core DP molecular signature. Signature genes are organized according to functional categories. Average FPKM fold changes are shown of all DP signatures vs. DF. FDR of q < 0.05; p-value < 0.05. The full core DP signature is listed in Table S3.
Figure 5
Figure 5. Molecular characterization of bulge stem cell precursors
(A) Hierarchical clustering of significantly enriched genes identified by ANOVA for HFSC precursors and the remaining ORS subpopulation from the K14-RFP;Sox9-GFP sort. (B) HFSC precursor-specific molecular signature. Signature genes are organized according to functional categories. FPKM fold changes are between HF-SC vs. HF-ORS. FDR of q < 0.05; p-value < 0.05. Gene lists are provided in Table S3. (C) Comparison of the HFSC precursor signature with previously published embryonic placode (Pc) progenitor and adult bulge gene signatures. Some overlapping genes are listed here; all are in Table S6. Statistically significant overlap was calculated with Fisher’s exact test. (D) Gene ontology analysis of the HFSC precursor signature. Notable terms are highlighted; all terms are listed in Table S5. (E) qRT-PCR validation of selected signature genes, relative expression is to dermis. Data are mean ± SD from two measurements. See also Figure S4. (F) Immunofluorescence staining for HFSC precursor marker ITGB8 on K14-H2BGFP P5 back skin section. Scale bar is 100 μm.
Figure 6
Figure 6. Molecular characterization of a transit amplifying progenitor TAC subpopulation in developing hair follicles
(A) Overlapping expanded signatures of Mx and TAC. 61 genes were found commonly enriched in both populations and are listed in Table S6. (B) TAC-specific molecular signature. Signature genes are organized according to functional categories. FPKM fold changes are between TAC vs. ORS. FDR of q < 0.05; p-value < 0.05. Gene lists are provided in Table S3. (C) qRT-PCR validation of selected signature genes, relative expression is to dermis. Data are mean ± SD from two measurements. (D) Gene ontology analysis of the TAC signature. Notable terms are highlighted; all terms are listed in Table S5. (E) Comparison of P5 TAC signature with previously published adult TAC and embryonic placode (Pc) progenitor signatures. Some common factors are listed here; all are in Table S6. Statistically significant overlap was calculated with Fisher’s exact test.
Figure 7
Figure 7. Signaling interaction network in growing hair follicles of developing skin
(A) A ligand and receptor database containing 878 unique interaction pairs. See Table S7. (B) Ligands and receptors present in the gene signatures identified in this study. Gene lists are in Table S7. (C) Cell-cell communication network constructed from signature ligands and receptors of each cell population. Signature ligands are color-coded for the source population. Color-coded signature receptors in target cells are listed below. Blue arrows denote interactions also found in KEGG pathway analysis (Figure 7D). All interactions are listed in Table S7. (D) KEGG pathway analysis of signatures. Color-coded signature receptors of enriched KEGG pathways are next to the arrows. The major pathways and color-coded intracellular signature effectors in the target cell population are listed below. Note that numerous other KEGG pathway members were found in the signatures (Table S7). All interactions are listed in Table S7. (E) DP/TAC/Mc interaction network with all expressed ligands and receptors, independent of signature status. Left: 50 ligand/receptor interaction pairs with either ligand or receptor a signature gene. Signature genes are in bold. Right: 73 non-signature ligand/receptor interactions. Arrows connect source with target populations. All interactions are listed in Table S7.

References

    1. Buac K, Xu M, Cronin J, Weeraratna AT, Hewitt SM, Pavan WJ. NRG1 / ERBB3 signaling in melanocyte development and melanoma: inhibition of differentiation and promotion of proliferation. Pigment Cell Melanoma Res. 2009;22:773–784. - PMC - PubMed
    1. Chen EY, Tan CM, Kou Y, Duan Q, Wang Z, Meirelles GV, Clark NR, Ma’ayan A. Enrichr: interactive and collaborative HTML5 gene list enrichment analysis tool. BMC Bioinformatics. 2013;14:128. - PMC - PubMed
    1. Chi W, Wu E, Morgan BA. Dermal papilla cell number specifies hair size, shape and cycling and its reduction causes follicular decline. Development. 2013;140:1676–1683. - PMC - PubMed
    1. Clavel C, Grisanti L, Zemla R, Rezza A, Barros R, Sennett R, Mazloom AR, Chung CY, Cai X, Cai CL, et al. Sox2 in the dermal papilla niche controls hair growth by fine-tuning BMP signaling in differentiating hair shaft progenitors. Dev Cell. 2012;23:981–994. - PMC - PubMed
    1. DasGupta R, Fuchs E. Multiple roles for activated LEF/TCF transcription complexes during hair follicle development and differentiation. Development. 1999;126:4557–4568. - PubMed

Publication types