. 2016 Jul:106:57-66.
doi: 10.1016/j.mvr.2016.03.006. Epub 2016 Mar 21.

MicroCT angiography detects vascular formation and regression in skin wound healing

Affiliations

MicroCT angiography detects vascular formation and regression in skin wound healing

Norifumi Urao et al. Microvasc Res. 2016 Jul.

Abstract

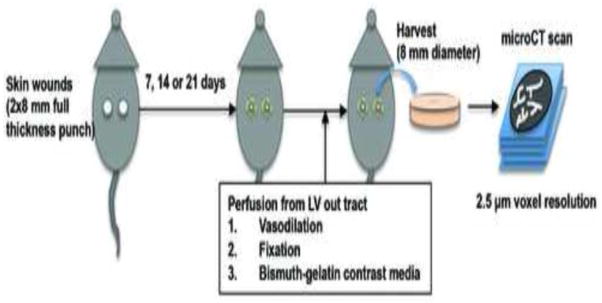
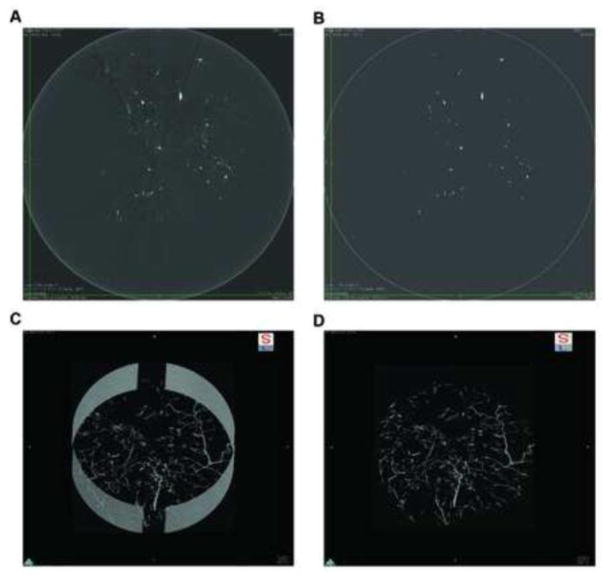
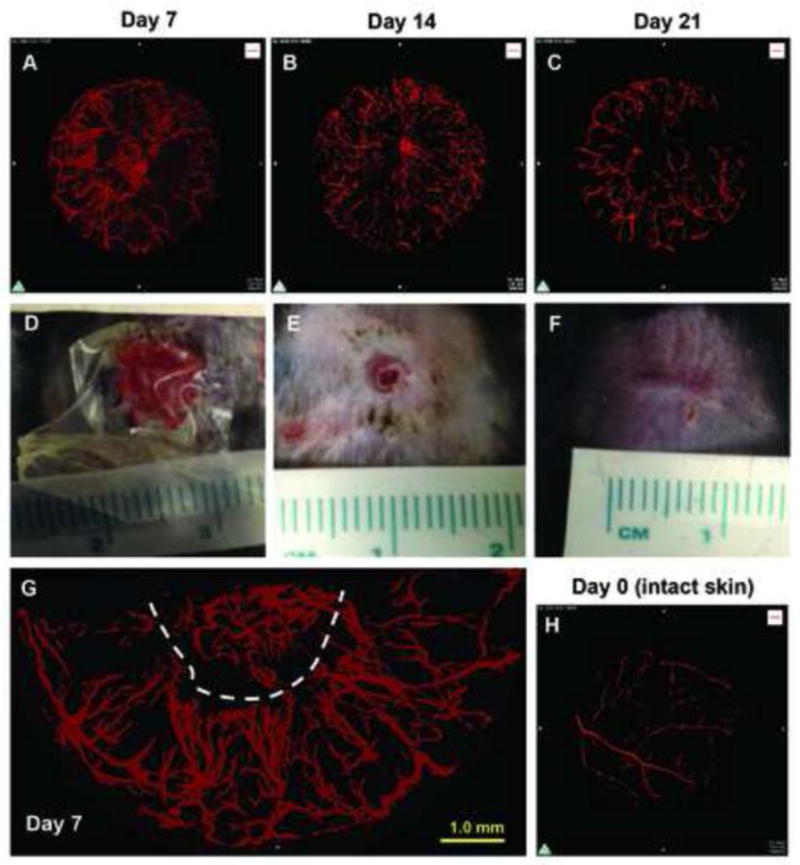
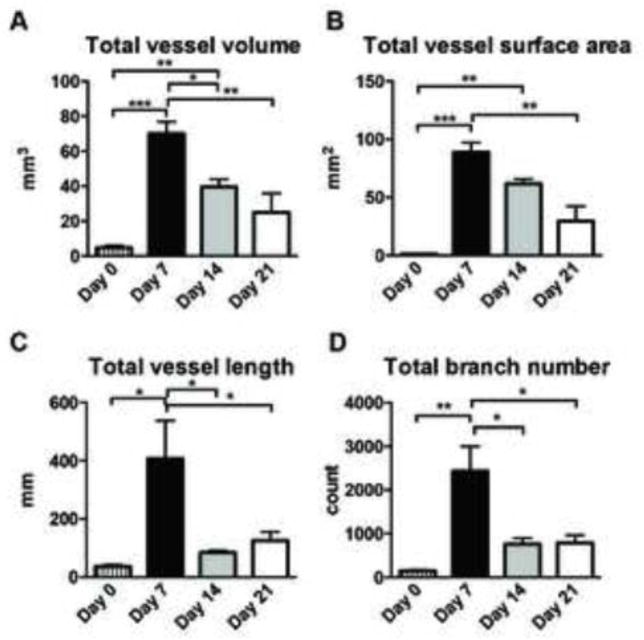
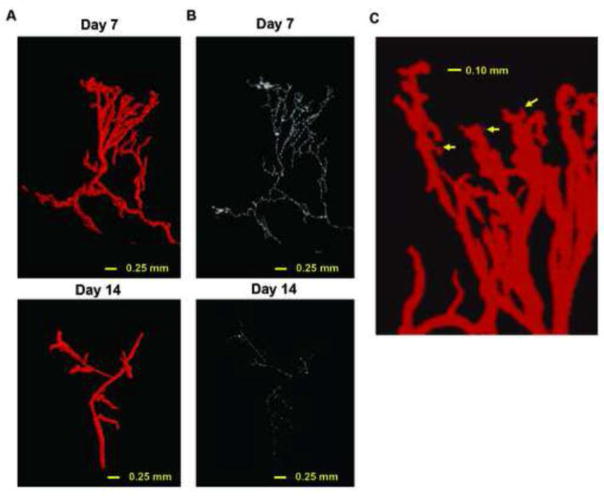
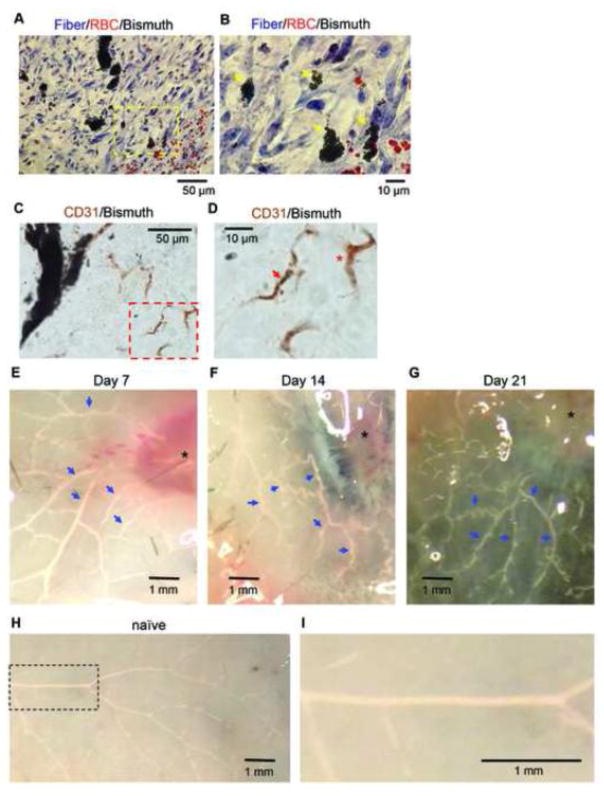
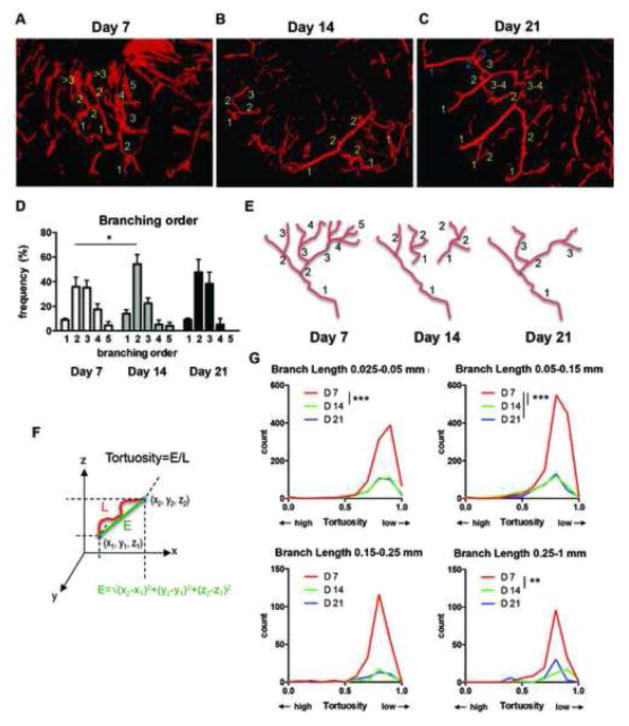
Properly regulated angiogenesis and arteriogenesis are essential for effective wound healing. Tissue injury induces robust new vessel formation and subsequent vessel maturation, which involves vessel regression and remodeling. Although formation of functional vasculature is essential for healing, alterations in vascular structure over the time course of skin wound healing are not well understood. Here, using high-resolution ex vivo X-ray micro-computed tomography (microCT), we describe the vascular network during healing of skin excisional wounds with highly detailed three-dimensional (3D) reconstructed images and associated quantitative analysis. We found that relative vessel volume, surface area and branching number are significantly decreased in wounds from day 7 to days 14 and 21. Segmentation and skeletonization analysis of selected branches from high-resolution images as small as 2.5μm voxel size show that branching orders are decreased in the wound vessels during healing. In histological analysis, we found that the contrast agent fills mainly arterioles, but not small capillaries nor large veins. In summary, high-resolution microCT revealed dynamic alterations of vessel structures during wound healing. This technique may be useful as a key tool in the study of the formation and regression of wound vessels.

Keywords: Angiogenesis; Angiography; Micro-computed tomography; Three-dimensional; Wound healing.


Figures

Figure 1
Figure 1
Schematic overview of study protocol for micro-computed tomography (microCT) of wound vascular structure during mouse skin wound healing. C57Bl/6 mice were subjected to two 8 mm full-thickness wounds on the dorsal skin. At the indicated times, mice received systemic perfusion of vasodilation solution, fixative and bismuth-gelatin X-ray contrast media through the left ventricle (LV) out tract of the heart. Wound specimens were harvested as 8 mm diameter skin samples, and were scanned by X-ray microCT with very high-resolution (2.5 μm voxel size) setting.
Figure 2
Figure 2
Image processing of micro-computed tomography (microCT) images for three-dimensional (3D) rendering and analysis. A, a representative image slice of the wound specimen scanned by microCT with high-resolution, visualized by DICOM viewer, OsiriX. B, a resampled image of the same cross section from A with empirically determined threshold to eliminate background X-ray absorbance. C, 3D reconstructed image using maximum image projection program on OsiriX (5 μm voxel size). D, the same 3D image as C trimmed to eliminate artifacts from the specimen holder (9 mm diameter).
Figure 3
Figure 3
Three-dimensional reconstruction of the vascular network in healing wounds of mouse dorsal skin by micro-computed tomography (microCT) angiography in C57Bl/6 mice. A–C, representative images of 3D reconstructions of wound vasculature at indicated time points as acquired by X-ray microCT at 2.5-μm voxel resolution followed by post scan processing and 3D reconstruction. D–F, photos of one of two dorsal skin wounds at indicated time points after introduction of 8 mm excisional wounds. G, representative magnified 2D projection of 3D image from day 7 (the same sample as A). Dotted line indicates estimated wound edge. H, 3D reconstructions of vasculature on day 0 or of intact skin.
Figure 4
Figure 4
Three-dimensional analysis of vasculature structures of skin wounds obtained by microCT angiography. To handle data from a wound volume (8 mm diameter and around 2.7 mm thickness), image files were resampled by 10% on OsiriX, resulting in reduced image resolution to 25-μm voxel. This newly created image file was loaded to Fiji (ImageJ) software and was analyzed by the 3D object counter and the Skeletonize3D/AnalyzeSkeleton plugin programs. A, total vessel volume, B, total vessel surface area, C, total vessel length and D, total branch number per effective wound volume, which was measured by total scanned volume subtracted by avascular volume (n=3, n=6, n=3 and n=3 on day 0, 7, 14 and 21, respectively). Statistics was performed by two-way ANOVA with Tukey’s multiple comparison test (*p<0.05, **p<0.01 and ***p<0.001). Data are shown as mean±SEM.
Figure 5
Figure 5
Segmentation of vessel branches and very high-resolution three-dimensional analysis of vasculature structures of skin wounds obtained by microCT angiography. A, representative 3D segmented branch from wound vessels on day 7 (upper) and 14 (lower). B, skeletonized 3D branch from the segmented branch shown in A on day 7 (upper) and 14 (lower). C, zoom-in snapshot of maximum intensity projection image of wound edge lesion on day 7 (the same sample as A but from different angle of view). Arrows indicate small arteriole-like branches.
Figure 6
Figure 6
A, a representative histologic image from day 7 with Masson Trichrome staining (40x objective, from n=3 mice perfused with the contrast agent). B, magnified image of yellow-dotted rectangle area in (A). Black small particle accumulations are the bismuth-gelatin contrast (yellow arrows). Red staining particles are red blood cells. C, a representative histologic image from day 7 demonstrating immunostaining for CD31, an endothelial cell marker (40x objective, from n=4 mice perfused with the contrast agent). D, magnified image of red-dotted rectangle area in (C) shows CD31 positive capillary-like structure with bismuth particles (red arrow) and without the particles (asterisk). E–H, photo snapshots of harvested skin after the contrast perfusion at indicated time points. Vessels filled with the contrast agent are seen as white (blue arrows). Asterisks indicate wounds. I, a magnified image of a dotted rectangle in (G).
Figure 7
Figure 7
A–C, representative 3D reconstruction of skin vascular structures by microCT angiography at indicated time point after wounding. The numbers of each different color represent examples of branching orders counted manually on 3D skeletonized branches. D, results from 252, 144 and 48 total segmented branches from day 7, 14 and 21 specimens, respectively. Statistics was made by two-way ANOVA with Tukey’s multiple comparisons test (*P<0.05). E, a model of alteration of the branching order over time during wound healing (see text). F, schematic presentation of Euclidean distance (E) and tortuosity=E/L. L indicates length of a vessel segment. G, vessel tortuosity of each branch was defined by Euclidean distance/length of each skeletonized branch (2085, 1514 and 345 total segmented branches from day 7, 14 and 21 specimens, respectively). Distribution of number of vessel with particular tortuosity in 8 mm diameter volume of wounds was calculated based on skeletonized branch length distribution (see Supplemental Figure) and total vessel number obtained in Figure 4D. Statistics were made by nonparametric Kruskal-Wallis test with Dunn’s multiple comparisons test (**P<0.01, ***P<0.001). Data are shown as mean±SEM.
Figure 8
Figure 8
Representative 3D reconstruction of skin vascular structures by microCT angiography on day 7 after wounding in lean mice (left) and diet-induced obesity (DIO) mice (n=3).

References

    1. Guo S, Dipietro LA. Factors affecting wound healing. J Dent Res. 2010;89(3):219–29. doi: 10.1177/0022034509359125. - DOI - PMC - PubMed
    1. Brem H, Tomic-Canic M. Cellular and molecular basis of wound healing in diabetes. The Journal of clinical investigation. 2007;117(5):1219–22. doi: 10.1172/JCI32169. - DOI - PMC - PubMed
    1. DiPietro LA. Angiogenesis and scar formation in healing wounds. Current opinion in rheumatology. 2013;25(1):87–91. doi: 10.1097/BOR.0b013e32835b13b6. - DOI - PubMed
    1. Carmeliet P, Jain RK. Molecular mechanisms and clinical applications of angiogenesis. Nature. 2011;473(7347):298–307. doi: 10.1038/nature10144. - DOI - PMC - PubMed
    1. Heil M, Eitenmuller I, Schmitz-Rixen T, Schaper W. Arteriogenesis versus angiogenesis: similarities and differences. J Cell Mol Med. 2006;10(1):45–55. - PMC - PubMed

Publication types