. 2017 Mar;10(3):394-403.
doi: 10.1002/jbio.201500313. Epub 2016 Mar 24.

Non-invasive optical assessment of viscosity of middle ear effusions in otitis media

Affiliations

Non-invasive optical assessment of viscosity of middle ear effusions in otitis media

Guillermo L Monroy et al. J Biophotonics. 2017 Mar.

Abstract

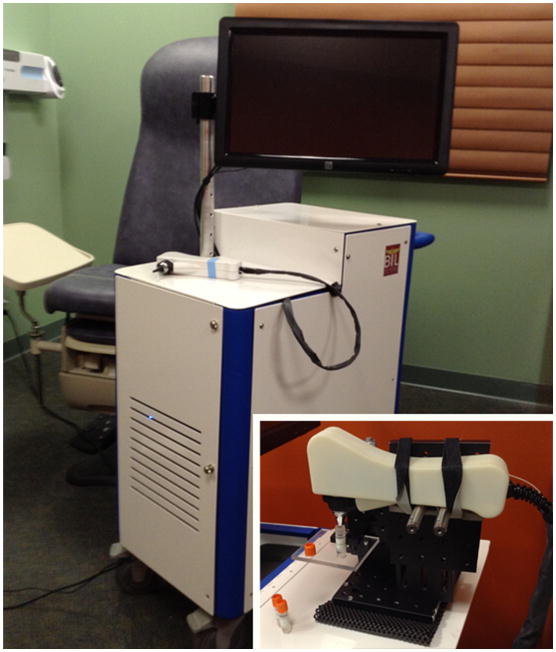
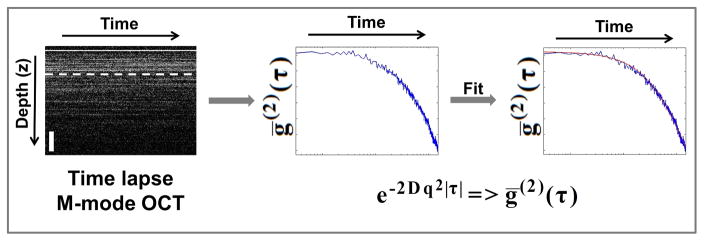
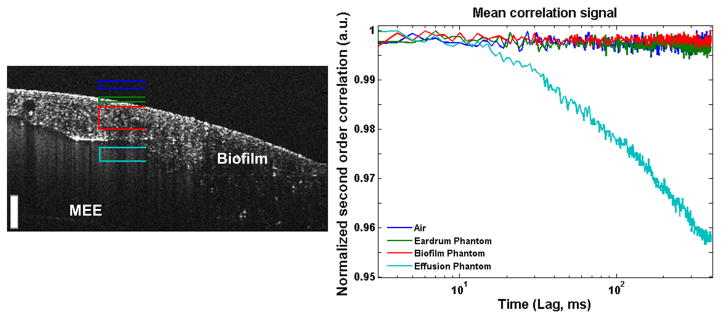
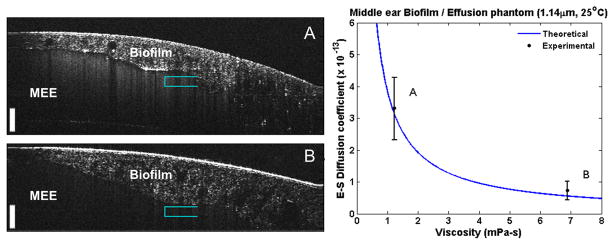
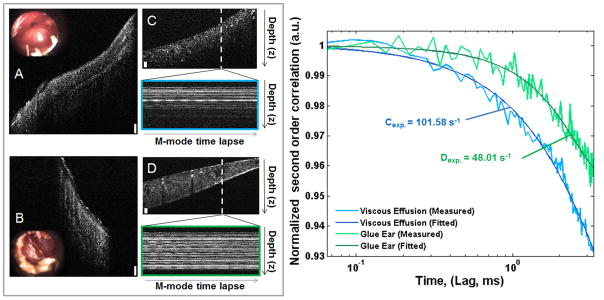
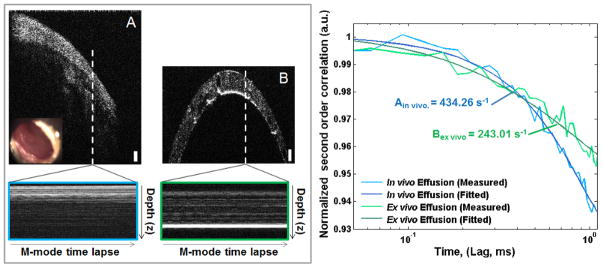
Eustachian tube dysfunction can cause fluid to collect within the middle ear cavity and form a middle ear effusion (MEE). MEEs can persist for weeks or months and cause hearing loss as well as speech and learning delays in young children. The ability of a physician to accurately identify and characterize the middle ear for signs of fluid and/or infection is crucial to provide the most appropriate treatment for the patient. Currently, middle ear infections are assessed with otoscopy, which provides limited and only qualitative diagnostic information. In this study, we propose a method utilizing cross-sectional depth-resolved optical coherence tomography to noninvasively measure the diffusion coefficient and viscosity of colloid suspensions, such as a MEE. Experimental validation of the proposed technique on simulated MEE phantoms with varying viscosity and particulate characteristics is presented, along with some preliminary results from in vivo and ex vivo samples of human MEEs. In vivo Optical Coherence Tomography (OCT) image of a human tympanic membrane and Middle Ear Effusion (MEE) (top), with a CCD image of the tympanic membrane surface (inset). Below is the corresponding time-lapse M-mode OCT data acquired along the white dotted line over time, which can be analyzed to determine the Stokes-Einstein diffusion coefficient of the effusion.

Keywords: biofilm; diffusion coefficient; dynamic light scattering; ear infection; middle ear effusion; optical coherence tomography.


Conflict of interest statement

Conflict of Interest statement

S.A.B., R.L.S., and R.M.N. are co-founders of PhotoniCare, Inc., which is commercializing optical coherence tomography for imaging the ear. The remaining authors have no other funding, financial relationships, or conflicts of interest to disclose.

Figures

Fig. 1
Fig. 1
Handheld optical imaging system utilizing OCT. System is designed to be portable and can be easily transported to and from clinical sites. Handheld probe utilizes interchangeable tips to allow for both a wide field-of-view during benchtop imaging as well as compatibility with speculum tips used during human subject imaging. Inset: Handheld probe in a mounted configuration used to measure phantom samples or aspirated ex vivo middle ear effusions.
Fig. 2
Fig. 2
Data analysis and processing flow: (Left) Starting with time-lapse axial depth scans (A-lines), a depth is selected and the intensity autocorrelation decay curve (Blue) is calculated (center). The analytical expression for the second order intensity autocorrelation is fitted (Red) to the experimentally obtained temporal intensity autocorrelation data (Blue) to estimate the diffusion coefficient D. M-mode OCT scale bar is approximately 200 μm in depth. (2)(τ): averaged temporal intensity-based autocorrelation function, D: Stokes-Einstein diffusion constant and q: scanning parameter as defined in the text.
Fig. 3
Fig. 3
Experimentally determined Stokes-Einstein diffusion coefficients for microparticle solutions of varying particle sizes or viscosity. Blue curves show the theoretical trend for both cases, and the gray shaded areas define the approximate accuracy of the calculated theory, which is a function of microparticle manufacturing tolerances. Left: Observed microparticles of increasing diameter (A = 0.54 μm, B = 1.14 μm, C = 1.73 μm) suspended in water at room temperature. Right: Observed 1.14 μm particles suspended in water and glycerol mixtures of varying increasing viscosity (B = 100/0, D = 90/10, E = 70/30, F = 50/50; % vol/vol) at room temperature. Average and standard deviation of measured data are displayed (N = 20). Note: Point B in both plots reflects the same data point.
Fig. 4
Fig. 4
Results of testing the feasibility of the proposed method for non-invasive characterization of MEEs in a middle ear phantom. Different depth ranges corresponding to air above the phantom (Dark Blue), simulated TM (Green), simulated biofilm (Red), and simulated effusion (Teal) were analyzed using the proposed technique. As expected, only the simulated effusion provides a meaningful decay curve (right). Scale bar is 100 micron in depth.
Fig. 5
Fig. 5
Stokes-Einstein diffusion coefficient measurements of middle ear phantoms. The phantoms (A, B) each contain a different effusion-like suspension (suspension of water, glycerol, and micro-particle mixtures) to mimic the physiological qualities of a ‘serous’ and ‘mucoid’ middle ear effusion. Scale bars represent 100 μm in depth. Right: Calculated S-E diffusion coefficients from effusions plotted against the theoretical trend. Measurements taken near teal-colored brackets (N = 15).
Fig. 6
Fig. 6
Comparison of two ex vivo MEEs. (A, B): In vivo cross-sectional OCT images and inset video otoscope stills. (C, D): Corresponding ex vivo cross-sectional OCT images of MEE in exudate trap after aspiration, with M-mode time-lapse data (OCT A-scans taken repeatedly at the white dotted line over time) displayed below. All scale bars are approximately 100 μm in depth. Right: Decay curves for both C (Blue, Γ =101.58 s−1) and D (Green, Γ = 48.01 s−1) ex vivo MEE samples.
Fig. 7
Fig. 7
Comparison of MEE in vivo, and ex vivo after aspiration. (A): In vivo cross-sectional image and inset video otoscope still. (B): Ex vivo cross-sectional image from a cylindrical transparent exudate trap. Below: M-mode time-lapse data, single OCT A-scans taken repeatedly at the white dotted line through time. Scale bars approximately 100 μm in depth. Right: Decay curves for both A (Blue, Γ = 434.26 s−1) and B (Green, Γ = 243.01 s−1) MEE. Although observing the same sample, changes in the decay constants shows the viscosity related changes induced after aspiration and cooling.

References

    1. Ramakrishnan KSR, Berryhill WE. American Family Physician. 2007;76:11. - PubMed
    1. Takeuchi K, Saida S, Majima Y, Sakakura Y. European Archives of Oto-Rhino-Laryngology. 1990;247(5):323–325. - PubMed
    1. Haggard M. British Society of Audiology. 1999;34:121–123.
    1. Paparella MM. Annals of Otology Rhinology and Laryngology. 1976;85(2):8–11. - PubMed
    1. American Academy of Pediatrics Subcommittee on Otitis Media With Effusion. Pediatrics. 2004;113(5):1412–1429. - PubMed

Publication types