. 2016 Mar 24:6:23428.
doi: 10.1038/srep23428.

Reproducibility of radiomics for deciphering tumor phenotype with imaging

Affiliations

Reproducibility of radiomics for deciphering tumor phenotype with imaging

Binsheng Zhao et al. Sci Rep. .

Abstract

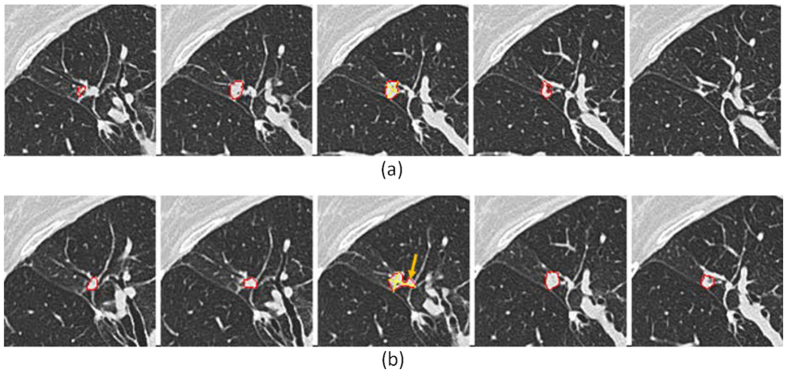
Radiomics (radiogenomics) characterizes tumor phenotypes based on quantitative image features derived from routine radiologic imaging to improve cancer diagnosis, prognosis, prediction and response to therapy. Although radiomic features must be reproducible to qualify as biomarkers for clinical care, little is known about how routine imaging acquisition techniques/parameters affect reproducibility. To begin to fill this knowledge gap, we assessed the reproducibility of a comprehensive, commonly-used set of radiomic features using a unique, same-day repeat computed tomography data set from lung cancer patients. Each scan was reconstructed at 6 imaging settings, varying slice thicknesses (1.25 mm, 2.5 mm and 5 mm) and reconstruction algorithms (sharp, smooth). Reproducibility was assessed using the repeat scans reconstructed at identical imaging setting (6 settings in total). In separate analyses, we explored differences in radiomic features due to different imaging parameters by assessing the agreement of these radiomic features extracted from the repeat scans reconstructed at the same slice thickness but different algorithms (3 settings in total). Our data suggest that radiomic features are reproducible over a wide range of imaging settings. However, smooth and sharp reconstruction algorithms should not be used interchangeably. These findings will raise awareness of the importance of properly setting imaging acquisition parameters in radiomics/radiogenomics research.


Figures

Figure 1
Figure 1. A lung tumor captured on one CT scan reconstructed at 6 different imaging settings:
1.25mm slice thickness with the lung reconstruction algorithm (sharp image) (1.25L) (a) and the standard reconstruction algorithm (smooth image) (1.25S) (b); 2.5mm slice thickness with lung reconstruction (2.5L) (c) and standard reconstruction (2.5S) (d); 5mm slice thickness with lung reconstruction (5L) (e) and standard reconstruction (5S) (f).
Figure 2
Figure 2. Inconsistency in tumor segmentation on repeat CT scans.
This example shows a small tumor (tumor #17; 10.7 mm in diameter) in the vicinity of blood vessels. Segmentation results (tumor contours in red) are superimposed on the original images. Only the tumor was delineated on the first scan (a), but a part of the surrounding vessels was included along with the tumor on the repeat scan images (arrow) (b). The imaging setting was 1.25mm slice thickness and lung reconstruction (1.25L)
Figure 3
Figure 3. CCC plots of three example image features before removing the outlier tumor.
After removing tumor #17, the CCC values changed from (a) 0.28 to 0.76 for Wavelet_DWT_LD at 5S, and (b) 0.44 to 0.53 for Roundness-Factor_2D at 1.25L. The CCC value remained unchanged (0.98) for Density_Mean at 1.25L (c).
Figure 4
Figure 4. CCC heat map of radiomic features.
The CCCs (0 to 1) of the studied radiomic features were computed from repeat CT images reconstructed at (a) six identical imaging settings or (b) three different imaging settings. There were 89 quantitative features grouped into 15 feature classes. The brighter the red color, the higher the CCC value (i.e., the more reproducibility) of a feature computed for the repeat scans. The label of “1.25L1 vs 1.25L2” means both first and second scans were reconstructed at 1.25mm slice thickness using the lung algorithm. “2.5L vs 2.5S” means both scans were reconstructed at 2.5mm slice thickness but using different algorithms (i.e., lung vs. standard algorithms).

References

    1. Lambin P. et al. Radiomics: extracting more information from medical images using advanced feature analysis. Eur J Cancer 48, 441–446 (2012). - PMC - PubMed
    1. Kumar V. et al. Radiomics: the process and the challenges. Magn Reson Imaging 30, 1234–1248 (2012). - PMC - PubMed
    1. Aerts H. J. et al. Decoding tumour phenotype by noninvasive imaging using a quantitative radiomics approach. Nat Commun 5, 4006 (2014). - PMC - PubMed
    1. Colen R. et al. NCI Workshop Report: Clinical and Computational Requirements for Correlating Imaging Phenotypes with Genomics Signatures. Transl Oncol 7, 556–569 (2014). - PMC - PubMed
    1. Kuo M. D. et al. Radiogenomic analysis to identify imaging phenotypes associated with drug response gene expression programs in hepatocellular carcinoma. J Vasc Interv Radiol 18, 821–831 (2007). - PubMed

Publication types

MeSH terms