Meta-Analysis
. 2016 Mar 24;3(3):CD003316.
doi: 10.1002/14651858.CD003316.pub6.

Physical fitness training for stroke patients

Affiliations
Meta-Analysis

Physical fitness training for stroke patients

David H Saunders et al. Cochrane Database Syst Rev. .

Update in

  • Physical fitness training for stroke patients.
    Saunders DH, Sanderson M, Hayes S, Johnson L, Kramer S, Carter DD, Jarvis H, Brazzelli M, Mead GE. Saunders DH, et al. Cochrane Database Syst Rev. 2020 Mar 20;3(3):CD003316. doi: 10.1002/14651858.CD003316.pub7. Cochrane Database Syst Rev. 2020. PMID: 32196635 Free PMC article.

Abstract

Background: Levels of physical fitness are low after stroke. It is unknown whether improving physical fitness after stroke reduces disability.

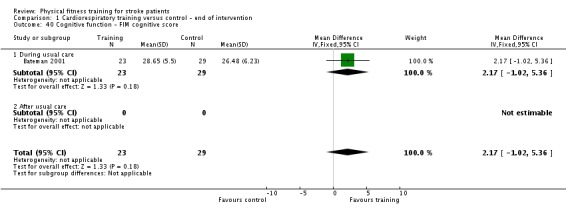
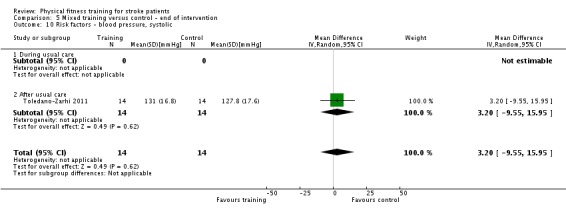
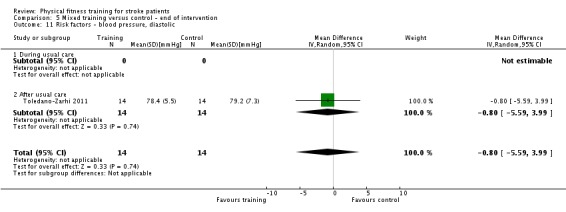
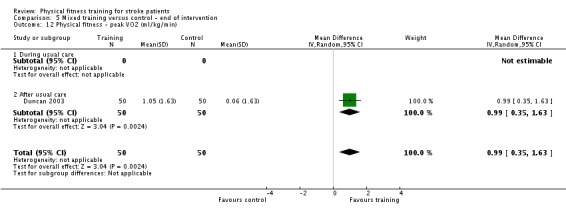
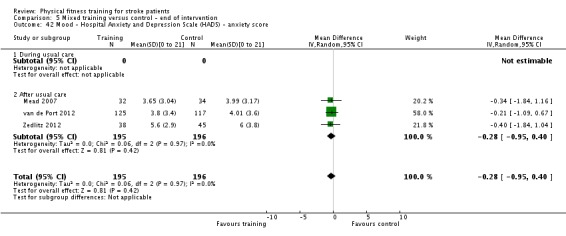
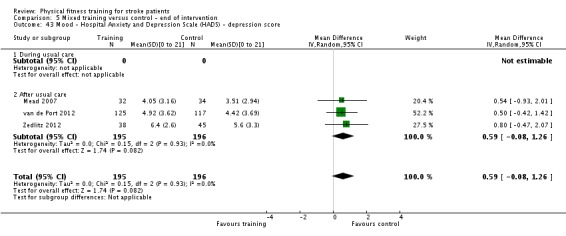
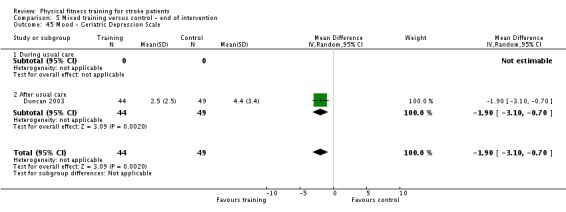
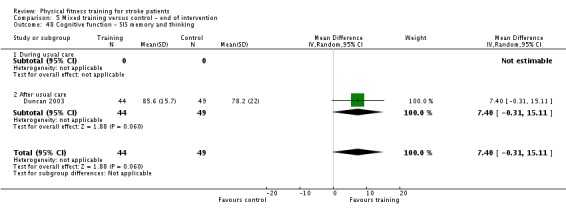
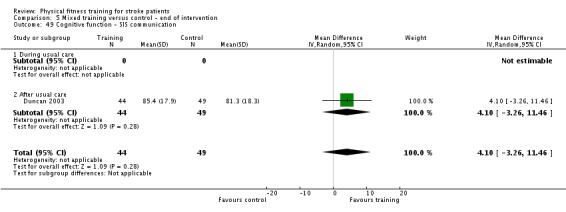
Objectives: To determine whether fitness training after stroke reduces death, dependence, and disability and to assess the effects of training with regard to adverse events, risk factors, physical fitness, mobility, physical function, quality of life, mood, and cognitive function. Interventions to improve cognitive function have attracted increased attention after being identified as the highest rated research priority for life after stroke. Therefore we have added this class of outcomes to this updated review.

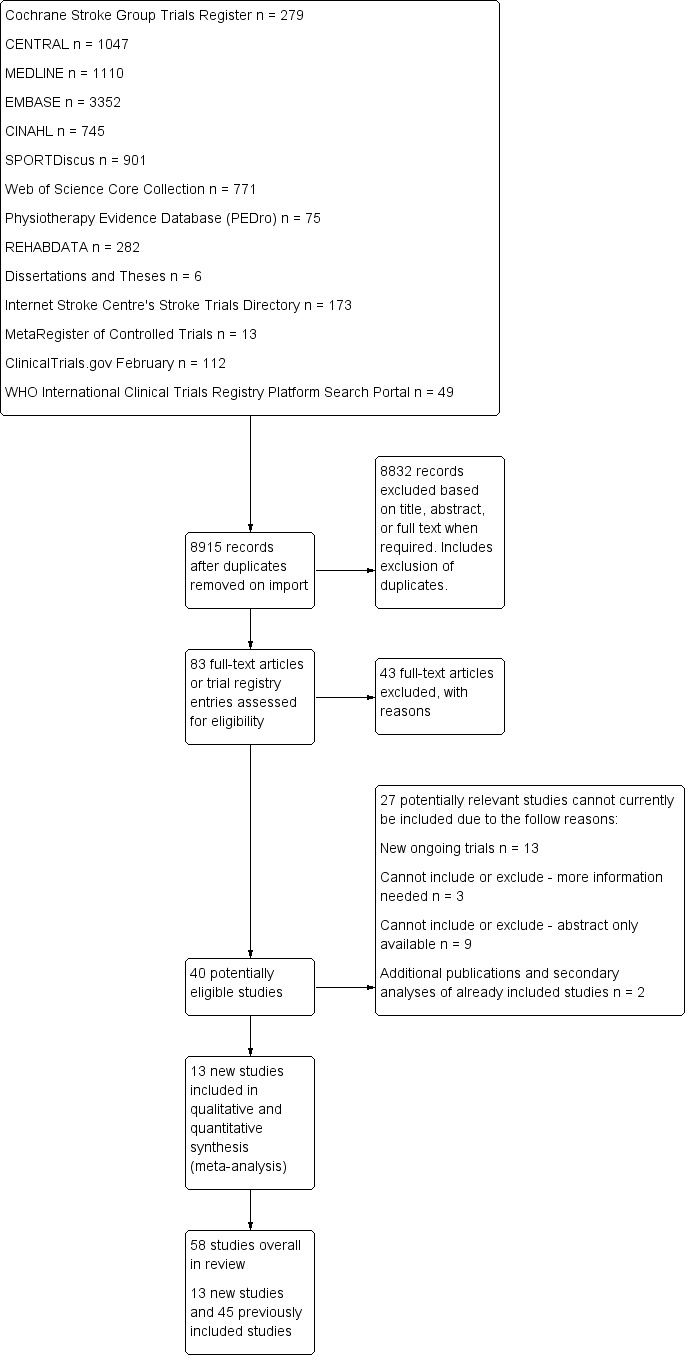
Search methods: We searched the Cochrane Stroke Group Trials Register (last searched February 2015), the Cochrane Central Register of Controlled Trials (CENTRAL 2015, Issue 1: searched February 2015), MEDLINE (1966 to February 2015), EMBASE (1980 to February 2015), CINAHL (1982 to February 2015), SPORTDiscus (1949 to February 2015), and five additional databases (February 2015). We also searched ongoing trials registers, handsearched relevant journals and conference proceedings, screened reference lists, and contacted experts in the field.

Selection criteria: Randomised trials comparing either cardiorespiratory training or resistance training, or both (mixed training), with usual care, no intervention, or a non-exercise intervention in stroke survivors.

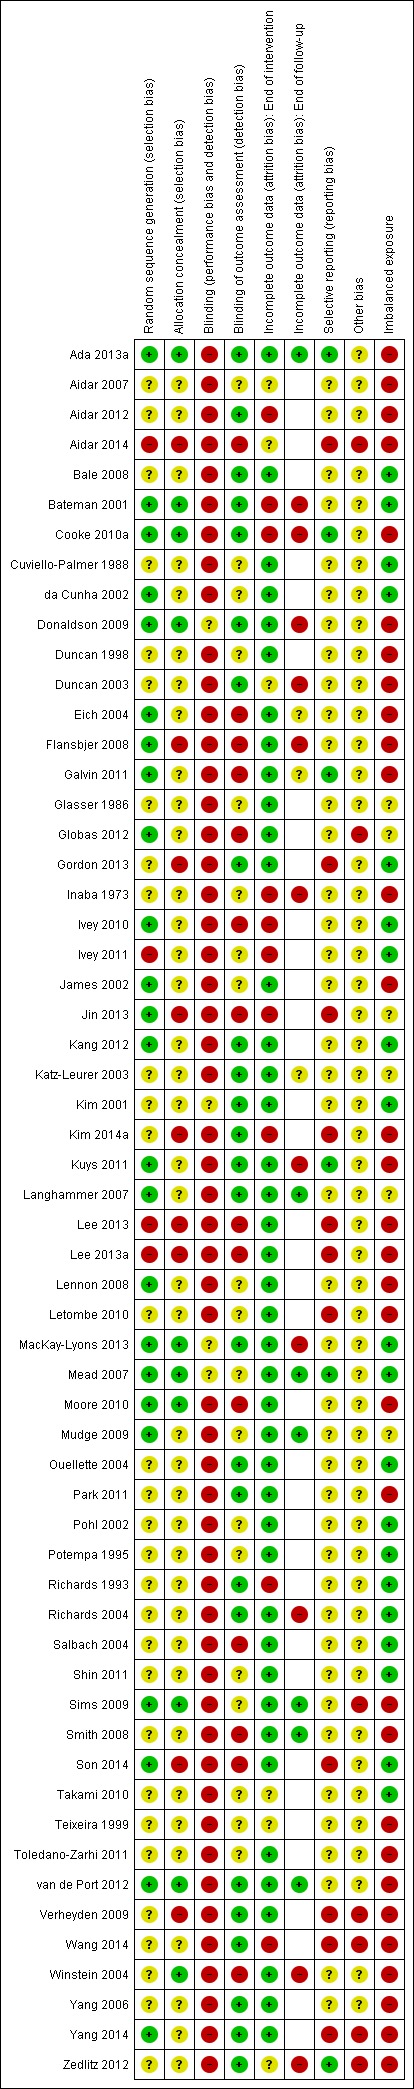
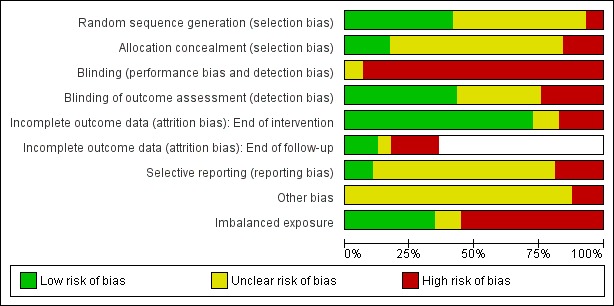
Data collection and analysis: Two review authors independently selected trials, assessed quality and risk of bias, and extracted data. We analysed data using random-effects meta-analyses. Diverse outcome measures limited the intended analyses.

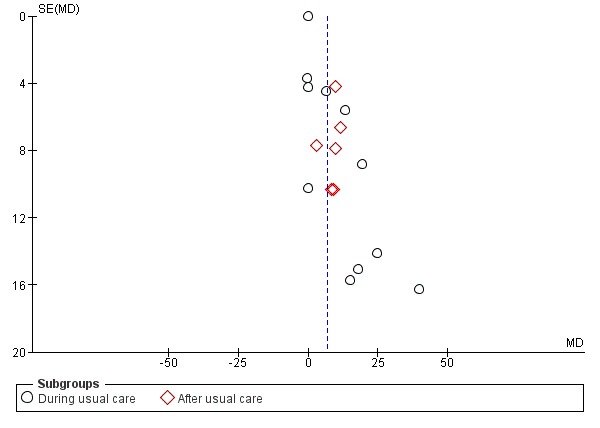
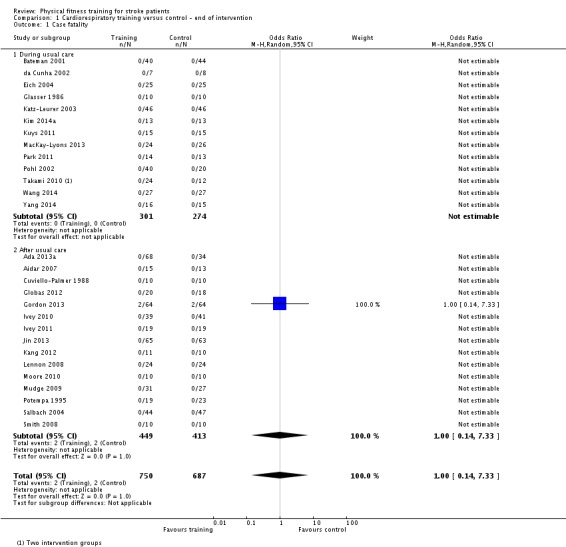
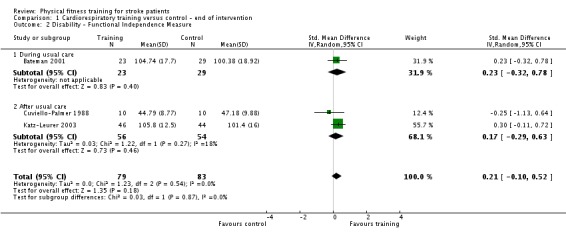
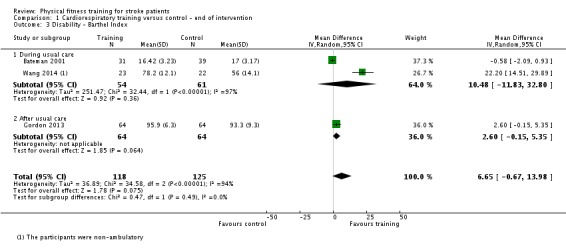
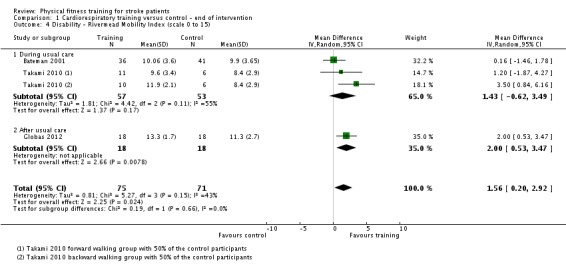
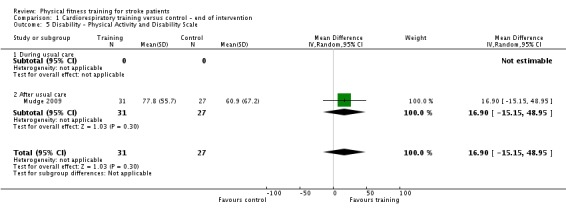
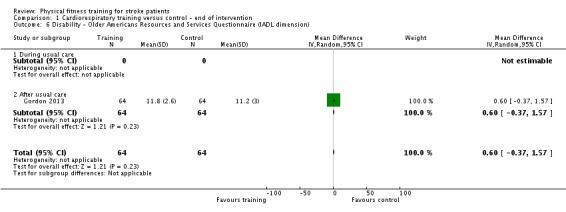
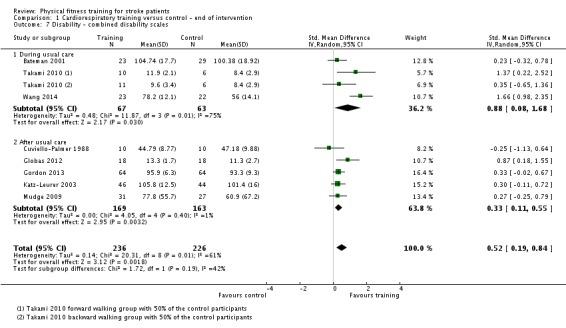
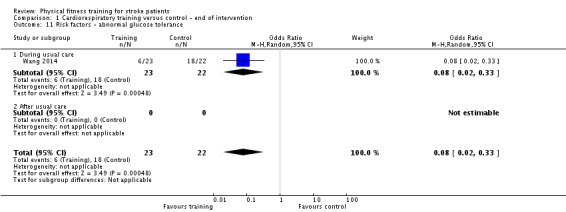
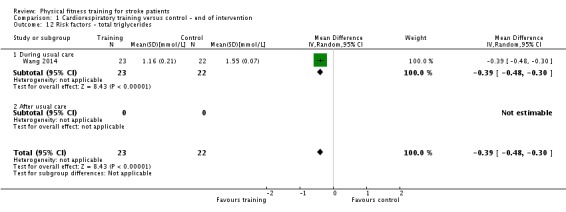
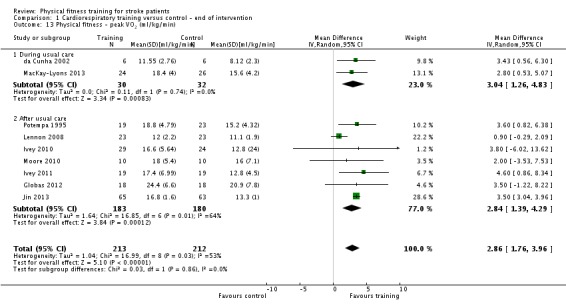
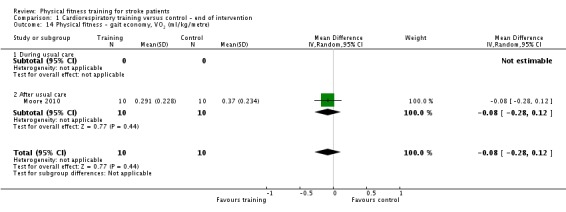
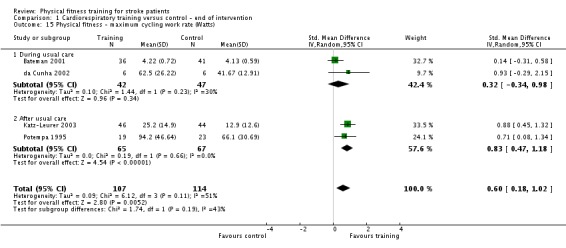
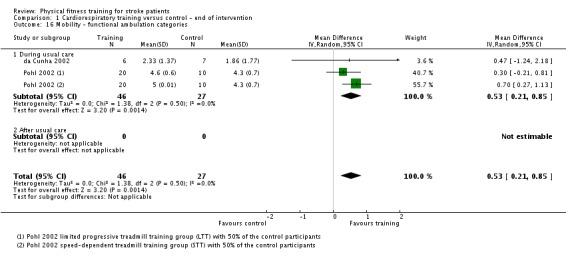
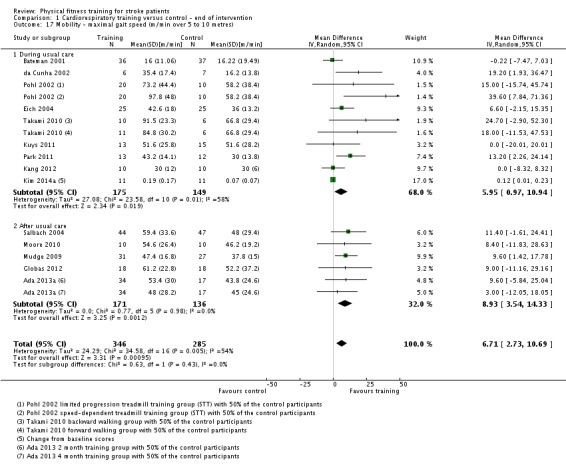
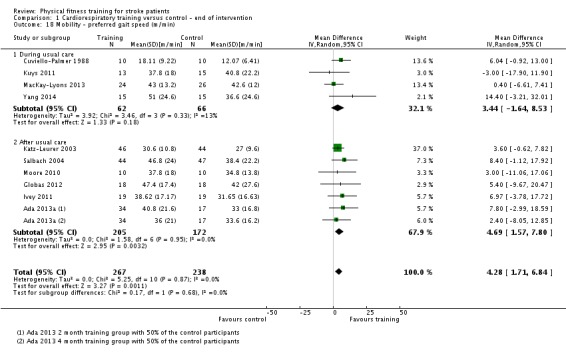
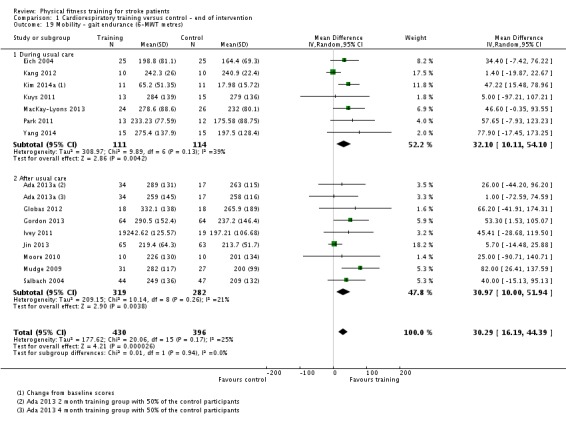
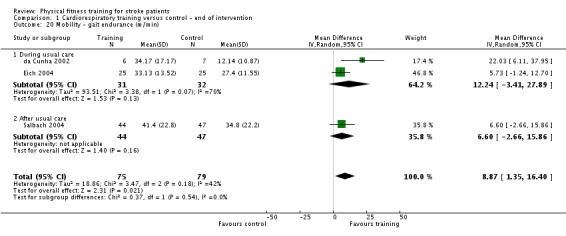
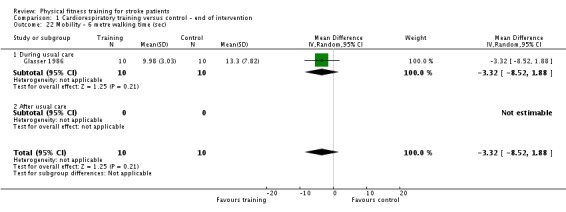
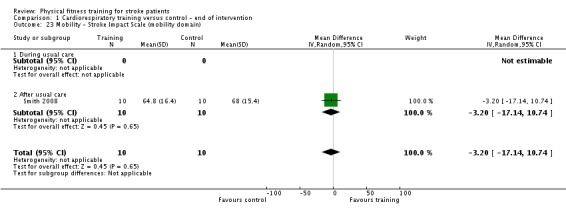
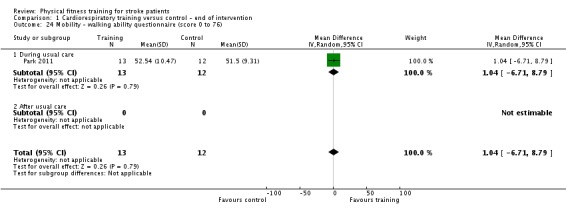
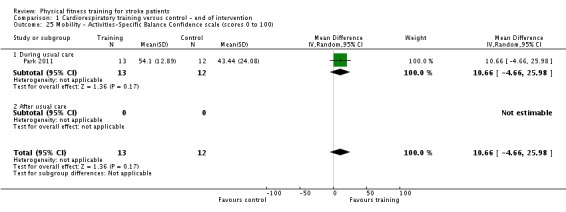
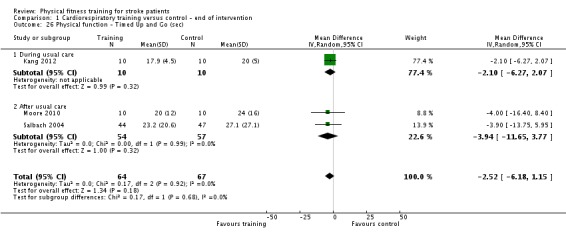
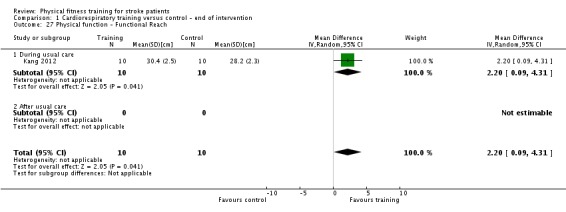
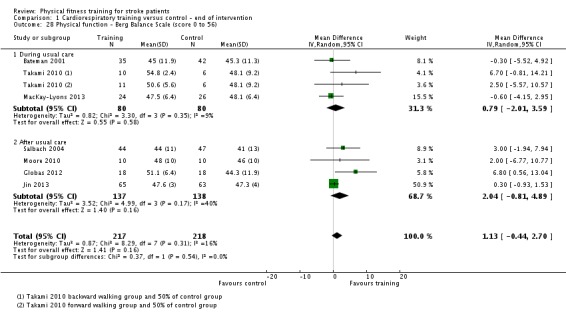
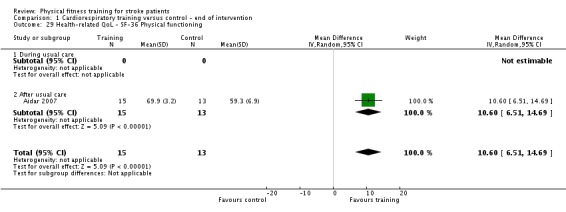
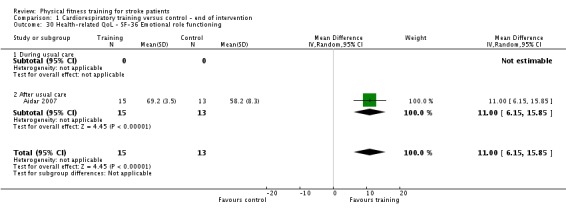
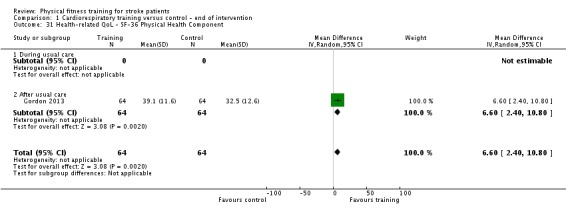
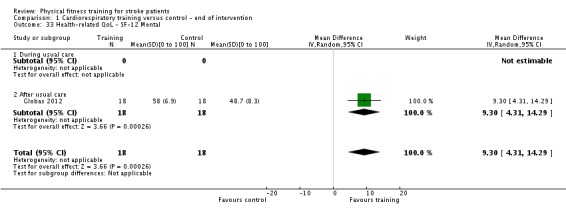
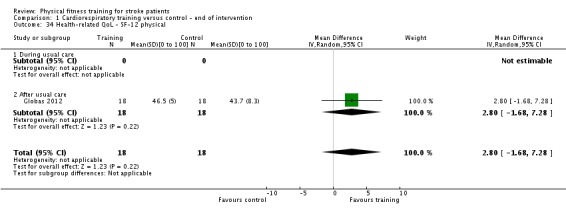
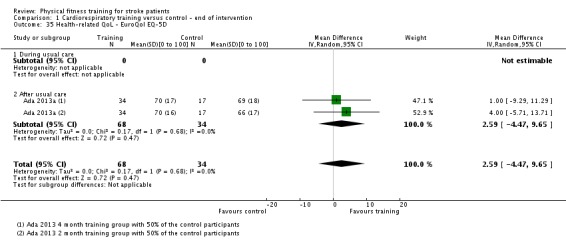
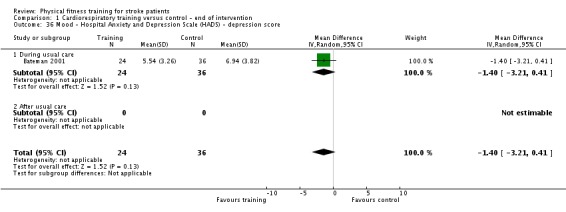
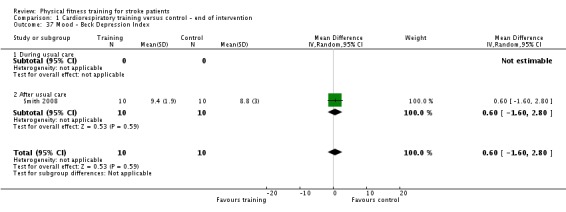
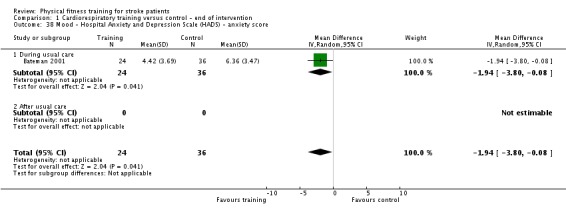
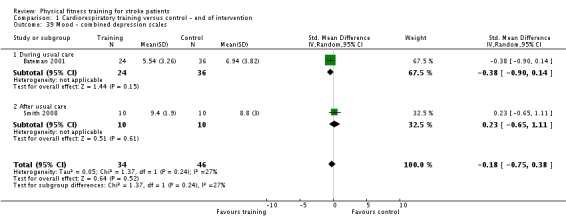
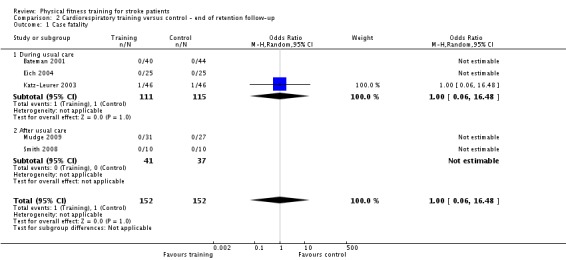
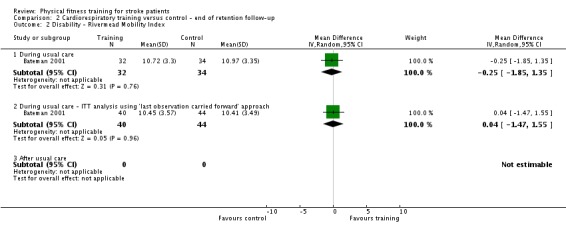
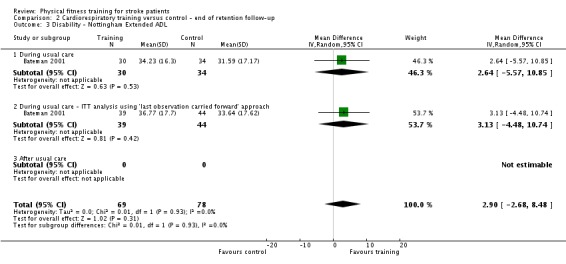
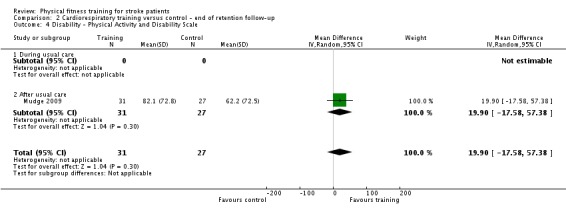
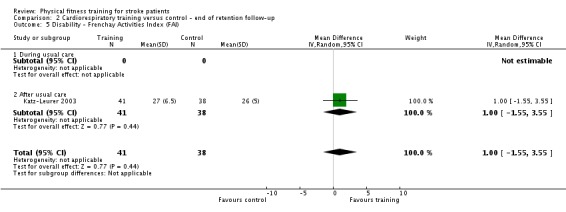
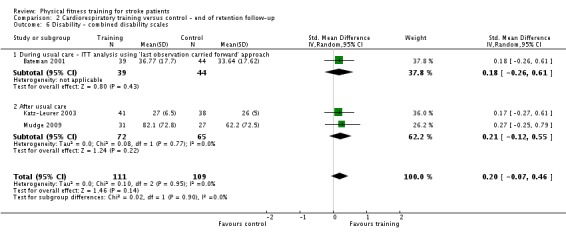
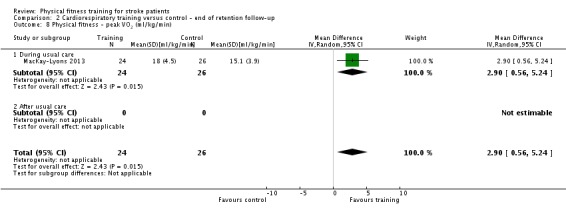
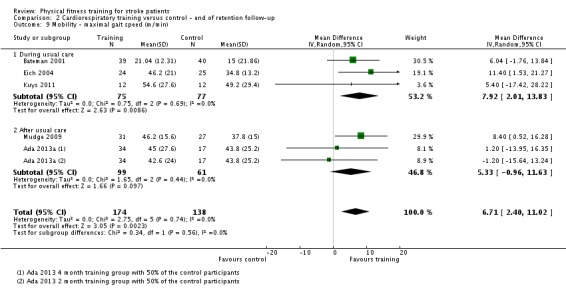
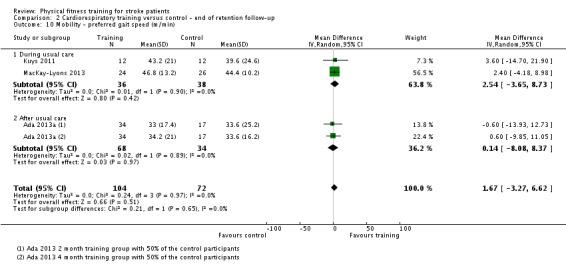
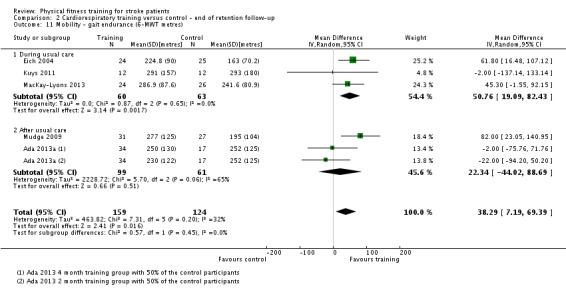
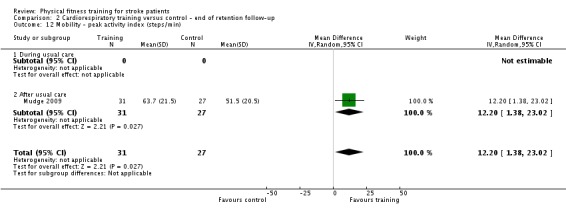
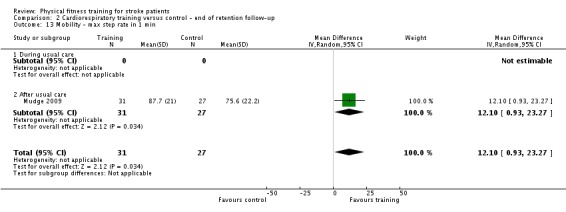
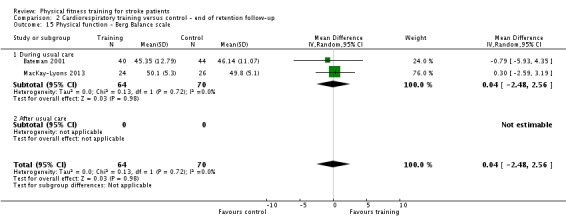
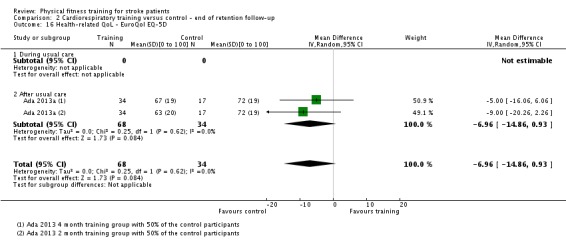
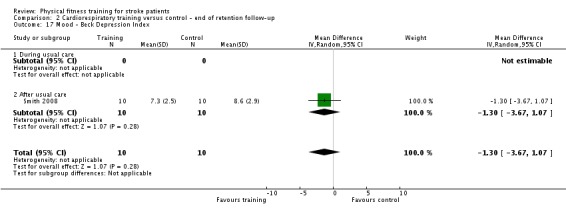
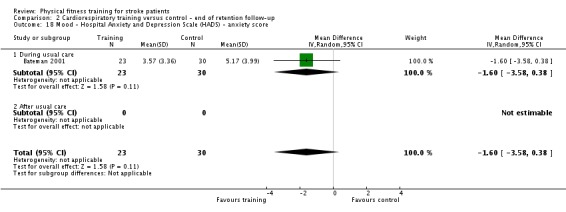
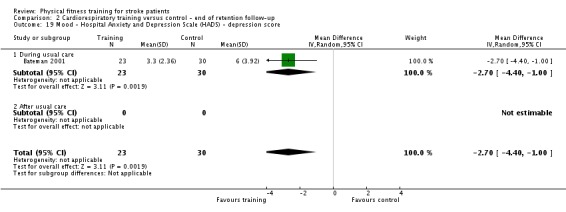
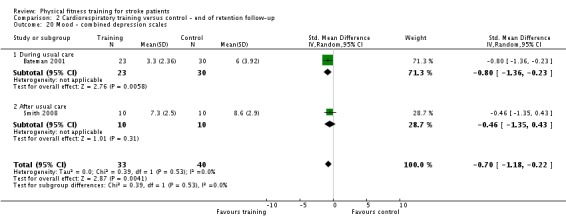
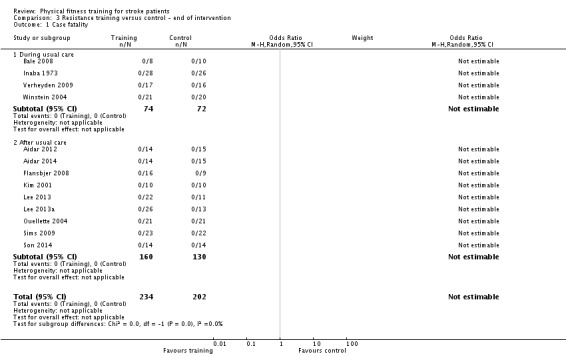
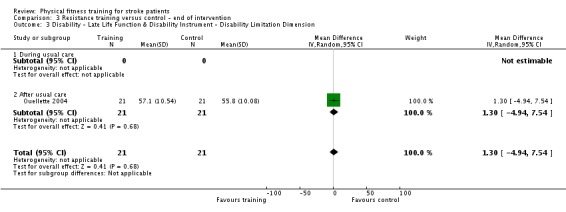
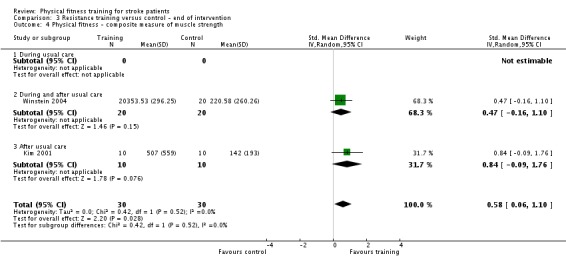
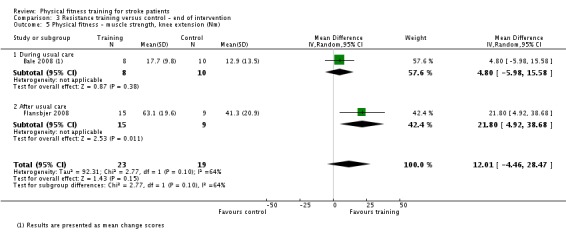
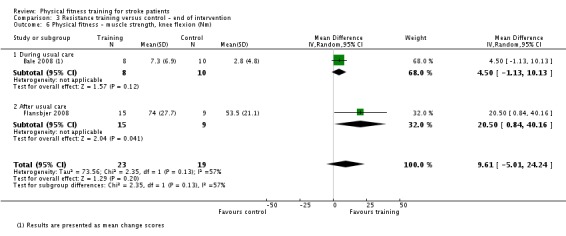
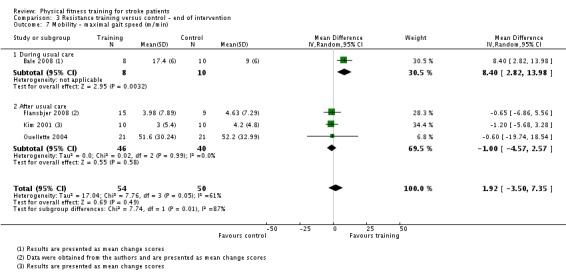
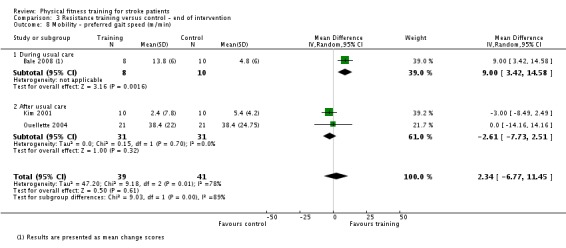
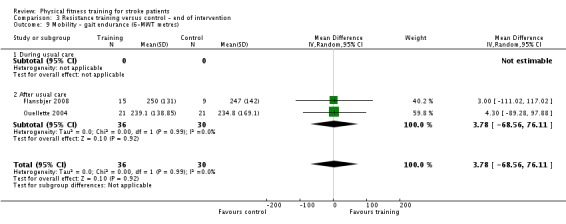
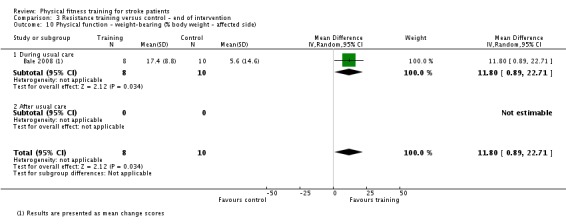
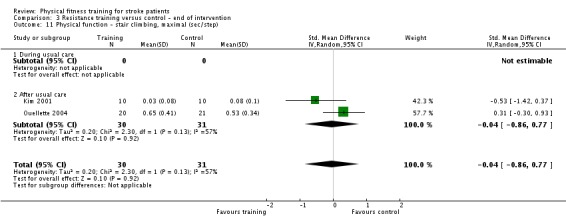
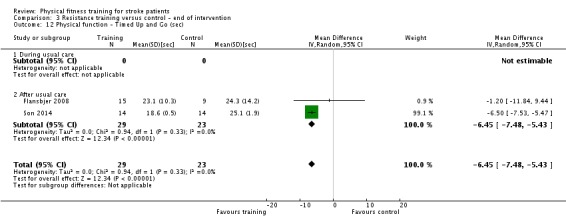
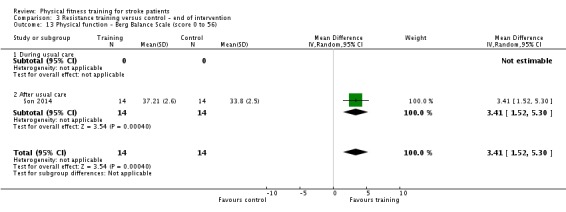
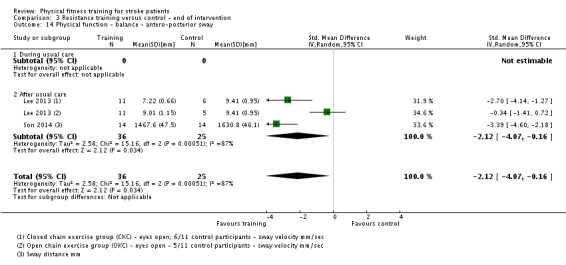
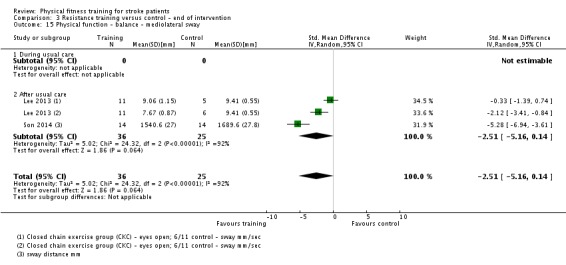
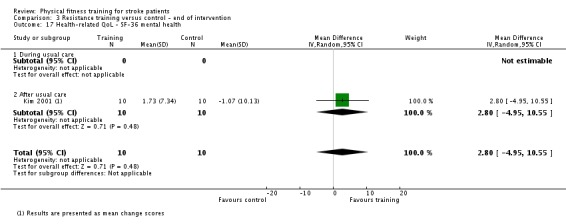
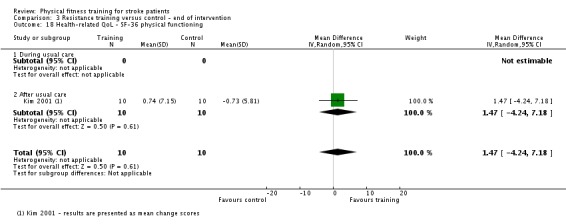
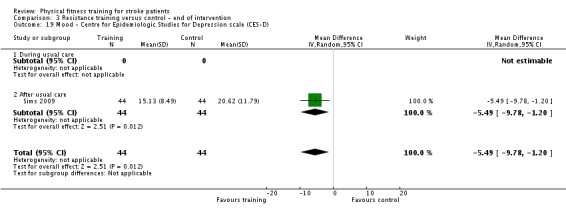
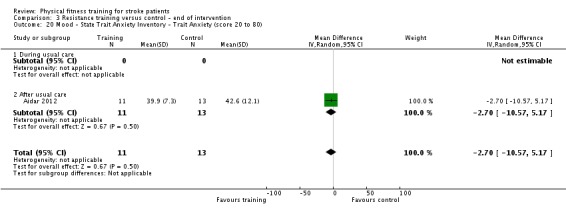
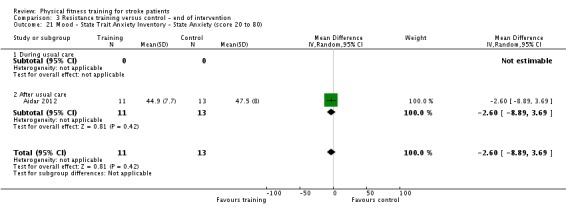
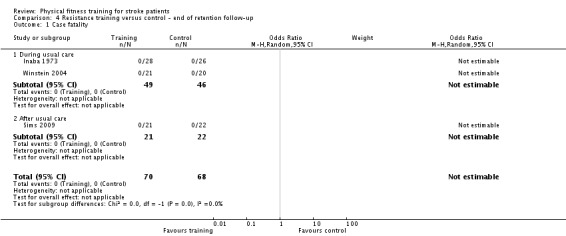
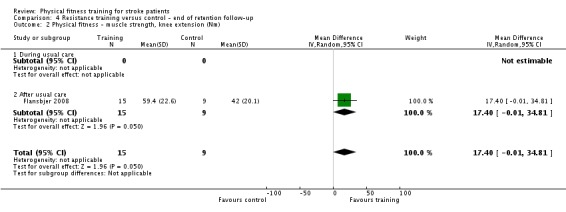
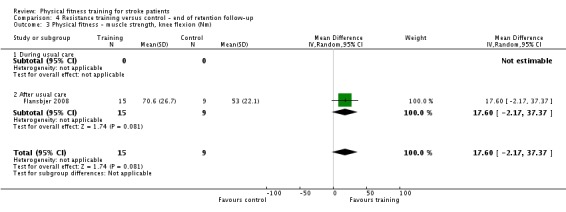
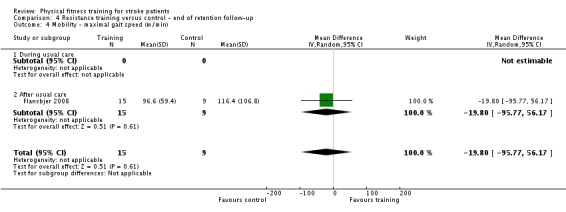
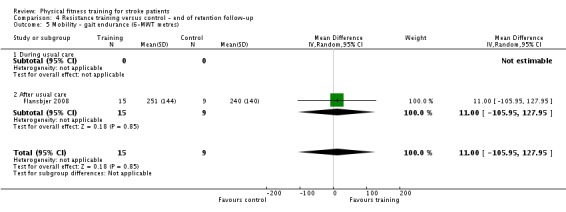
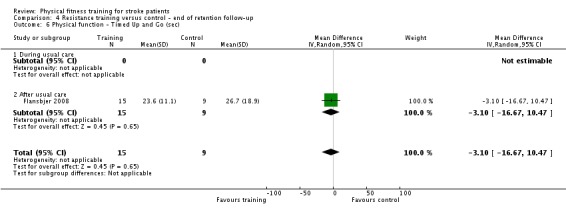
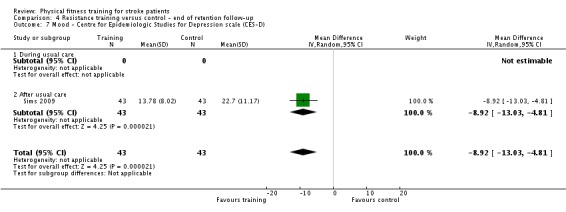
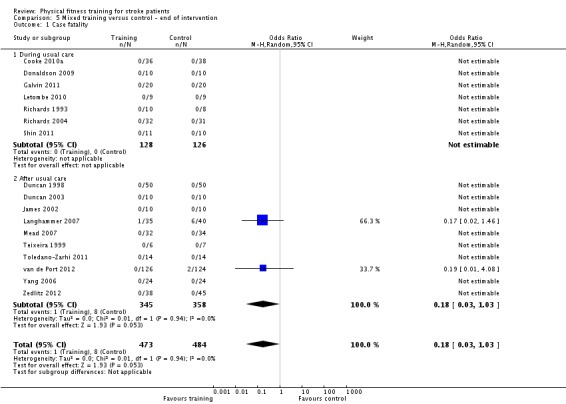
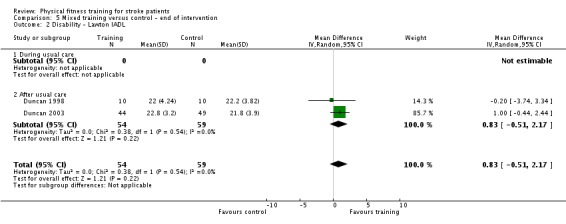
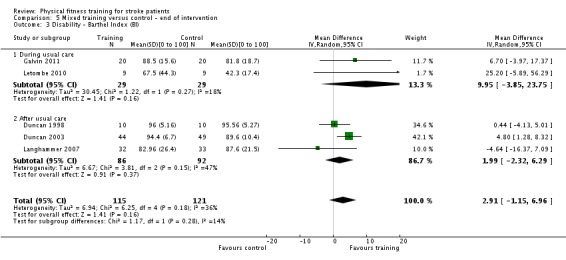
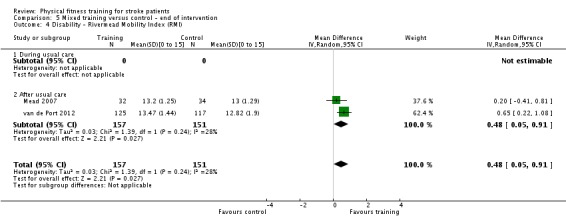
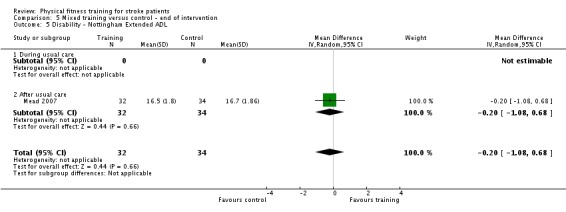
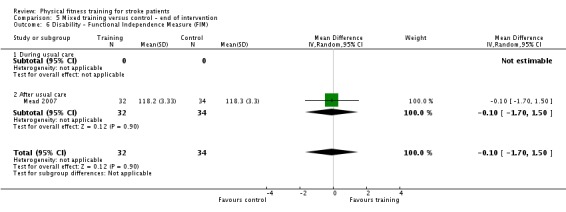
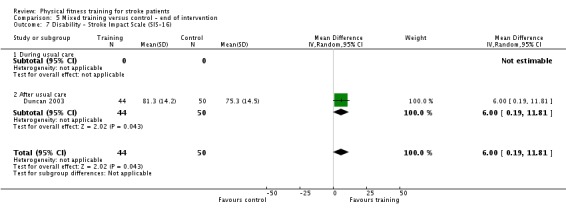
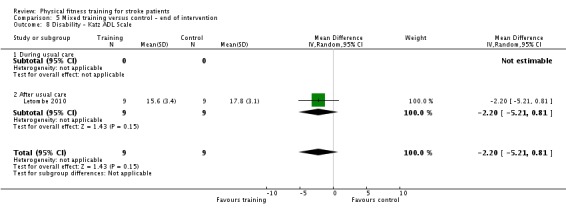
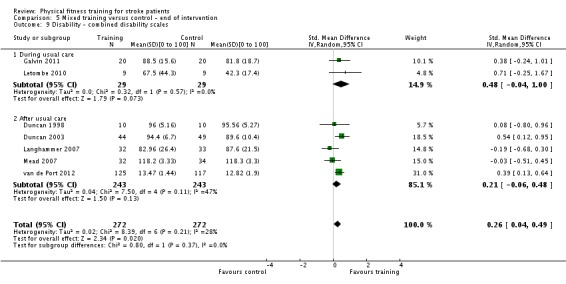
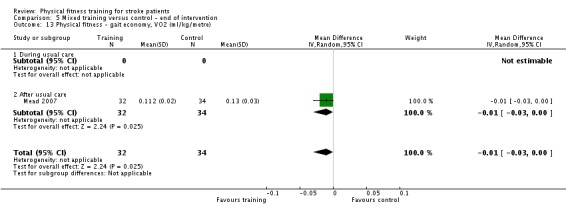
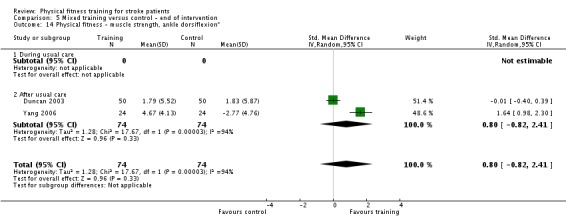
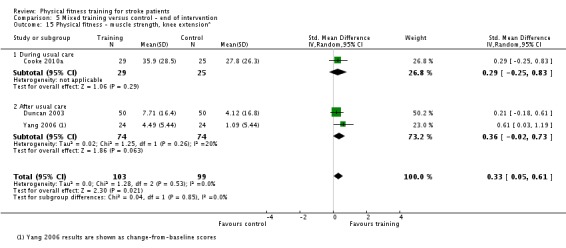
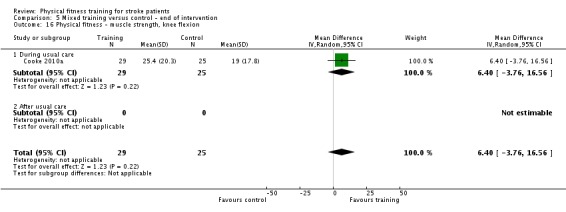
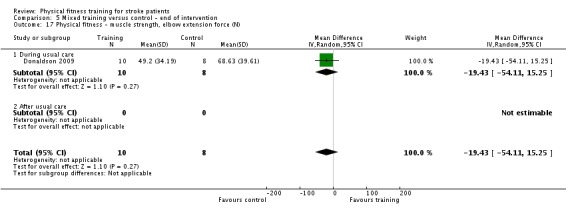
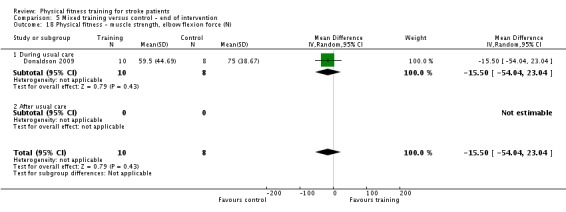
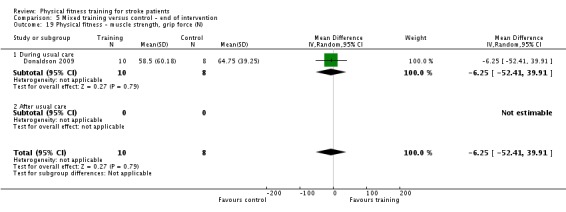
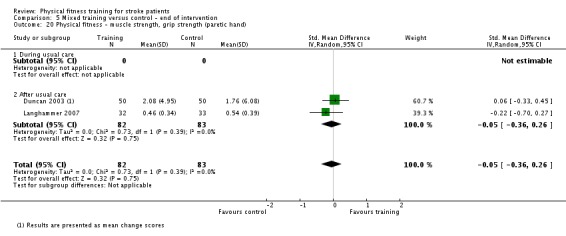
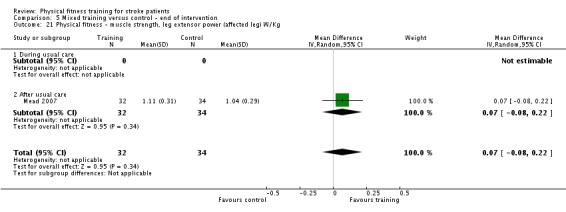
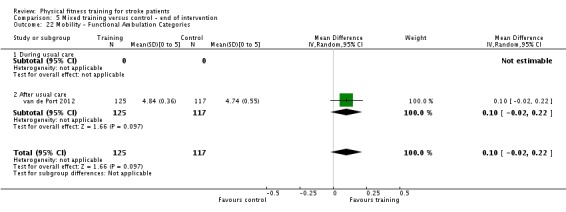
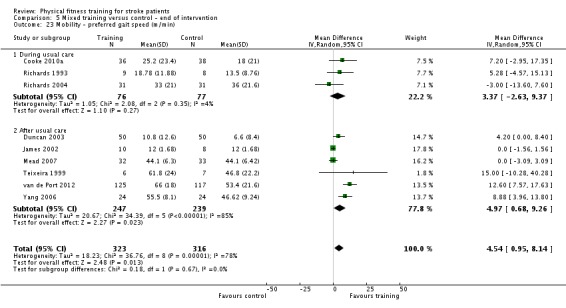
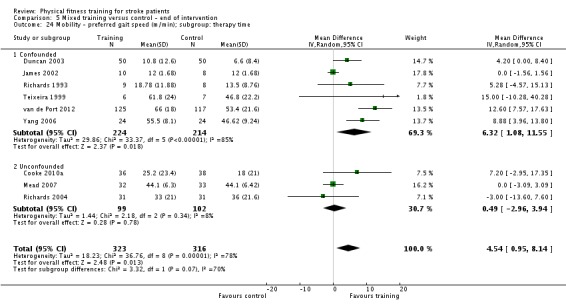
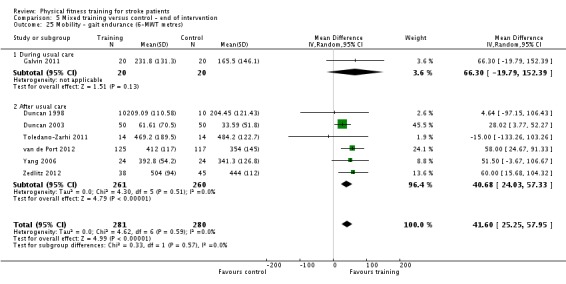
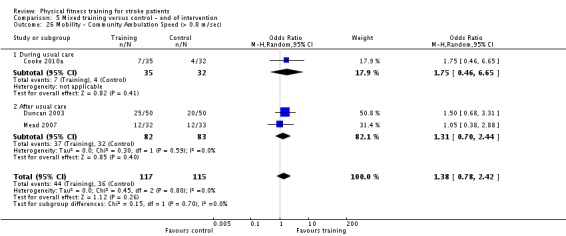
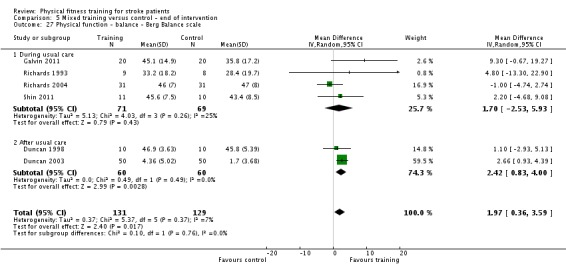
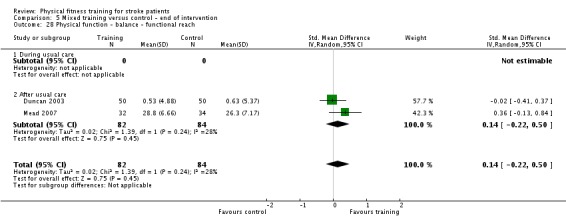
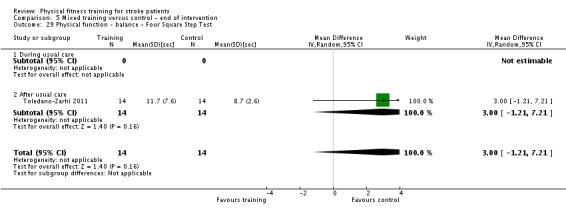
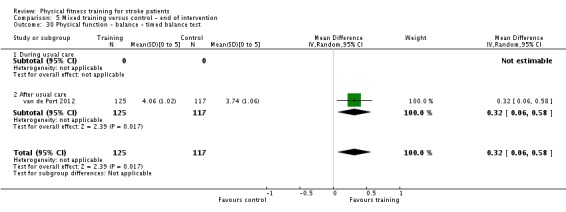
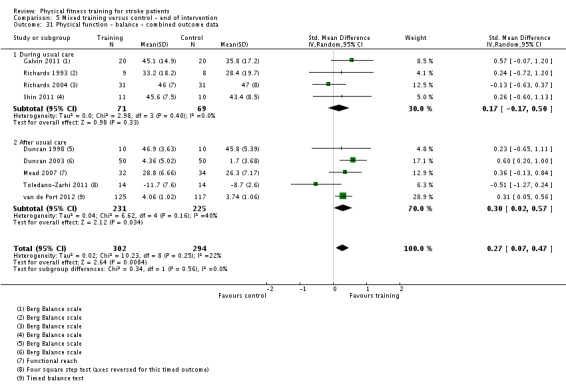
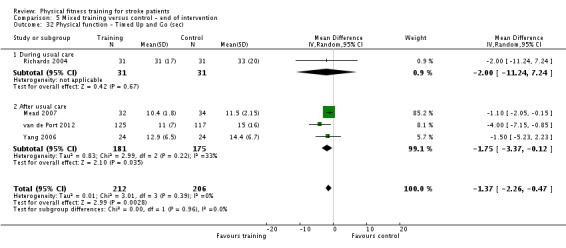
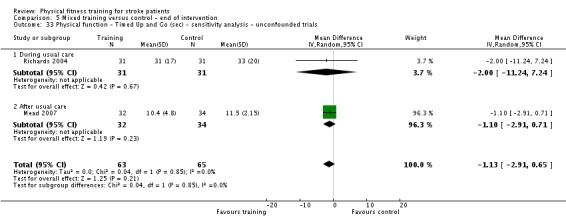
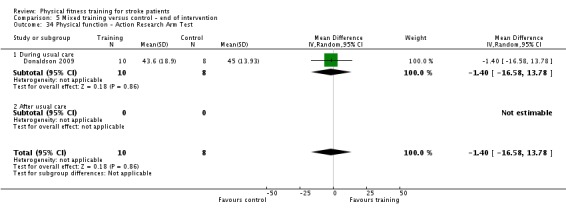
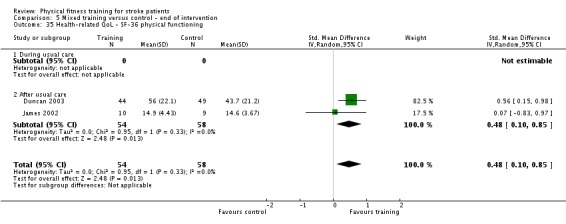
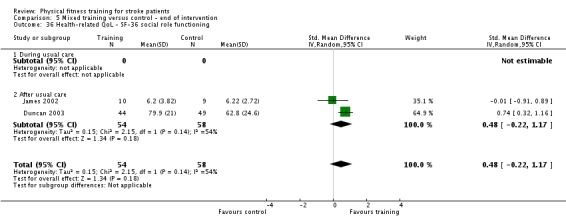
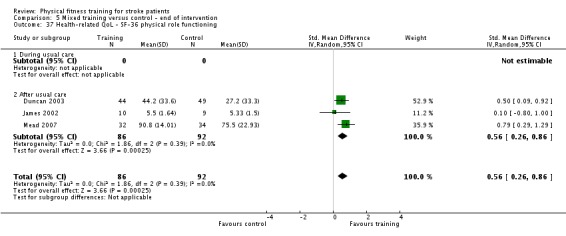
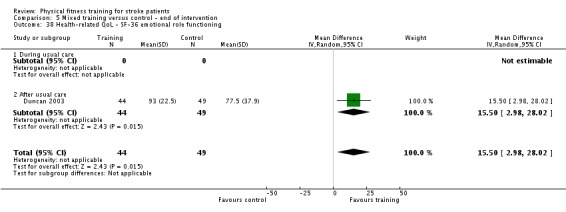
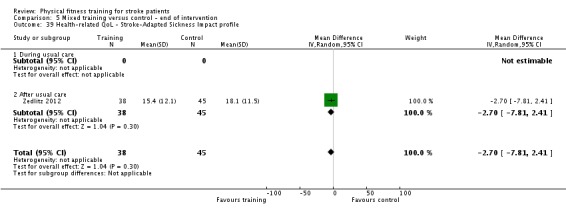
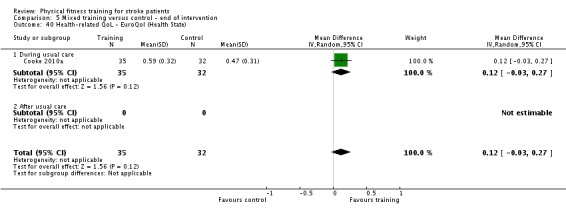
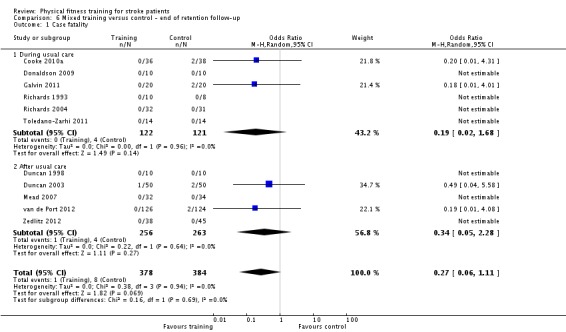
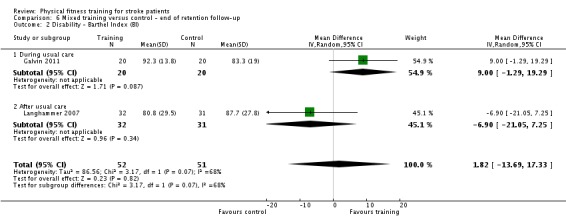
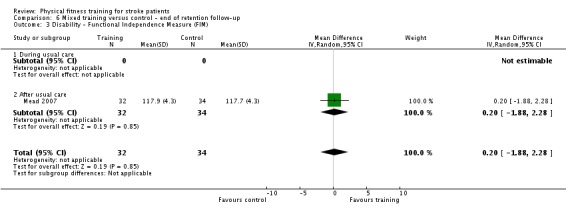
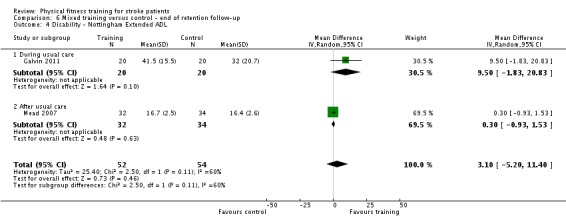
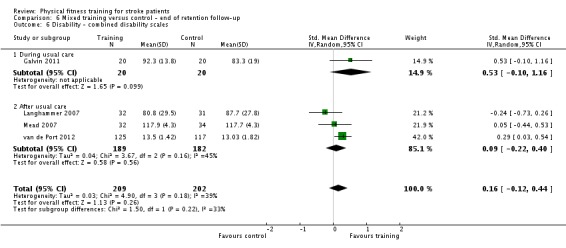
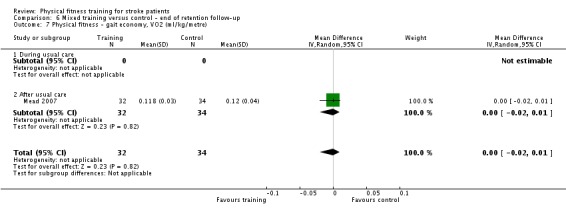
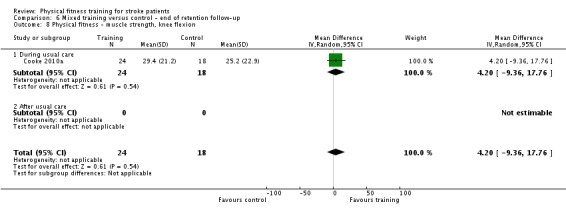
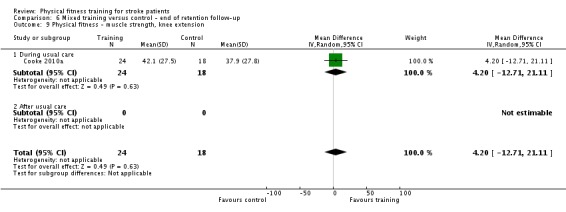
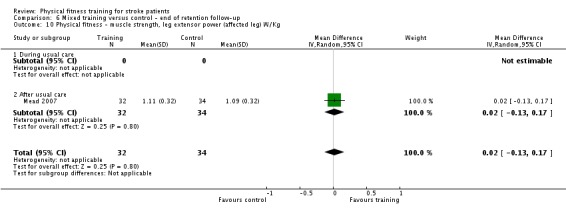
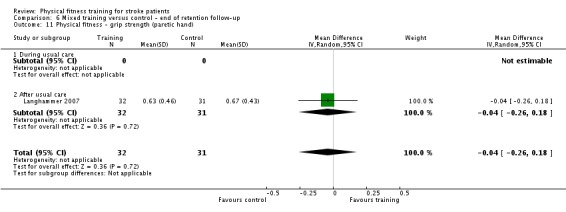
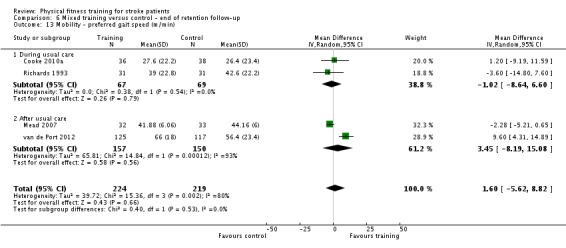
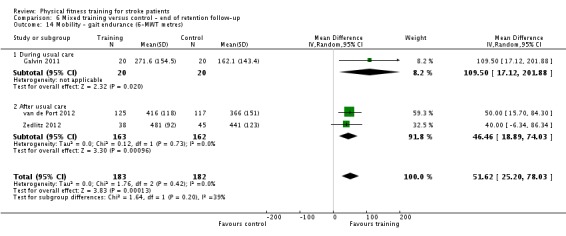
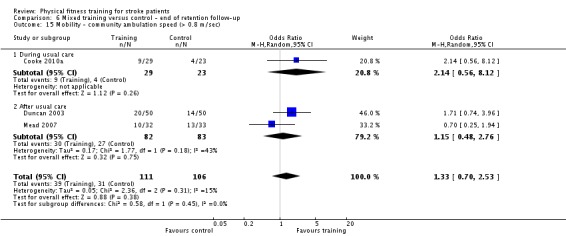
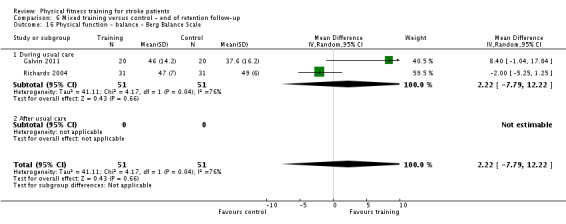
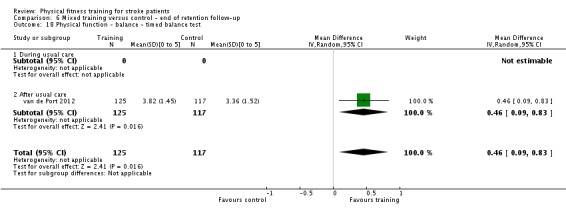
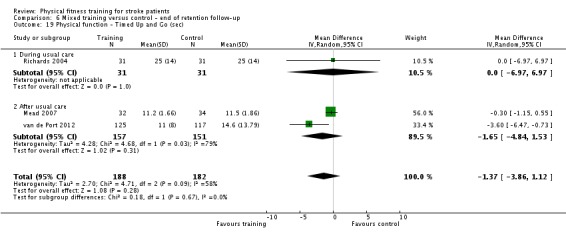
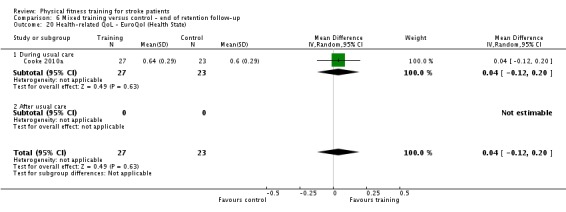
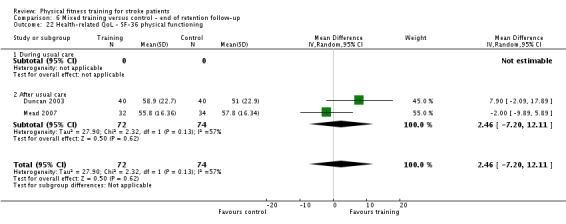
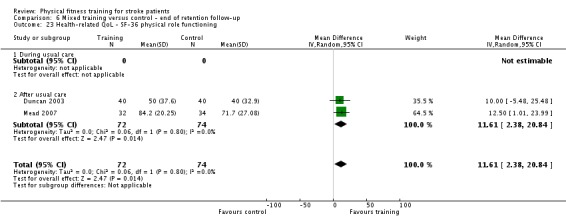
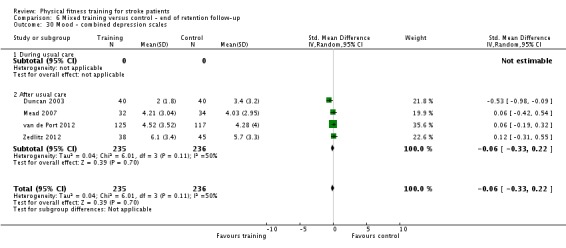
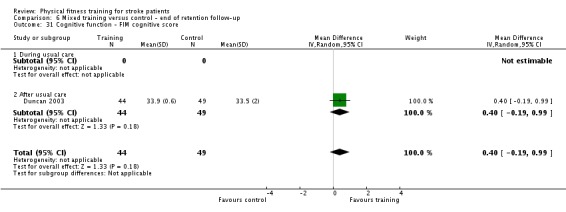
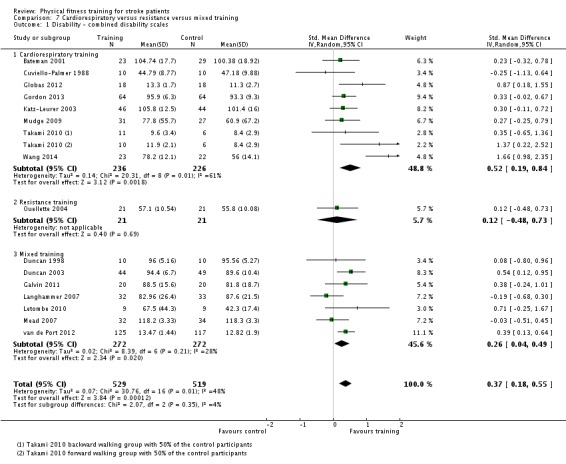
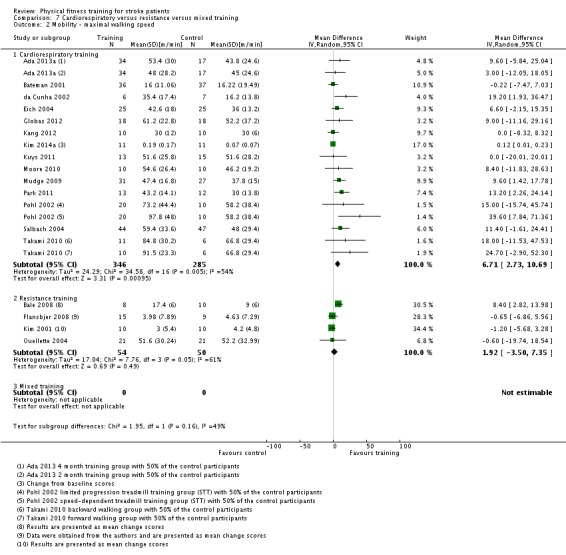
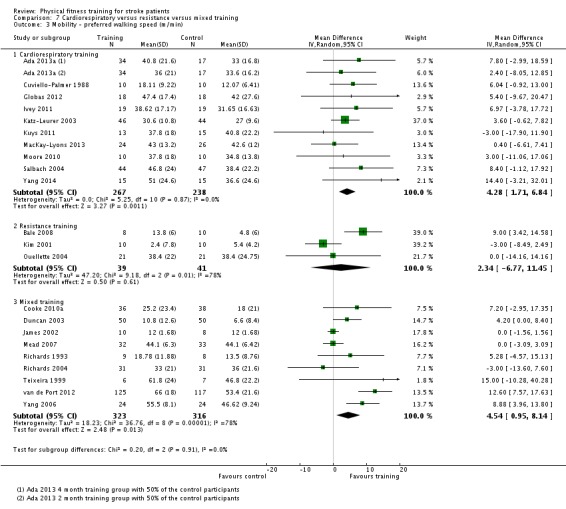
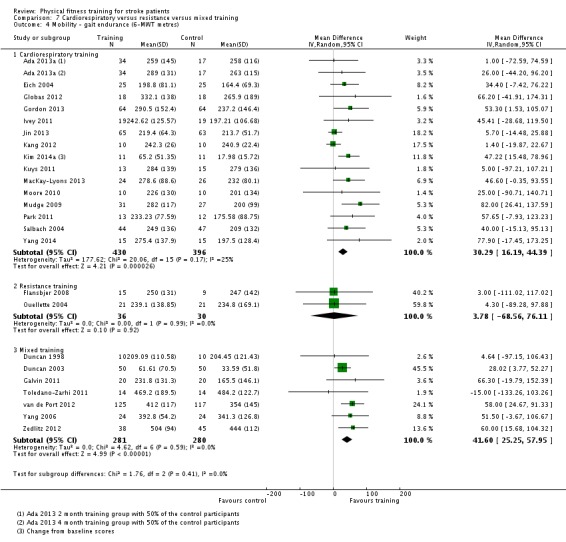
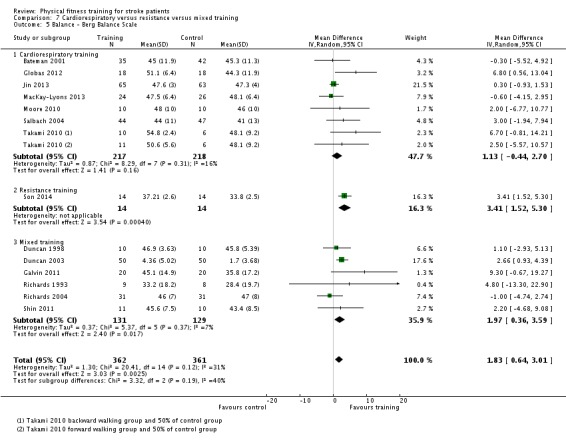
Main results: We included 58 trials, involving 2797 participants, which comprised cardiorespiratory interventions (28 trials, 1408 participants), resistance interventions (13 trials, 432 participants), and mixed training interventions (17 trials, 957 participants). Thirteen deaths occurred before the end of the intervention and a further nine before the end of follow-up. No dependence data were reported. Diverse outcome measures restricted pooling of data. Global indices of disability show moderate improvement after cardiorespiratory training (standardised mean difference (SMD) 0.52, 95% confidence interval (CI) 0.19 to 0.84; P value = 0.002) and by a small amount after mixed training (SMD 0.26, 95% CI 0.04 to 0.49; P value = 0.02); benefits at follow-up (i.e. after training had stopped) were unclear. There were too few data to assess the effects of resistance training.Cardiorespiratory training involving walking improved maximum walking speed (mean difference (MD) 6.71 metres per minute, 95% CI 2.73 to 10.69), preferred gait speed (MD 4.28 metres per minute, 95% CI 1.71 to 6.84), and walking capacity (MD 30.29 metres in six minutes, 95% CI 16.19 to 44.39) at the end of the intervention. Mixed training, involving walking, increased preferred walking speed (MD 4.54 metres per minute, 95% CI 0.95 to 8.14), and walking capacity (MD 41.60 metres per six minutes, 95% CI 25.25 to 57.95). Balance scores improved slightly after mixed training (SMD 0.27, 95% CI 0.07 to 0.47). Some mobility benefits also persisted at the end of follow-up. The variability, quality of the included trials, and lack of data prevents conclusions about other outcomes and limits generalisability of the observed results.

Authors' conclusions: Cardiorespiratory training and, to a lesser extent, mixed training reduce disability during or after usual stroke care; this could be mediated by improved mobility and balance. There is sufficient evidence to incorporate cardiorespiratory and mixed training, involving walking, within post-stroke rehabilitation programmes to improve the speed and tolerance of walking; some improvement in balance could also occur. There is insufficient evidence to support the use of resistance training. The effects of training on death and dependence after stroke are still unclear but these outcomes are rarely observed in physical fitness training trials. Cognitive function is under-investigated despite being a key outcome of interest for patients. Further well-designed randomised trials are needed to determine the optimal exercise prescription and identify long-term benefits.


Conflict of interest statement

DH Saunders and CA Greig were co‐authors of one included study (Mead 2007). GE Mead has received research funding for exercise after stroke. She has received honoraria from Later Life Training to develop an educational course of exercise after stroke for exercise professionals. She has also received honoraria and expenses to present work on exercise after stroke at conferences. She has led a trial of exercise after stroke that is included in the review (Mead 2007). S Hayes has no declarations of interest. M Brazzelli has no declarations of interest.

Figures

Figure 1
Figure 1
Study flow diagram for the current update of this review.
Figure 2
Figure 2
'Risk of bias' summary: review authors' judgements about each risk of bias item for each included study. In studies with no follow‐up measurement the risk of bias was not performed for the item labelled 'Incomplete outcome data (attrition bias): end of follow‐up'; this results in some blank spaces.
Figure 3
Figure 3
'Risk of bias' graph: review authors' judgements about each risk of bias item presented as percentages across all included studies. In studies with no follow‐up measurement the risk of bias was not performed for the item labelled 'Incomplete outcome data (attrition bias): end of follow‐up'; this results in some blank spaces.
Figure 4
Figure 4
Funnel plot of comparison: 1 Cardiorespiratory training versus control ‐ end of intervention, outcome: 1.17 Mobility ‐ maximal gait speed (m/min over 5 to 10 metres) [m/min].
Figure 5
Figure 5
Funnel plot of comparison: 1 Cardiorespiratory training versus control ‐ end of intervention, outcome: 1.19 Mobility ‐ gait endurance (6‐MWT metres).
Figure 6
Figure 6
Funnel plot of comparison: 5 Mixed training versus control ‐ end of intervention, outcome: 5.23 Mobility ‐ preferred gait speed (m/min).
Analysis 1.1
Analysis 1.1
Comparison 1 Cardiorespiratory training versus control ‐ end of intervention, Outcome 1 Case fatality.
Analysis 1.2
Analysis 1.2
Comparison 1 Cardiorespiratory training versus control ‐ end of intervention, Outcome 2 Disability ‐ Functional Independence Measure.
Analysis 1.3
Analysis 1.3
Comparison 1 Cardiorespiratory training versus control ‐ end of intervention, Outcome 3 Disability ‐ Barthel Index.
Analysis 1.4
Analysis 1.4
Comparison 1 Cardiorespiratory training versus control ‐ end of intervention, Outcome 4 Disability ‐ Rivermead Mobility Index (scale 0 to 15).
Analysis 1.5
Analysis 1.5
Comparison 1 Cardiorespiratory training versus control ‐ end of intervention, Outcome 5 Disability ‐ Physical Activity and Disability Scale.
Analysis 1.6
Analysis 1.6
Comparison 1 Cardiorespiratory training versus control ‐ end of intervention, Outcome 6 Disability ‐ Older Americans Resources and Services Questionnaire (IADL dimension).
Analysis 1.7
Analysis 1.7
Comparison 1 Cardiorespiratory training versus control ‐ end of intervention, Outcome 7 Disability ‐ combined disability scales.
Analysis 1.8
Analysis 1.8
Comparison 1 Cardiorespiratory training versus control ‐ end of intervention, Outcome 8 Risk factors ‐ blood pressure, systolic.
Analysis 1.9
Analysis 1.9
Comparison 1 Cardiorespiratory training versus control ‐ end of intervention, Outcome 9 Risk factors ‐ blood pressure, diastolic.
Analysis 1.10
Analysis 1.10
Comparison 1 Cardiorespiratory training versus control ‐ end of intervention, Outcome 10 Risk factors ‐ body mass index (BMI).
Analysis 1.11
Analysis 1.11
Comparison 1 Cardiorespiratory training versus control ‐ end of intervention, Outcome 11 Risk factors ‐ abnormal glucose tolerance.
Analysis 1.12
Analysis 1.12
Comparison 1 Cardiorespiratory training versus control ‐ end of intervention, Outcome 12 Risk factors ‐ total triglycerides.
Analysis 1.13
Analysis 1.13
Comparison 1 Cardiorespiratory training versus control ‐ end of intervention, Outcome 13 Physical fitness ‐ peak VO2 (ml/kg/min).
Analysis 1.14
Analysis 1.14
Comparison 1 Cardiorespiratory training versus control ‐ end of intervention, Outcome 14 Physical fitness ‐ gait economy, VO2 (ml/kg/metre).
Analysis 1.15
Analysis 1.15
Comparison 1 Cardiorespiratory training versus control ‐ end of intervention, Outcome 15 Physical fitness ‐ maximum cycling work rate (Watts).
Analysis 1.16
Analysis 1.16
Comparison 1 Cardiorespiratory training versus control ‐ end of intervention, Outcome 16 Mobility ‐ functional ambulation categories.
Analysis 1.17
Analysis 1.17
Comparison 1 Cardiorespiratory training versus control ‐ end of intervention, Outcome 17 Mobility ‐ maximal gait speed (m/min over 5 to 10 metres).
Analysis 1.18
Analysis 1.18
Comparison 1 Cardiorespiratory training versus control ‐ end of intervention, Outcome 18 Mobility ‐ preferred gait speed (m/min).
Analysis 1.19
Analysis 1.19
Comparison 1 Cardiorespiratory training versus control ‐ end of intervention, Outcome 19 Mobility ‐ gait endurance (6‐MWT metres).
Analysis 1.20
Analysis 1.20
Comparison 1 Cardiorespiratory training versus control ‐ end of intervention, Outcome 20 Mobility ‐ gait endurance (m/min).
Analysis 1.21
Analysis 1.21
Comparison 1 Cardiorespiratory training versus control ‐ end of intervention, Outcome 21 Mobility ‐ community walk test (min).
Analysis 1.22
Analysis 1.22
Comparison 1 Cardiorespiratory training versus control ‐ end of intervention, Outcome 22 Mobility ‐ 6 metre walking time (sec).
Analysis 1.23
Analysis 1.23
Comparison 1 Cardiorespiratory training versus control ‐ end of intervention, Outcome 23 Mobility ‐ Stroke Impact Scale (mobility domain).
Analysis 1.24
Analysis 1.24
Comparison 1 Cardiorespiratory training versus control ‐ end of intervention, Outcome 24 Mobility ‐ walking ability questionnaire (score 0 to 76).
Analysis 1.25
Analysis 1.25
Comparison 1 Cardiorespiratory training versus control ‐ end of intervention, Outcome 25 Mobility ‐ Activities‐Specific Balance Confidence scale (scores 0 to 100).
Analysis 1.26
Analysis 1.26
Comparison 1 Cardiorespiratory training versus control ‐ end of intervention, Outcome 26 Physical function ‐ Timed Up and Go (sec).
Analysis 1.27
Analysis 1.27
Comparison 1 Cardiorespiratory training versus control ‐ end of intervention, Outcome 27 Physical function ‐ Functional Reach.
Analysis 1.28
Analysis 1.28
Comparison 1 Cardiorespiratory training versus control ‐ end of intervention, Outcome 28 Physical function ‐ Berg Balance Scale (score 0 to 56).
Analysis 1.29
Analysis 1.29
Comparison 1 Cardiorespiratory training versus control ‐ end of intervention, Outcome 29 Health‐related QoL ‐ SF‐36 Physical functioning.
Analysis 1.30
Analysis 1.30
Comparison 1 Cardiorespiratory training versus control ‐ end of intervention, Outcome 30 Health‐related QoL ‐ SF‐36 Emotional role functioning.
Analysis 1.31
Analysis 1.31
Comparison 1 Cardiorespiratory training versus control ‐ end of intervention, Outcome 31 Health‐related QoL ‐ SF‐36 Physical Health Component.
Analysis 1.32
Analysis 1.32
Comparison 1 Cardiorespiratory training versus control ‐ end of intervention, Outcome 32 Health‐related QoL ‐ SF‐36 Mental Health Component.
Analysis 1.33
Analysis 1.33
Comparison 1 Cardiorespiratory training versus control ‐ end of intervention, Outcome 33 Health‐related QoL ‐ SF‐12 Mental.
Analysis 1.34
Analysis 1.34
Comparison 1 Cardiorespiratory training versus control ‐ end of intervention, Outcome 34 Health‐related QoL ‐ SF‐12 physical.
Analysis 1.35
Analysis 1.35
Comparison 1 Cardiorespiratory training versus control ‐ end of intervention, Outcome 35 Health‐related QoL ‐ EuroQol EQ‐5D.
Analysis 1.36
Analysis 1.36
Comparison 1 Cardiorespiratory training versus control ‐ end of intervention, Outcome 36 Mood ‐ Hospital Anxiety and Depression Scale (HADS) ‐ depression score.
Analysis 1.37
Analysis 1.37
Comparison 1 Cardiorespiratory training versus control ‐ end of intervention, Outcome 37 Mood ‐ Beck Depression Index.
Analysis 1.38
Analysis 1.38
Comparison 1 Cardiorespiratory training versus control ‐ end of intervention, Outcome 38 Mood ‐ Hospital Anxiety and Depression Scale (HADS) ‐ anxiety score.
Analysis 1.39
Analysis 1.39
Comparison 1 Cardiorespiratory training versus control ‐ end of intervention, Outcome 39 Mood ‐ combined depression scales.
Analysis 1.40
Analysis 1.40
Comparison 1 Cardiorespiratory training versus control ‐ end of intervention, Outcome 40 Cognitive function ‐ FIM cognitive score.
Analysis 2.1
Analysis 2.1
Comparison 2 Cardiorespiratory training versus control ‐ end of retention follow‐up, Outcome 1 Case fatality.
Analysis 2.2
Analysis 2.2
Comparison 2 Cardiorespiratory training versus control ‐ end of retention follow‐up, Outcome 2 Disability ‐ Rivermead Mobility Index.
Analysis 2.3
Analysis 2.3
Comparison 2 Cardiorespiratory training versus control ‐ end of retention follow‐up, Outcome 3 Disability ‐ Nottingham Extended ADL.
Analysis 2.4
Analysis 2.4
Comparison 2 Cardiorespiratory training versus control ‐ end of retention follow‐up, Outcome 4 Disability ‐ Physical Activity and Disability Scale.
Analysis 2.5
Analysis 2.5
Comparison 2 Cardiorespiratory training versus control ‐ end of retention follow‐up, Outcome 5 Disability ‐ Frenchay Activities Index (FAI).
Analysis 2.6
Analysis 2.6
Comparison 2 Cardiorespiratory training versus control ‐ end of retention follow‐up, Outcome 6 Disability ‐ combined disability scales.
Analysis 2.7
Analysis 2.7
Comparison 2 Cardiorespiratory training versus control ‐ end of retention follow‐up, Outcome 7 Physical fitness ‐ maximum cycling work rate (Watts).
Analysis 2.8
Analysis 2.8
Comparison 2 Cardiorespiratory training versus control ‐ end of retention follow‐up, Outcome 8 Physical fitness ‐ peak VO2 (ml/kg/min).
Analysis 2.9
Analysis 2.9
Comparison 2 Cardiorespiratory training versus control ‐ end of retention follow‐up, Outcome 9 Mobility ‐ maximal gait speed (m/min).
Analysis 2.10
Analysis 2.10
Comparison 2 Cardiorespiratory training versus control ‐ end of retention follow‐up, Outcome 10 Mobility ‐ preferred gait speed (m/min).
Analysis 2.11
Analysis 2.11
Comparison 2 Cardiorespiratory training versus control ‐ end of retention follow‐up, Outcome 11 Mobility ‐ gait endurance (6‐MWT metres).
Analysis 2.12
Analysis 2.12
Comparison 2 Cardiorespiratory training versus control ‐ end of retention follow‐up, Outcome 12 Mobility ‐ peak activity index (steps/min).
Analysis 2.13
Analysis 2.13
Comparison 2 Cardiorespiratory training versus control ‐ end of retention follow‐up, Outcome 13 Mobility ‐ max step rate in 1 min.
Analysis 2.14
Analysis 2.14
Comparison 2 Cardiorespiratory training versus control ‐ end of retention follow‐up, Outcome 14 Mobility ‐ Stroke Impact Scale (mobility domain).
Analysis 2.15
Analysis 2.15
Comparison 2 Cardiorespiratory training versus control ‐ end of retention follow‐up, Outcome 15 Physical function ‐ Berg Balance scale.
Analysis 2.16
Analysis 2.16
Comparison 2 Cardiorespiratory training versus control ‐ end of retention follow‐up, Outcome 16 Health‐related QoL ‐ EuroQol EQ‐5D.
Analysis 2.17
Analysis 2.17
Comparison 2 Cardiorespiratory training versus control ‐ end of retention follow‐up, Outcome 17 Mood ‐ Beck Depression Index.
Analysis 2.18
Analysis 2.18
Comparison 2 Cardiorespiratory training versus control ‐ end of retention follow‐up, Outcome 18 Mood ‐ Hospital Anxiety and Depression Scale (HADS) ‐ anxiety score.
Analysis 2.19
Analysis 2.19
Comparison 2 Cardiorespiratory training versus control ‐ end of retention follow‐up, Outcome 19 Mood ‐ Hospital Anxiety and Depression Scale (HADS) ‐ depression score.
Analysis 2.20
Analysis 2.20
Comparison 2 Cardiorespiratory training versus control ‐ end of retention follow‐up, Outcome 20 Mood ‐ combined depression scales.
Analysis 3.1
Analysis 3.1
Comparison 3 Resistance training versus control ‐ end of intervention, Outcome 1 Case fatality.
Analysis 3.2
Analysis 3.2
Comparison 3 Resistance training versus control ‐ end of intervention, Outcome 2 Disability ‐ Late Life Function & Disability Instrument ‐ Disability Frequency Dimension.
Analysis 3.3
Analysis 3.3
Comparison 3 Resistance training versus control ‐ end of intervention, Outcome 3 Disability ‐ Late Life Function & Disability Instrument ‐ Disability Limitation Dimension.
Analysis 3.4
Analysis 3.4
Comparison 3 Resistance training versus control ‐ end of intervention, Outcome 4 Physical fitness ‐ composite measure of muscle strength.
Analysis 3.5
Analysis 3.5
Comparison 3 Resistance training versus control ‐ end of intervention, Outcome 5 Physical fitness ‐ muscle strength, knee extension (Nm).
Analysis 3.6
Analysis 3.6
Comparison 3 Resistance training versus control ‐ end of intervention, Outcome 6 Physical fitness ‐ muscle strength, knee flexion (Nm).
Analysis 3.7
Analysis 3.7
Comparison 3 Resistance training versus control ‐ end of intervention, Outcome 7 Mobility ‐ maximal gait speed (m/min).
Analysis 3.8
Analysis 3.8
Comparison 3 Resistance training versus control ‐ end of intervention, Outcome 8 Mobility ‐ preferred gait speed (m/min).
Analysis 3.9
Analysis 3.9
Comparison 3 Resistance training versus control ‐ end of intervention, Outcome 9 Mobility ‐ gait endurance (6‐MWT metres).
Analysis 3.10
Analysis 3.10
Comparison 3 Resistance training versus control ‐ end of intervention, Outcome 10 Physical function ‐ weight‐bearing (% body weight ‐ affected side).
Analysis 3.11
Analysis 3.11
Comparison 3 Resistance training versus control ‐ end of intervention, Outcome 11 Physical function ‐ stair climbing, maximal (sec/step).
Analysis 3.12
Analysis 3.12
Comparison 3 Resistance training versus control ‐ end of intervention, Outcome 12 Physical function ‐ Timed Up and Go (sec).
Analysis 3.13
Analysis 3.13
Comparison 3 Resistance training versus control ‐ end of intervention, Outcome 13 Physical function ‐ Berg Balance Scale (score 0 to 56).
Analysis 3.14
Analysis 3.14
Comparison 3 Resistance training versus control ‐ end of intervention, Outcome 14 Physical function ‐ balance ‐ antero‐posterior sway.
Analysis 3.15
Analysis 3.15
Comparison 3 Resistance training versus control ‐ end of intervention, Outcome 15 Physical function ‐ balance ‐ mediolateral sway.
Analysis 3.16
Analysis 3.16
Comparison 3 Resistance training versus control ‐ end of intervention, Outcome 16 Physical function ‐ Trunk Impairment Scale [scale 0 to 23].
Analysis 3.17
Analysis 3.17
Comparison 3 Resistance training versus control ‐ end of intervention, Outcome 17 Health‐related QoL ‐ SF‐36 mental health.
Analysis 3.18
Analysis 3.18
Comparison 3 Resistance training versus control ‐ end of intervention, Outcome 18 Health‐related QoL ‐ SF‐36 physical functioning.
Analysis 3.19
Analysis 3.19
Comparison 3 Resistance training versus control ‐ end of intervention, Outcome 19 Mood ‐ Centre for Epidemiologic Studies for Depression scale (CES‐D).
Analysis 3.20
Analysis 3.20
Comparison 3 Resistance training versus control ‐ end of intervention, Outcome 20 Mood ‐ State Trait Anxiety Inventory ‐ Trait Anxiety (score 20 to 80).
Analysis 3.21
Analysis 3.21
Comparison 3 Resistance training versus control ‐ end of intervention, Outcome 21 Mood ‐ State Trait Anxiety Inventory ‐ State Anxiety (score 20 to 80).
Analysis 3.22
Analysis 3.22
Comparison 3 Resistance training versus control ‐ end of intervention, Outcome 22 Mood ‐ Beck Depression Inventory (BDI; score 0 to 63).
Analysis 3.23
Analysis 3.23
Comparison 3 Resistance training versus control ‐ end of intervention, Outcome 23 Mood ‐ combined depression scales.
Analysis 4.1
Analysis 4.1
Comparison 4 Resistance training versus control ‐ end of retention follow‐up, Outcome 1 Case fatality.
Analysis 4.2
Analysis 4.2
Comparison 4 Resistance training versus control ‐ end of retention follow‐up, Outcome 2 Physical fitness ‐ muscle strength, knee extension (Nm).
Analysis 4.3
Analysis 4.3
Comparison 4 Resistance training versus control ‐ end of retention follow‐up, Outcome 3 Physical fitness ‐ muscle strength, knee flexion (Nm).
Analysis 4.4
Analysis 4.4
Comparison 4 Resistance training versus control ‐ end of retention follow‐up, Outcome 4 Mobility ‐ maximal gait speed (m/min).
Analysis 4.5
Analysis 4.5
Comparison 4 Resistance training versus control ‐ end of retention follow‐up, Outcome 5 Mobility ‐ gait endurance (6‐MWT metres).
Analysis 4.6
Analysis 4.6
Comparison 4 Resistance training versus control ‐ end of retention follow‐up, Outcome 6 Physical function ‐ Timed Up and Go (sec).
Analysis 4.7
Analysis 4.7
Comparison 4 Resistance training versus control ‐ end of retention follow‐up, Outcome 7 Mood ‐ Centre for Epidemiologic Studies for Depression scale (CES‐D).
Analysis 5.1
Analysis 5.1
Comparison 5 Mixed training versus control ‐ end of intervention, Outcome 1 Case fatality.
Analysis 5.2
Analysis 5.2
Comparison 5 Mixed training versus control ‐ end of intervention, Outcome 2 Disability ‐ Lawton IADL.
Analysis 5.3
Analysis 5.3
Comparison 5 Mixed training versus control ‐ end of intervention, Outcome 3 Disability ‐ Barthel Index (BI).
Analysis 5.4
Analysis 5.4
Comparison 5 Mixed training versus control ‐ end of intervention, Outcome 4 Disability ‐ Rivermead Mobility Index (RMI).
Analysis 5.5
Analysis 5.5
Comparison 5 Mixed training versus control ‐ end of intervention, Outcome 5 Disability ‐ Nottingham Extended ADL.
Analysis 5.6
Analysis 5.6
Comparison 5 Mixed training versus control ‐ end of intervention, Outcome 6 Disability ‐ Functional Independence Measure (FIM).
Analysis 5.7
Analysis 5.7
Comparison 5 Mixed training versus control ‐ end of intervention, Outcome 7 Disability ‐ Stroke Impact Scale (SIS‐16).
Analysis 5.8
Analysis 5.8
Comparison 5 Mixed training versus control ‐ end of intervention, Outcome 8 Disability ‐ Katz ADL Scale.
Analysis 5.9
Analysis 5.9
Comparison 5 Mixed training versus control ‐ end of intervention, Outcome 9 Disability ‐ combined disability scales.
Analysis 5.10
Analysis 5.10
Comparison 5 Mixed training versus control ‐ end of intervention, Outcome 10 Risk factors ‐ blood pressure, systolic.
Analysis 5.11
Analysis 5.11
Comparison 5 Mixed training versus control ‐ end of intervention, Outcome 11 Risk factors ‐ blood pressure, diastolic.
Analysis 5.12
Analysis 5.12
Comparison 5 Mixed training versus control ‐ end of intervention, Outcome 12 Physical fitness ‐ peak VO2 (ml/kg/min).
Analysis 5.13
Analysis 5.13
Comparison 5 Mixed training versus control ‐ end of intervention, Outcome 13 Physical fitness ‐ gait economy, VO2 (ml/kg/metre).
Analysis 5.14
Analysis 5.14
Comparison 5 Mixed training versus control ‐ end of intervention, Outcome 14 Physical fitness ‐ muscle strength, ankle dorsiflexion*.
Analysis 5.15
Analysis 5.15
Comparison 5 Mixed training versus control ‐ end of intervention, Outcome 15 Physical fitness ‐ muscle strength, knee extension*.
Analysis 5.16
Analysis 5.16
Comparison 5 Mixed training versus control ‐ end of intervention, Outcome 16 Physical fitness ‐ muscle strength, knee flexion.
Analysis 5.17
Analysis 5.17
Comparison 5 Mixed training versus control ‐ end of intervention, Outcome 17 Physical fitness ‐ muscle strength, elbow extension force (N).
Analysis 5.18
Analysis 5.18
Comparison 5 Mixed training versus control ‐ end of intervention, Outcome 18 Physical fitness ‐ muscle strength, elbow flexion force (N).
Analysis 5.19
Analysis 5.19
Comparison 5 Mixed training versus control ‐ end of intervention, Outcome 19 Physical fitness ‐ muscle strength, grip force (N).
Analysis 5.20
Analysis 5.20
Comparison 5 Mixed training versus control ‐ end of intervention, Outcome 20 Physical fitness ‐ muscle strength, grip strength (paretic hand).
Analysis 5.21
Analysis 5.21
Comparison 5 Mixed training versus control ‐ end of intervention, Outcome 21 Physical fitness ‐ muscle strength, leg extensor power (affected leg) W/Kg.
Analysis 5.22
Analysis 5.22
Comparison 5 Mixed training versus control ‐ end of intervention, Outcome 22 Mobility ‐ Functional Ambulation Categories.
Analysis 5.23
Analysis 5.23
Comparison 5 Mixed training versus control ‐ end of intervention, Outcome 23 Mobility ‐ preferred gait speed (m/min).
Analysis 5.24
Analysis 5.24
Comparison 5 Mixed training versus control ‐ end of intervention, Outcome 24 Mobility ‐ preferred gait speed (m/min); subgroup: therapy time.
Analysis 5.25
Analysis 5.25
Comparison 5 Mixed training versus control ‐ end of intervention, Outcome 25 Mobility ‐ gait endurance (6‐MWT metres).
Analysis 5.26
Analysis 5.26
Comparison 5 Mixed training versus control ‐ end of intervention, Outcome 26 Mobility ‐ Community Ambulation Speed (> 0.8 m/sec).
Analysis 5.27
Analysis 5.27
Comparison 5 Mixed training versus control ‐ end of intervention, Outcome 27 Physical function ‐ balance ‐ Berg Balance scale.
Analysis 5.28
Analysis 5.28
Comparison 5 Mixed training versus control ‐ end of intervention, Outcome 28 Physical function ‐ balance ‐ functional reach.
Analysis 5.29
Analysis 5.29
Comparison 5 Mixed training versus control ‐ end of intervention, Outcome 29 Physical function ‐ balance ‐ Four Square Step Test.
Analysis 5.30
Analysis 5.30
Comparison 5 Mixed training versus control ‐ end of intervention, Outcome 30 Physical function ‐ balance ‐ timed balance test.
Analysis 5.31
Analysis 5.31
Comparison 5 Mixed training versus control ‐ end of intervention, Outcome 31 Physical function ‐ balance ‐ combined outcome data.
Analysis 5.32
Analysis 5.32
Comparison 5 Mixed training versus control ‐ end of intervention, Outcome 32 Physical function ‐ Timed Up and Go (sec).
Analysis 5.33
Analysis 5.33
Comparison 5 Mixed training versus control ‐ end of intervention, Outcome 33 Physical function ‐ Timed Up and Go (sec) ‐ sensitivity analysis ‐ unconfounded trials.
Analysis 5.34
Analysis 5.34
Comparison 5 Mixed training versus control ‐ end of intervention, Outcome 34 Physical function ‐ Action Research Arm Test.
Analysis 5.35
Analysis 5.35
Comparison 5 Mixed training versus control ‐ end of intervention, Outcome 35 Health‐related QoL ‐ SF‐36 physical functioning.
Analysis 5.36
Analysis 5.36
Comparison 5 Mixed training versus control ‐ end of intervention, Outcome 36 Health‐related QoL ‐ SF‐36 social role functioning.
Analysis 5.37
Analysis 5.37
Comparison 5 Mixed training versus control ‐ end of intervention, Outcome 37 Health‐related QoL ‐ SF‐36 physical role functioning.
Analysis 5.38
Analysis 5.38
Comparison 5 Mixed training versus control ‐ end of intervention, Outcome 38 Health‐related QoL ‐ SF‐36 emotional role functioning.
Analysis 5.39
Analysis 5.39
Comparison 5 Mixed training versus control ‐ end of intervention, Outcome 39 Health‐related QoL ‐ Stroke‐Adapted Sickness Impact profile.
Analysis 5.40
Analysis 5.40
Comparison 5 Mixed training versus control ‐ end of intervention, Outcome 40 Health‐related QoL ‐ EuroQol (Health State).
Analysis 5.41
Analysis 5.41
Comparison 5 Mixed training versus control ‐ end of intervention, Outcome 41 Health‐related QoL ‐ EuroQol (self perceived health).
Analysis 5.42
Analysis 5.42
Comparison 5 Mixed training versus control ‐ end of intervention, Outcome 42 Mood ‐ Hospital Anxiety and Depression Scale (HADS) ‐ anxiety score.
Analysis 5.43
Analysis 5.43
Comparison 5 Mixed training versus control ‐ end of intervention, Outcome 43 Mood ‐ Hospital Anxiety and Depression Scale (HADS) ‐ depression score.
Analysis 5.44
Analysis 5.44
Comparison 5 Mixed training versus control ‐ end of intervention, Outcome 44 Mood ‐ Stroke Impact Scale emotion score.
Analysis 5.45
Analysis 5.45
Comparison 5 Mixed training versus control ‐ end of intervention, Outcome 45 Mood ‐ Geriatric Depression Scale.
Analysis 5.46
Analysis 5.46
Comparison 5 Mixed training versus control ‐ end of intervention, Outcome 46 Mood ‐ combined depression scales.
Analysis 5.47
Analysis 5.47
Comparison 5 Mixed training versus control ‐ end of intervention, Outcome 47 Cognitive function ‐ FIM cognitive score.
Analysis 5.48
Analysis 5.48
Comparison 5 Mixed training versus control ‐ end of intervention, Outcome 48 Cognitive function ‐ SIS memory and thinking.
Analysis 5.49
Analysis 5.49
Comparison 5 Mixed training versus control ‐ end of intervention, Outcome 49 Cognitive function ‐ SIS communication.
Analysis 6.1
Analysis 6.1
Comparison 6 Mixed training versus control ‐ end of retention follow‐up, Outcome 1 Case fatality.
Analysis 6.2
Analysis 6.2
Comparison 6 Mixed training versus control ‐ end of retention follow‐up, Outcome 2 Disability ‐ Barthel Index (BI).
Analysis 6.3
Analysis 6.3
Comparison 6 Mixed training versus control ‐ end of retention follow‐up, Outcome 3 Disability ‐ Functional Independence Measure (FIM).
Analysis 6.4
Analysis 6.4
Comparison 6 Mixed training versus control ‐ end of retention follow‐up, Outcome 4 Disability ‐ Nottingham Extended ADL.
Analysis 6.5
Analysis 6.5
Comparison 6 Mixed training versus control ‐ end of retention follow‐up, Outcome 5 Disability ‐ Rivermead Mobility Index (RMI).
Analysis 6.6
Analysis 6.6
Comparison 6 Mixed training versus control ‐ end of retention follow‐up, Outcome 6 Disability ‐ combined disability scales.
Analysis 6.7
Analysis 6.7
Comparison 6 Mixed training versus control ‐ end of retention follow‐up, Outcome 7 Physical fitness ‐ gait economy, VO2 (ml/kg/metre).
Analysis 6.8
Analysis 6.8
Comparison 6 Mixed training versus control ‐ end of retention follow‐up, Outcome 8 Physical fitness ‐ muscle strength, knee flexion.
Analysis 6.9
Analysis 6.9
Comparison 6 Mixed training versus control ‐ end of retention follow‐up, Outcome 9 Physical fitness ‐ muscle strength, knee extension.
Analysis 6.10
Analysis 6.10
Comparison 6 Mixed training versus control ‐ end of retention follow‐up, Outcome 10 Physical fitness ‐ muscle strength, leg extensor power (affected leg) W/Kg.
Analysis 6.11
Analysis 6.11
Comparison 6 Mixed training versus control ‐ end of retention follow‐up, Outcome 11 Physical fitness ‐ grip strength (paretic hand).
Analysis 6.12
Analysis 6.12
Comparison 6 Mixed training versus control ‐ end of retention follow‐up, Outcome 12 Mobility ‐ Functional Ambulation Categories.
Analysis 6.13
Analysis 6.13
Comparison 6 Mixed training versus control ‐ end of retention follow‐up, Outcome 13 Mobility ‐ preferred gait speed (m/min).
Analysis 6.14
Analysis 6.14
Comparison 6 Mixed training versus control ‐ end of retention follow‐up, Outcome 14 Mobility ‐ gait endurance (6‐MWT metres).
Analysis 6.15
Analysis 6.15
Comparison 6 Mixed training versus control ‐ end of retention follow‐up, Outcome 15 Mobility ‐ community ambulation speed (> 0.8 m/sec).
Analysis 6.16
Analysis 6.16
Comparison 6 Mixed training versus control ‐ end of retention follow‐up, Outcome 16 Physical function ‐ balance ‐ Berg Balance Scale.
Analysis 6.17
Analysis 6.17
Comparison 6 Mixed training versus control ‐ end of retention follow‐up, Outcome 17 Physical function ‐ balance ‐ functional reach.
Analysis 6.18
Analysis 6.18
Comparison 6 Mixed training versus control ‐ end of retention follow‐up, Outcome 18 Physical function ‐ balance ‐ timed balance test.
Analysis 6.19
Analysis 6.19
Comparison 6 Mixed training versus control ‐ end of retention follow‐up, Outcome 19 Physical function ‐ Timed Up and Go (sec).
Analysis 6.20
Analysis 6.20
Comparison 6 Mixed training versus control ‐ end of retention follow‐up, Outcome 20 Health‐related QoL ‐ EuroQol (Health State).
Analysis 6.21
Analysis 6.21
Comparison 6 Mixed training versus control ‐ end of retention follow‐up, Outcome 21 Health‐related QoL ‐ EuroQol (self perceived health).
Analysis 6.22
Analysis 6.22
Comparison 6 Mixed training versus control ‐ end of retention follow‐up, Outcome 22 Health‐related QoL ‐ SF‐36 physical functioning.
Analysis 6.23
Analysis 6.23
Comparison 6 Mixed training versus control ‐ end of retention follow‐up, Outcome 23 Health‐related QoL ‐ SF‐36 physical role functioning.
Analysis 6.24
Analysis 6.24
Comparison 6 Mixed training versus control ‐ end of retention follow‐up, Outcome 24 Health‐related QoL ‐ SF‐36 emotional role functioning.
Analysis 6.25
Analysis 6.25
Comparison 6 Mixed training versus control ‐ end of retention follow‐up, Outcome 25 Health‐related QoL ‐ Stroke‐Adapted Sickness Impact profile.
Analysis 6.26
Analysis 6.26
Comparison 6 Mixed training versus control ‐ end of retention follow‐up, Outcome 26 Mood ‐ Stroke Impact Scale emotion score.
Analysis 6.27
Analysis 6.27
Comparison 6 Mixed training versus control ‐ end of retention follow‐up, Outcome 27 Mood ‐ Geriatric Depression Scale.
Analysis 6.28
Analysis 6.28
Comparison 6 Mixed training versus control ‐ end of retention follow‐up, Outcome 28 Mood ‐ Hospital Anxiety and Depression Scale (HADS) ‐ anxiety score.
Analysis 6.29
Analysis 6.29
Comparison 6 Mixed training versus control ‐ end of retention follow‐up, Outcome 29 Mood ‐ Hospital Anxiety and Depression Scale (HADS) ‐ depression score.
Analysis 6.30
Analysis 6.30
Comparison 6 Mixed training versus control ‐ end of retention follow‐up, Outcome 30 Mood ‐ combined depression scales.
Analysis 6.31
Analysis 6.31
Comparison 6 Mixed training versus control ‐ end of retention follow‐up, Outcome 31 Cognitive function ‐ FIM cognitive score.
Analysis 6.32
Analysis 6.32
Comparison 6 Mixed training versus control ‐ end of retention follow‐up, Outcome 32 Cognitive function ‐ SIS memory and thinking.
Analysis 6.33
Analysis 6.33
Comparison 6 Mixed training versus control ‐ end of retention follow‐up, Outcome 33 Cognitive function ‐ SIS communication.
Analysis 7.1
Analysis 7.1
Comparison 7 Cardiorespiratory versus resistance versus mixed training, Outcome 1 Disability ‐ combined disability scales.
Analysis 7.2
Analysis 7.2
Comparison 7 Cardiorespiratory versus resistance versus mixed training, Outcome 2 Mobility ‐ maximal walking speed.
Analysis 7.3
Analysis 7.3
Comparison 7 Cardiorespiratory versus resistance versus mixed training, Outcome 3 Mobility ‐ preferred walking speed (m/min).
Analysis 7.4
Analysis 7.4
Comparison 7 Cardiorespiratory versus resistance versus mixed training, Outcome 4 Mobility ‐ gait endurance (6‐MWT metres).
Analysis 7.5
Analysis 7.5
Comparison 7 Cardiorespiratory versus resistance versus mixed training, Outcome 5 Balance ‐ Berg Balance Scale.

Update of

References

References to studies included in this review

    1. Ada L, Dean CM, Lindley R. Randomized trial of treadmill training to improve walking in community‐dwelling people after stroke: the AMBULATE trial. International Journal of Stroke 2013;8(6):436‐44. - PubMed
    2. Dean CM, Ada L, Lindley RI. Treadmill training provides greater benefit to the subgroup of community‐dwelling people after stroke who walk faster than 0.4m/s: a randomised trial. Journal of Physiotherapy (Australian Physiotherapy Association) 2014;60(2):97‐101. - PubMed
    1. Aidar FJ, Silva AJ, Reis VM, Carniero A, Carniero‐Cotta S. A study on the quality of life in ischaemic vascular accidents and its relation to physical activity [Estudio de la calidad de vida en el accidente vascular isquémico y su relación con la acividad física]. Revista de Neurología 2007;45:518‐22. - PubMed
    1. Aidar FJ, Oliveira RJ, Silva AJ, Matos Dihogo G, Mazini Filho ML, Hickner RC, et al. The influence of resistance exercise training on the levels of anxiety in ischemic stroke. Stroke Research and Treatment 2012;2012:298‐375. - PMC - PubMed
    1. Aidar FJ, Matos DG, Oliveira RJ, Carneiro AL, Cabral BG de AT, Dantas PMS, et al. Relationship between depression and strength training in survivors of the ischemic stroke. Journal of Human Kinetics 2014;43:7‐15. - PMC - PubMed
    1. Bale M, Strand LI. Does functional strength training of the leg in subacute stroke improve physical performance? A pilot randomized controlled trial. Clinical Rehabilitation 2008;22(10‐11):911‐21. - PubMed

References to studies excluded from this review

    1. Ada L, Dean CM, Hall JM, Bampton J, Crompton S. A treadmill and overground walking program improves walking in individuals residing in the community after stroke: a placebo‐controlled randomised trial. Internal Medicine Journal 2004;34(1‐2):A7. - PubMed
    2. Ada L, Dean CM, Hall JM, Bampton J, Crompton S. A treadmill and overground walking program improves walking in persons residing in the community after stroke: a placebo‐controlled, randomized trial. Archives of Physical Medicine and Rehabilitation 2003;84(10):1486‐91. - PubMed
    1. Ada L, Dean CM, Morris ME, Simpson JM, Katrak P. Randomized trial of treadmill walking with body weight support to establish walking in subacute stroke. The MOBILISE Trial. Stroke 2010;41:1237‐42. - PubMed
    1. Adie K, Schofield C, Berrow M, Pritchard C, Freeman J, Humfryes J, et al. Does the use of Nintendo Wii Sports improve arm function and is it acceptable to patients after stroke? Publication of the protocol of the Trial of Wii in Stroke ‐ TWIST. International Journal of General Medicine 2014;7:475‐81. - PMC - PubMed
    1. Aidar F, Garrido N, Silva A, Reis V, Marinho D, Oliveira RJ. Effects of aquatic exercise on depression and anxiety in ischemic stroke subjects. Health 2013;5(2):222‐8.
    1. Akbari A, Karimi H. The effect of strengthening exercises on exaggerated muscle tonicity in chronic hemiparesis following stroke. Journal of Medical Sciences 2006;6(3):382‐8.

References to studies awaiting assessment

    1. Arya K, Verma R, Garg RK, Sharma VP, Agarwal M, Aggarwal GG. Meaningful Task‐Specific Training (MTST) for stroke rehabilitation: a randomized controlled trial. Topics in Stroke Rehabilitation 2012;19(3):193‐211. - PubMed
    1. Askim T, Morkved S, Engen A, Roos K, Aas T, Indredavik B. Effects of a community‐based intensive motor training program combined with early supported discharge after treatment in a comprehensive stroke unit: a randomized, controlled trial. Stroke 2010;41(8):1697‐703. - PubMed
    1. Buyukavci R, Iahin F, Sat S, Dotu B, Kuran B. The effect of trunk balance training on motor recovery, trunk balance, ambulation and quality of life in subacute stroke patients: a randomized controlled trial. Turkiye Fiziksel Tip ve Rehabilitasyon Dergisi 2011;57:270.
    1. Byun SD, Jung TD, Kim CH, Lee YS. Effects of the sliding rehabilitation machine on balance and gait in chronic stroke patients ‐ a controlled clinical trial. Clinical Rehabilitation 2011;25(5):408‐15. - PubMed
    1. Dean CM, Ada L, Bampton J, Morris ME, Katrak PH, Potts S. Treadmill walking with body weight support in subacute non‐ambulatory stroke improves walking capacity more than overground walking: a randomised trial. Journal of Physiotherapy 2010;56(2):97‐103. - PubMed

References to ongoing studies

    1. Brauer S. The efficacy of a novel, non‐robotic intervention to train reaching post stroke. ANZCTR. [ ACTRN12608000457347 ]
    2. Brauer S, Hayward K, Carson R, Cresswell A, Barker R. The efficacy of SMART Arm training early after stroke for stroke survivors with severe upper limb disability: a protocol for a randomised controlled trial. BMC Neurology 2013;13:71. - PMC - PubMed
    1. English C, Bernhardt J, Crotty M, Esterman A, Segal L, Hillier S. Circuit class therapy or seven‐day week therapy for increasing rehabilitation intensity of therapy after stroke (CIRCIT): a randomized controlled trial. International Journal of Stroke 2015;10(4):594‐602. - PubMed
    2. English C, Bernhardt J, Hillier S. Circuit class therapy and 7‐day‐week therapy increase physiotherapy time, but not patient activity: early results from the CIRCIT Trial. Stroke 2014;45(10):3002‐7. - PubMed
    3. Hillier S. Circuit class therapy for rehabilitation after stroke. A pragmatic randomised controlled trial (CIRCIT). ANZCTR. [ACTRN12610000096055]
    4. Hillier S, English C, Bernhardt J, Crotty M, Esterman A, Segal L. Free communications 3: Multidisciplinary rehabilitation circuit class and 7‐day week therapy for increasing rehabilitation intensity of therapy after stroke (CIRCIT): Six month follow‐up and cost analysis of the CIRCIT RCT. International Journal of Stroke 2014;9:21.
    5. Hillier S, English C, Crotty M, Segal L, Bernhardt J, Esterman A. Circuit class or seven‐day therapy for increasing intensity of rehabilitation after stroke: protocol of the CIRCIT trial. International Journal of Stroke 2011;6(6):560‐5. - PubMed
    1. Reynolds J. The effect of moderate‐intensity cardiovascular fitness training compared to standard care in people with a diagnosis of stroke: a pilot randomised controlled trial. ANZCTR. [ACTRN12613000822785]
    1. Hariohm K, Prakash V, Vasanthan R, Daran JKD, Samuel RJ. An RCT protocol on efficacy of deep knee flexion exercises on improving activities involving deep knee flexion and quality of life in persons with stroke. Cerebrovascular Diseases 2013;36:15.
    1. Pomeroy VM, Ward NS, Johansen‐Berg H, Vliet P, Burridge J, Hunter SM, et al. FAST INdiCATE Trial protocol. Clinical efficacy of functional strength training for upper limb motor recovery early after stroke: Neural correlates and prognostic indicators. International Journal of Stroke 2014;9(2):240‐5. - PMC - PubMed
    2. Walker A. Clinical efficacy of functional strength training for upper limb motor recovery early after stroke: neural correlates and prognostic indicators. http://www.controlled‐trials.com/ (accessed January 2013). - PMC - PubMed

Additional references

    1. American College of Sports Medicine. The recommended quantity and quality of exercise for developing and maintaining cardiorespiratory and muscular fitness, and flexibility in healthy adults. Medicine and Science in Sports and Exercise 1998;30(6):975‐91. - PubMed
    1. Garber CE, Blissmer B, Deschenes MR, Franklin BA, LaMonte MJ, Lee IM, et al. Quantity and quality of exercise for developing and maintaining cardiorespiratory, musculoskeletal, and neuromotor fitness in apparently healthy adults: guidance for prescribing exercise. Medicine & Science in Sports & Exercise 2011;43(7):1334‐59. - PubMed
    1. Ada L, Dean CM, Nascimento LR, Teixeira‐Salmela LF. Treadmill training is effective for ambulatory adults with stroke: a systematic review. Journal of Physiotherapy 2013;59(2):73‐80. - PubMed
    1. Beck AT, Ward CH, Mendelson M, Mock J, Erbaugh J. An inventory for measuring depression. Archives of General Psychiatry 1961;4:561‐71. - PubMed
    1. Bernhardt J, Dewey H, Thrift A, Donnan G. Inactive and alone: physical activity within the first 14 days of acute stroke unit care. Stroke 2004;35(4):1005‐9. - PubMed

References to other published versions of this review

    1. Brazzelli M, Saunders DH, Greig CA, Mead GE. Physical fitness training for stroke patients: a systematic review of the evidence. International Journal of Stroke2011; Vol. 6:11. - PubMed
    1. Brazzelli M, Saunders DH, Greig CA, Mead GE. Physical fitness training for stroke patients. Cochrane Database of Systematic Reviews 2011, Issue 11. [DOI: 10.1002/14651858.CD003316.pub4] - DOI - PubMed
    1. Brazzelli M, Saunders DH, Greig CA, Mead GE. Physical fitness training for patients with stroke updated review. Stroke 2012;43(4):E39‐40. - PubMed
    1. Saunders DH, Greig CA, Young A, Mead GE. Physical fitness training for acute stroke patients ‐ a systematic review. Cerebrovascular Diseases 2002;13 Suppl 3:63.
    1. Saunders DH, Greig C, Young A, Mead G. Physical fitness training for stroke patients. Cochrane Database of Systematic Reviews 2004, Issue 1. [DOI: 10.1002/14651858.CD003316.pub2] - DOI - PubMed

Publication types