. 2016 Mar 24:7:11040.
doi: 10.1038/ncomms11040.

CETSA screening identifies known and novel thymidylate synthase inhibitors and slow intracellular activation of 5-fluorouracil

Affiliations

CETSA screening identifies known and novel thymidylate synthase inhibitors and slow intracellular activation of 5-fluorouracil

Helena Almqvist et al. Nat Commun. .

Abstract

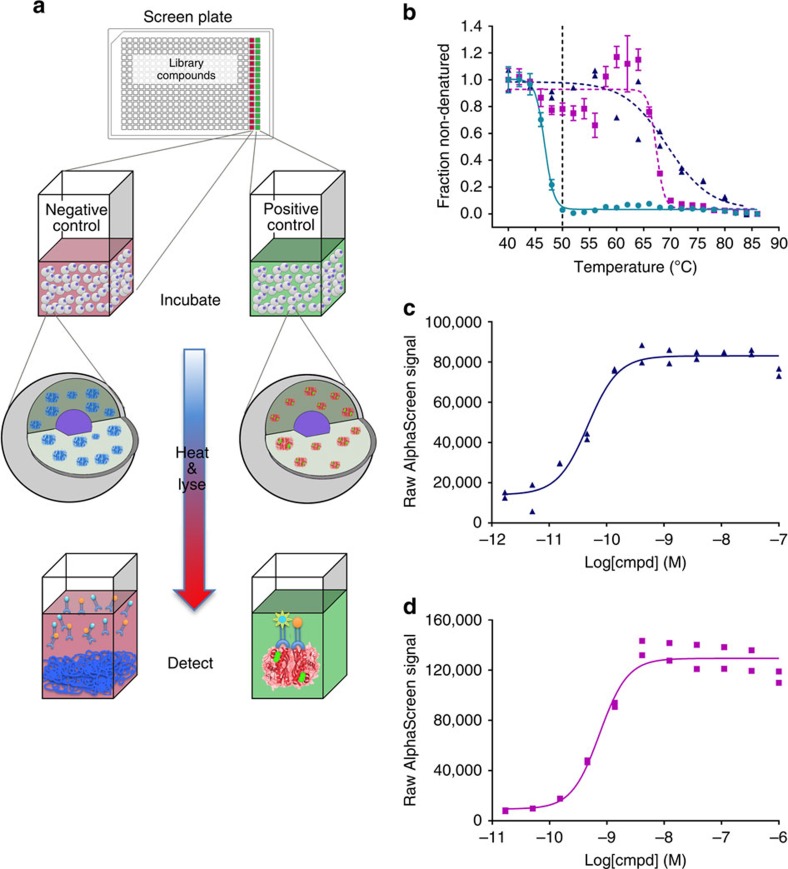
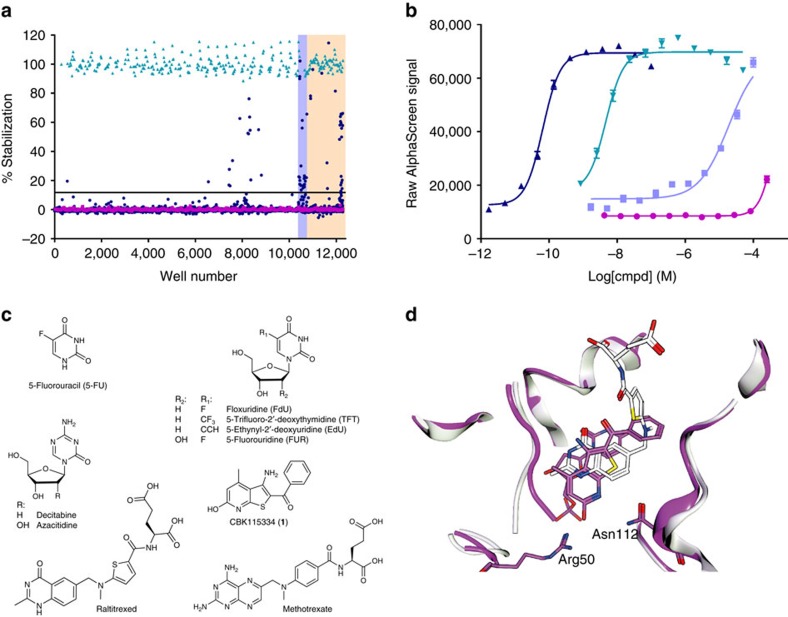
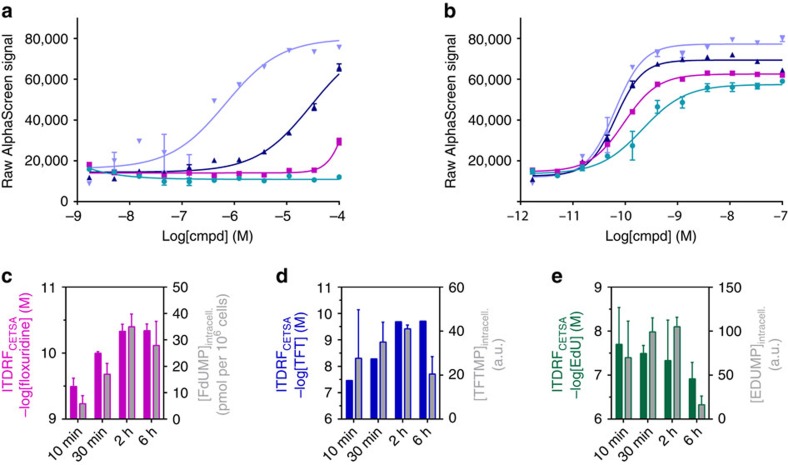
Target engagement is a critical factor for therapeutic efficacy. Assessment of compound binding to native target proteins in live cells is therefore highly desirable in all stages of drug discovery. We report here the first compound library screen based on biophysical measurements of intracellular target binding, exemplified by human thymidylate synthase (TS). The screen selected accurately for all the tested known drugs acting on TS. We also identified TS inhibitors with novel chemistry and marketed drugs that were not previously known to target TS, including the DNA methyltransferase inhibitor decitabine. By following the cellular uptake and enzymatic conversion of known drugs we correlated the appearance of active metabolites over time with intracellular target engagement. These data distinguished a much slower activation of 5-fluorouracil when compared with nucleoside-based drugs. The approach establishes efficient means to associate drug uptake and activation with target binding during drug discovery.


Conflict of interest statement

D.M.M. and P.N. are founders of the company Pelago Bioscience AB. D.C., A.L., A.M., P.A, R.J., T.L., H.Al., M.H. and H.Ax. declare no competing financial interests.

Figures

Figure 1
Figure 1. Development of a no-wash CETSA for human TS.
(a) Overview of the assay principle with live K562 cells seeded into a 384-well PCR plate. The plate contains controls or library compounds that are taken up by the cells. Following a pre-incubation period the plate is transiently heated for 3 min followed by cooling and cell lysis. Part of the cell lysate is transferred to a detection plate, to which antibodies and AlphaScreen beads are added to allow measurements of remaining soluble TS. (b) CETSA derived Tagg curves for TS in K562 cells in the presence of DMSO (0.5%) (green circle), 15 μM floxuridine (blue triangle) or 1 μM raltitrexed (magenta square). All data were normalized to the response observed for each treatment condition at the lowest test temperature. The solid line represents the best fit to the Boltzmann sigmoid equation resulting in an apparent Tagg of 46.7±0.2 °C for the DMSO control, whereas both floxuridine and raltitrexed stabilized TS above 65 °C (we do not consider higher Tagg values reliable as these temperatures influence cell membrane integrity10). The vertical dotted line is at 50 °C, the temperature selected for the isothermal screen. Data are provided as the average and standard error of mean (s.e.m.) from two independent experiments performed in duplicate for raltitrexed and as individual data points from one experiment in duplicate for floxuridine. (c) ITDRFCETSA of floxuridine (blue triangle) at 50 °C based on raw data from the AlphaScreen readings. The solid line represents the best fit to a saturation binding curve resulting in an EC50 of 47±16 pM. Data are provided as two individual data points from one test occasion. (d) The corresponding ITDRFCETSA for raltitrexed (magenta square) at 50 °C resulting in an EC50 of 0.75±0.2 nM. Data are provided as two individual data points from one test occasion.
Figure 2
Figure 2. Primary screen using CETSA to measure target engagement of human thymidylate synthase.
(a) Scatter plot illustrating normalized screen data, where 0% corresponds to the TS signal observed in the presence of DMSO only (magenta square) and 100% corresponds to the TS signal observed in the presence of 100 nM raltitrexed (green triangle). Data for library compounds at a concentration of 50 μM are shown in blue (blue circle). The hit limit was calculated based on the average plus three standard deviations for the library compounds and is illustrated as a black solid line at 11.7%. The locations of the Prestwick drug set (yellow) and a nucleoside subset (purple) are highlighted. (b) ITDRFCETSA data illustrating the ranking of floxuridine (blue upwards triangle), 5-fluorouridine (FUR) (green downwards triangle), and 5-FU (lavender blue square) after 2 h of preincubation time. Data are also included for CBK115334 (magenta circle).The solid lines represent best fits to a saturation binding curve resulting in an apparent EC50 of TS at a concentration of 65±9 pM, 47±15 nM, 19±4 μM and 0.46±0.08 mM, respectively. Data are provided as the average and s.e.m. from one independent hit confirmation experiment done in quadruplicate. (c) Structures of known drugs and hit compounds discussed in the main text. (d) Structure of CBK115334 (magenta) and dUMP bound to TS, shown overlayed on the structure of the complex of raltitrexed (white) and dUMP (PDB 1HVY).
Figure 3
Figure 3. Time dependence of target engagement and correlation with the appearance of intracellular active metabolites.
(a) Representative ITDRFCETSA curves for 5-fluorouracil as a function of preincubation time in K562 cells; 10 min (green circle), 30 min (magenta square), 2 h (blue upwards triangle) and 6 h (lavender blue downwards triangle). The solid lines represent best fits to a saturation binding curve function to yield ITDRFCETSA values for half-maximal stabilization of TS. Data are provided as the average and s.e.m. from experiments done in quadruplicate at a single test occasion. (b) The corresponding ITDRFCETSA data for floxuridine. (c) Half-maximal stabilization of TS (magenta) and intracellular concentration of FdUMP (grey) as a function of preincubation time with floxuridine. The CETSA data are presented as the average and range from two independent experiments. The LC–MS/MS data are provided as the average and s.e.m. from experiments done at three different occasions. (d) The corresponding data for TFT (blue) and TFTMP (grey). (e) The corresponding data for EdU (green) and EdUMP (grey).
Figure 4
Figure 4. Target engagement by decitabine is dependent on its metabolic activation.
(a) Schematic overview of decitabine treatment, cellular uptake and intracellular metabolic conversion. After uptake decitabine is phosphorylated to form 5-aza-2′-deoxycytidine 5′-monophosphate by DCK. This compound is further phosphorylated in two steps to yield the triphosphate that is incorporated into DNA. Cytidine deaminase (CDA) and DCTD are known to be involved in the metabolism and clearance of decitabine. (b) Tagg experiments for CDK in the absence (green circle) and presence of 200 μM of the DCK inhibitor DI-82 (magenta square). Above the graphs are the chemiluminescence data (full blots are available in Supplementary Fig. 16). The experiments were performed in K562 cells at two independent occasions. (c) ITDRFCETSA data for decitabine in the absence (magenta square) and presence of 200 μM of the DCK inhibitor DI-82 (green circle). Full blots are available in Supplementary Fig. 16. The experiments were performed in K562 cells at two independent occasions. (d) Normalized thermal shift assay response for recombinant human TS in the absence (magenta square) and presence of 1 mM decitabine without prior enzyme treatment (blue upwards triangle), following DCK treatment (lavender blue downwards triangle) and following treatment with both DCK and DCTD (magenta square). The data are shown as the average and s.e.m. from triplicate samples at one test occasion. (e) Enzyme inhibition data for TS in the presence of control and enzymatically treated decitabine samples. The data are shown as the average and s.e.m. from triplicate samples at one test occasion.

References

    1. Morgan P. et al. Can the flow of medicines be improved? Fundamental pharmacokinetic and pharmacological principles toward improving Phase II survival. Drug Discov. Today 17, 419–424 (2012). - PubMed
    1. Bunnage M. E., Chekler E. L. P. & Jones L. H. Target validation using chemical probes. Nat. Chem. Biol. 9, 195–199 (2013). - PubMed
    1. Cook D. et al. Lessons learned from the fate of AstraZeneca's drug pipeline: a five-dimensional framework. Nat. Rev. Drug Discov. 13, 419–431 (2014). - PubMed
    1. Simon G. M., Niphakis M. J. & Cravatt B. F. Determining target engagement in living systems. Nat. Chem. Biol. 9, 200–205 (2013). - PMC - PubMed
    1. Durham T. B. & Blanco M.-J. Target engagement in lead generation. Bioorg. Med. Chem. Lett. 25, 998–1008 (2015). - PubMed

Publication types

MeSH terms