. 2016 Mar 24;11(3):e0152191.
doi: 10.1371/journal.pone.0152191. eCollection 2016.

Imaging Mass Spectrometry Reveals Acyl-Chain- and Region-Specific Sphingolipid Metabolism in the Kidneys of Sphingomyelin Synthase 2-Deficient Mice

Affiliations

Imaging Mass Spectrometry Reveals Acyl-Chain- and Region-Specific Sphingolipid Metabolism in the Kidneys of Sphingomyelin Synthase 2-Deficient Mice

Masayuki Sugimoto et al. PLoS One. .

Abstract

Obesity was reported to cause kidney injury by excessive accumulation of sphingolipids such as sphingomyelin and ceramide. Sphingomyelin synthase 2 (SMS2) is an important enzyme for hepatic sphingolipid homeostasis and its dysfunction is considered to result in fatty liver disease. The expression of SMS2 is also high in the kidneys. However, the contribution of SMS2 on renal sphingolipid metabolism remains unclear. Imaging mass spectrometry is a powerful tool to visualize the distribution and provide quantitative data on lipids in tissue sections. Thus, in this study, we analyzed the effects of SMS2 deficiency on the distribution and concentration of sphingomyelins in the liver and kidneys of mice fed with a normal-diet or a high-fat-diet using imaging mass spectrometry and liquid chromatography/electrospray ionization-tandem mass spectrometry. Our study revealed that high-fat-diet increased C18-C22 sphingomyelins, but decreased C24-sphingomyelins, in the liver and kidneys of wild-type mice. By contrast, SMS2 deficiency decreased C18-C24 sphingomyelins in the liver. Although a similar trend was observed in the whole-kidneys, the effects were minor. Interestingly, imaging mass spectrometry revealed that sphingomyelin localization was specific to each acyl-chain length in the kidneys. Further, SMS2 deficiency mainly decreased C22-sphingomyelin in the renal medulla and C24-sphingomyelins in the renal cortex. Thus, imaging mass spectrometry can provide visual assessment of the contribution of SMS2 on acyl-chain- and region-specific sphingomyelin metabolism in the kidneys.


Conflict of interest statement

Competing Interests: Prof. Yuji Kuge and Yasuyuki Igarashi have received a research grant from Shionogi & Co., Ltd. Drs. Masayuki Sugimoto, Masato Wakabayashi, Takeshi Yoshioka, Kenichi Higashino, Yoshito Numata, and Tomohiko Okuda have employment at Shionogi & Co., Ltd. All the other authors have reported that they have no relationships relevant to the contents of this paper to disclose. The above interests do not alter the authors' adherence to all the PLOS ONE policies on sharing data and materials.

Figures

Fig 1
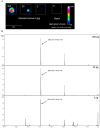
Fig 1. Analysis of SM (d18:1/16:0) standard by MALDI-FTICR-IMS.
(A) Visualization of [SM (d18:1/16:0) +K]+ at a range from 3–300 pg on an ITO glass slide. (B) Obtained mass spectra of [SM (d18:1/16:0) +K]+ (indicated with arrows) at a range from 3–300 pg on ITO glass slides. Scale bar = 5 mm. Data were obtained from three individual samples.
Fig 2
Fig 2. Localization of SM molecular species in the kidney sections of WT mice fed with a ND.
(A) Representative image of a kidney section stained with H&E. Renal Cx, Med, and pelvis (Pv) are divided with the broken lines. Representative images of (B) [SM (d18:1/16:0) +K]+, (C) [SM (d18:1/18:0) +K]+, (D) [SM (d18:1/18:1) +K]+, (E) [SM (d18:1/22:0) +K]+, (F) [SM (d18:1/24:0) +K]+, and (G) [SM (d18:1/24:1) +K]+ are shown. Scale bar = 1 mm. Data were obtained from two individuals.
Fig 3
Fig 3. Effects of SMS2 deficiency on SPLs metabolism in the liver of mice fed with a ND or a HFD.
Measurement by LC/ESI-MS/MS of (A) SMs and (B) Cers in whole-kidney extracts of mice fed with a ND or a HFD. The levels of SMs and Cers were normalized with internal standards, SM (d18:1/16:0-d31) and Cer (d18:1/16:0-d31), and expressed as μg per g tissue. The expression of (C) SMS, (D) CerS, and (E) Elovl mRNA in whole-kidney extracts. Expression of 18S rRNA was used as the endogenous reference for each sample. The expression level of each gene was shown as a value relative to that in WT mice fed with a ND. Data are means ± SEM; n = 3 per group. Significant differences compared with a corresponding value in WT mice are shown. *p < 0.05, **p < 0.01, two-way ANOVA followed by the post hoc Tukey-Kramer test.
Fig 4
Fig 4. Visualization of SM molecular species in the kidney sections of WT and SMS2-KO mice fed with a ND or a HFD.
(A) Representative optical images of kidney section obtained from each group of mice. Renal Cx, Med, and Pv are shown with broken lines. Representative images of (B) [SM (d18:1/16:0) +K]+, (C) [SM (d18:1/18:0) +K]+, (D) [SM (d18:1/22:0) +K]+, (E) [SM (d18:1/24:0) +K]+, and (F) [SM (d18:1/24:1) +K]+ are shown. Scale bar = 2 mm. Data were obtained from three individuals per group.

References

    1. Stoeckli M, Chaurand P, Hallahan DE. Caprioli RM. Imaging mass spectrometry: a new technology for the analysis of protein expression in mammalian tissues. Nat Med. 2001;7: 493–496. - PubMed
    1. Powers TW, Jones EE, Betesh LR, Romano PR, Gao P, Copland JA, et al. Matrix assisted laser desorption ionization imaging mass spectrometry workflow for spatial profiling analysis of N-linked glycan expression in tissues. Anal Chem. 2013;85: 9799–9806. 10.1021/ac402108x - DOI - PMC - PubMed
    1. Irie M, Fujimura Y, Yamato M, Miura D, Wariishi H. Integrated MALDI-MS imaging and LC-MS techniques for visualizing spatiotemporal metabolomic dynamics in a rat stroke model. Metabolomics. 2014;10: 473–483. - PMC - PubMed
    1. Goto-Inoue N, Hayasaka T, Zaima N, Setou M. Imaging mass spectrometry for lipidomics. Biochim Biophys Acta. 2011;1811: 961–969. 10.1016/j.bbalip.2011.03.004 - DOI - PubMed
    1. Masaki Y, Shimizu Y, Yoshioka T, Tanaka Y, Nishijima K, Zhao S, et al. The accumulation mechanism of the hypoxia imaging probe "FMISO" by imaging mass spectrometry: possible involvement of low-molecular metabolites. Sci Rep. 2015;5: 16802 10.1038/srep16802 - DOI - PMC - PubMed

Publication types

MeSH terms