. 2015 Oct 22;2(4):392-400.
doi: 10.1093/jhps/hnv063. eCollection 2015 Dec.

Measurement of lateral acetabular coverage: a comparison between CT and plain radiography

Affiliations

Measurement of lateral acetabular coverage: a comparison between CT and plain radiography

Vivek Chadayammuri et al. J Hip Preserv Surg. .

Abstract

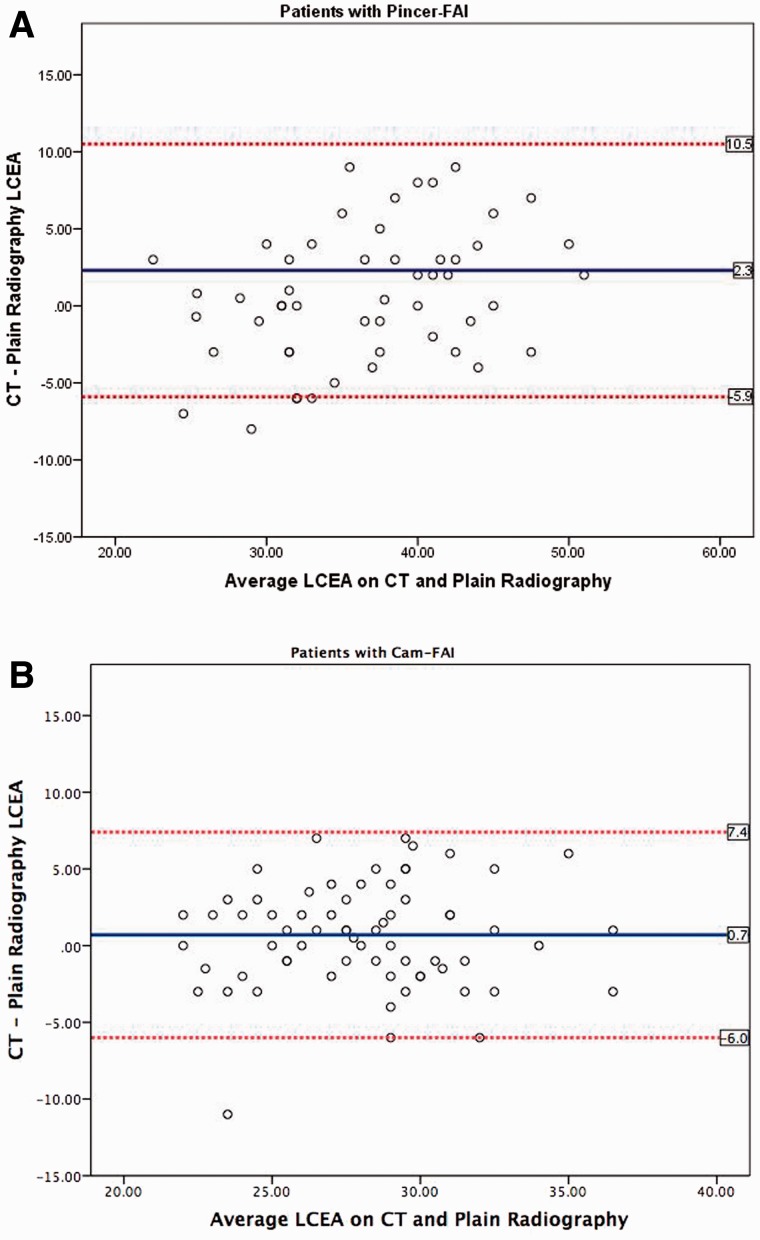
We prospectively evaluated the degree of absolute agreement between measurements of lateral center-edge angle (LCEA) on plain radiography (XR) and computed tomography (CT) in a consecutive cohort of 205 patients (410 hips) undergoing hip arthroscopy. Preoperative measurements of the LCEA were performed bilaterally utilizing standardized anteroposterior radiographs and coronal reformatted CT scans. Demographic variables including age, gender, height, weight, BMI and clinical diagnosis were recorded for all patients. Overall, measured values of the LCEA were 2.1° larger on CT compared with XR (32.9° versus 30.8°, P < 0.001). Subgroup analysis revealed the highest mean difference in hips with acetabular dysplasia and concomitant cam-type femoroacetabular impingement (FAI) [mean difference (CT-XR) 5.5°, 95% confidence interval (CI) 3.7°-7.3°, P = 0.011], followed by hips with isolated acetabular dysplasia (mean difference [CT-XR] 4.9°, 95% CI 2.7°-7.0°, P < 0.001). In contrast, 119 (29.0%) of the hips demonstrated larger measurements of the LCEA on 25 XR relative to CT. Of these hips, 20 (16.8%) had pincer-FAI and 25 had cam-FAI (21.0%), representing a significantly higher proportion compared with all other clinical subgroups (P = 0.045 and 0.036, respectively). Our study demonstrates measured values of the LCEA are consistently inflated on CT relative to XR for a wide variety of hip pathologies, highlighting the need for standardization and validation of CT-based measurements to improve the quality of clinical decision making.

Level of evidence: Diagnostic Level II.


Figures

Fig. 1.
Fig. 1.
Bland–Altman plots depicting the variability of measurements of LCEA on plain radiography versus CT in patients with (A) pincer-FAI and (B) cam-FAI. The mean difference between measurements of LCEA on CT and plain radiography (blue line) is nearly 0; however, plotting of the data reveals a relatively even spread of measurements that were greater on plain radiography compared with CT. This is in contrast to the trend observed for all other clinical subgroups, in which measurement of LCEA was uniformly inflated on CT relative to plain radiography.
Fig. 2.
Fig. 2.
Representative example of lateral acetabular dysplasia. The measured LCEA is (A) 20° on AP pelvic radiography, compared with (B) 24° on coronal CT. These measurements confer a clinical diagnosis of frank hip dysplasia and borderline hip dysplasia, respectively—a discrepancy that could alter the course of operative treatment.
Fig. 3.
Fig. 3.
Representative example in borderline dysplastic hip. (A) Coronal MRI of the left hip shows the attachment point of the labrum to the lateral margin of the acetabular roof. (B) Measurement of the LCEA (of Ogata) yields a value of 23° when using a terminal endpoint at the weight-bearing area of the acetabulum that, as seen by the MRI, is located at the medial base of the labrum. (C) Measurement of the LCEA (of Wiberg) on coronal CT involves a terminal endpoint located at the far lateral acetabular rim, yielding a value of 30°. (D) Measurement of the LCEA on plain radiography using a technique analogous to that performed on coronal CT. The difference between LCEA measurements in panels B and D is attributable to a bony area which functions as the labral base but does not come into contact with the femoral head and thus does not contribute directly to the acetabular coverage.
Fig. 4.
Fig. 4.
Potential challenges associated with measurement of LCEA in dysplastic hips. (A) AP pelvic radiograph of the left hip; (B) measurement of the LCEA with a terminal endpoint at the intersection of acetabular rim and anterior acetabular wall yields a value of 18°, indicating acetabular dysplasia, (C) while measurement with a terminal endpoint at (what seems to be) the lateral rim yields a value of 30°; (D, E) 3D CT enables superior visualization of bony morphology. Note that the lateral border of the anterior inferior iliac spine landmark should be positioned at 1 o’clock to ensure measurement of the LCEA to the true anterolateral rim (yellow) at the 12 o’clock position. Failure to do so can potentially result in erroneous measurement of the LCEA with an endpoint on the posterior acetabular wall that does not contribute to anterolateral coverage (red). Corresponding measurement on coronal CT views are shown in panels (F) and (G).

References

    1. Wiberg G. Studies on dysplastic acetabulum and congenital subluxation of the hip joint with special reference to the complications of osteoarthritis. Acta Chir Scand 1939; 83(Suppl. 58): 1–135.
    1. Tannast M, Siebenrock KA, Anderson SE. Femoroacetabular impingement: radiographic diagnosis—what the radiologist should know. AJR Am J Roentgenol 2007; 188: 1540–52. - PubMed
    1. Clohisy JC, Carlisle JC, Beaule PE, et al. A systematic approach to the plain radiographic evaluation of the young adult hip. J Bone Joint Surg Am 2008; 90(Suppl. 4): 47–66. - PMC - PubMed
    1. Jesse MK, Petersen B, Strickland C, et al. Normal anatomy and imaging of the hip: emphasis on impingement assessment. Semin Musculoskelet Radiol 2013; 17: 229–47. - PubMed
    1. Matsuda DK, Khatod M. Rapidly progressive osteoarthritis after arthroscopic labral repair in patients with hip dysplasia. Arthroscopy 2012; 28: 1738–43. - PubMed