. 2013 Dec;2(4):215-226.
doi: 10.1016/j.jshs.2013.07.001.

Human neuromuscular structure and function in old age: A brief review

Affiliations

Human neuromuscular structure and function in old age: A brief review

Geoffrey A Power et al. J Sport Health Sci. 2013 Dec.

Abstract

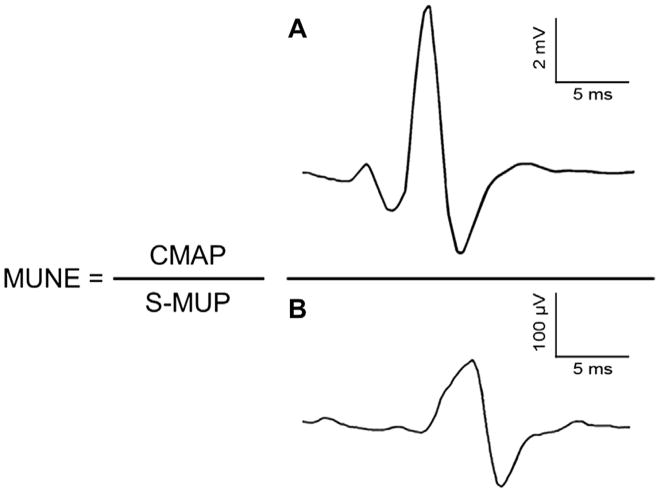
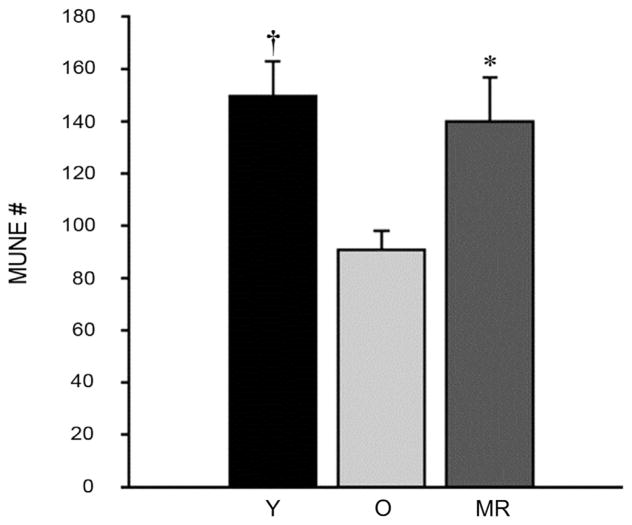
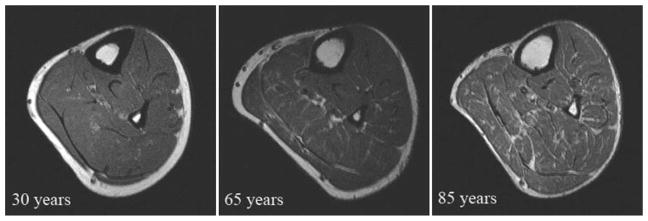
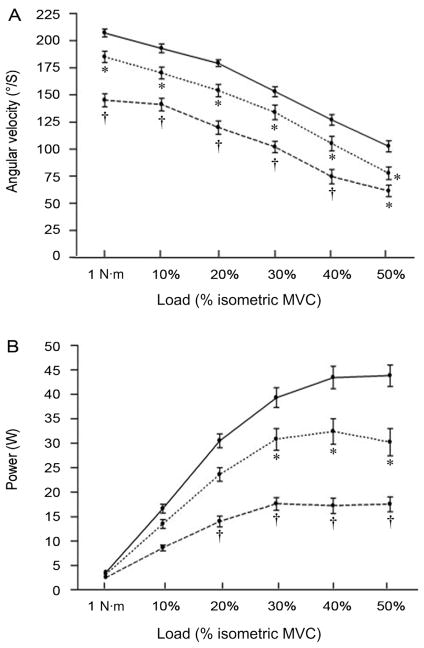
Natural adult aging is associated with many functional impairments of the human neuromuscular system. One of the more observable alterations is the loss of contractile muscle mass, termed sarcopenia. The loss of muscle mass occurs primarily due to a progressive loss of viable motor units, and accompanying atrophy of remaining muscle fibers. Not only does the loss of muscle mass contribute to impaired function in old age, but alterations in fiber type and myosin heavy chain isoform expression also contribute to weaker, slower, and less powerful contracting muscles. This review will focus on motor unit loss associated with natural adult aging, age-related fatigability, and the age-related differences in strength across contractile muscle actions.

Keywords: Aging; Eccentric; Force; Motor unit; Muscle atrophy; Power; Residual force enhancement; Sarcopenia; Velocity.


Figures

Fig. 1
Fig. 1
Formula used in calculating a motor unit number estimate (MUNE). The compound muscle action potential (CMAP, sum of electrical contribution of all motor units) is divided by the average surface detected motor unit potential (S-MUP, sample of motor unit potentials representing the average electrical size of the constituent units) to derive a MUNE. Panel A is a representative CMAP and Panel B is a representative S-MUP.
Fig. 2
Fig. 2
Motor unit number estimates (MUNE) in masters athletes and old men. MUNE did not differ between masters runners (MR, ~65 years) and young men (Y, ~25 years), but were higher in MR than old men (O, ~65 years), and less in O compared with Y. Values are presented as mean ± SE. *Significant difference between MR and O. Significant difference between Y and O. Adapted with permission from Ref. .
Fig. 3
Fig. 3
Axial magnetic resonance images of the right leg from a young (30 years), old (65 years), and very old (85 years) man. Note the smaller amount of infiltration of non-contractile tissue in legs of those 65 years of age but it is not until the very old age (85 years) when a significant overall loss of muscle mass is evident including more infiltration. Adapted with permission from Ref. .
Fig. 4
Fig. 4
Comparison of angular velocity (A) and velocity-dependent power (B) at 1 nm and different submaximal loads normalized to a relative percentage of maximum voluntary contraction (MVC) in young (~25 years; solid line), old (~65 years; dotted line), and very old (~80 years; dashed line) men for the ankle dorsiflexors. Values are means ± SE. Old men were slower than young men at all loads but 30% maximal voluntary contraction (MVC) (*p < 0.05). Very old men were slower than young men at 50% MVC (*p < 0.05) and slower than both young and old men at all other loads (p < 0.05). Old men generated less power than young men at 30%, 40%, and 50% MVC (*p < 0.05). Very old men generated less power than both young and old men at 20%, 30%, 40%, and 50% MVC (p < 0.05). Adapted with permission from Ref. .
Fig. 5
Fig. 5
Fatigue response of peak power (squares) and isometric maximum voluntary contraction (MVC, bars). *Age-related difference between the old (open) and young (filled) men (p < 0.05). Difference from C 1–20 for peak power and a difference from baseline for MVC (p < 0.01). C represents dynamic contraction number. Values are means ± SE. Duration between C 25 and C 26 was ~15 s and time between C 50 and End MVC was ~5 s. Adapted with permission from Ref. .
Fig. 6
Fig. 6
Raw data depicting the determination of residual force enhancement (RFE) in an old adult (77 years). PFE, passive force enhancement; MVC, maximum voluntary isometric contraction. Adapted with permission from Ref. .

References

    1. Manini TM, Hong SL, Clark BC. Aging and muscle: a neuron’s perspective. Curr Opin Clin Nutr Metab Care. 2013;16:21–6. - PMC - PubMed
    1. Aagaard P, Suetta C, Caserotti P, Magnusson SP, Kjaer M. Role of the nervous system in sarcopenia and muscle atrophy with aging: strength training as a countermeasure. Scand J Med Sci Sports. 2010;20:49–64. - PubMed
    1. Doherty TJ. Invited review: aging and sarcopenia. J Appl Physiol. 2003;95:1717–27. - PubMed
    1. Narici MV, Maffulli N. Sarcopenia: characteristics, mechanisms and functional significance. Br Med Bull. 2010;95:139–59. - PubMed
    1. Deschenes MR. Motor unit and neuromuscular junction remodeling with aging. Curr Aging Sci. 2011;4:209–20. - PubMed

LinkOut - more resources