

Saturated and Unsaturated Dietary Fats Differentially Modulate Ethanol-Induced Changes in Gut Microbiome and Metabolome in a Mouse Model of Alcoholic Liver Disease
- PMID: 27012191
- PMCID: PMC5808146
- DOI: 10.1016/j.ajpath.2015.11.017
Saturated and Unsaturated Dietary Fats Differentially Modulate Ethanol-Induced Changes in Gut Microbiome and Metabolome in a Mouse Model of Alcoholic Liver Disease
Abstract
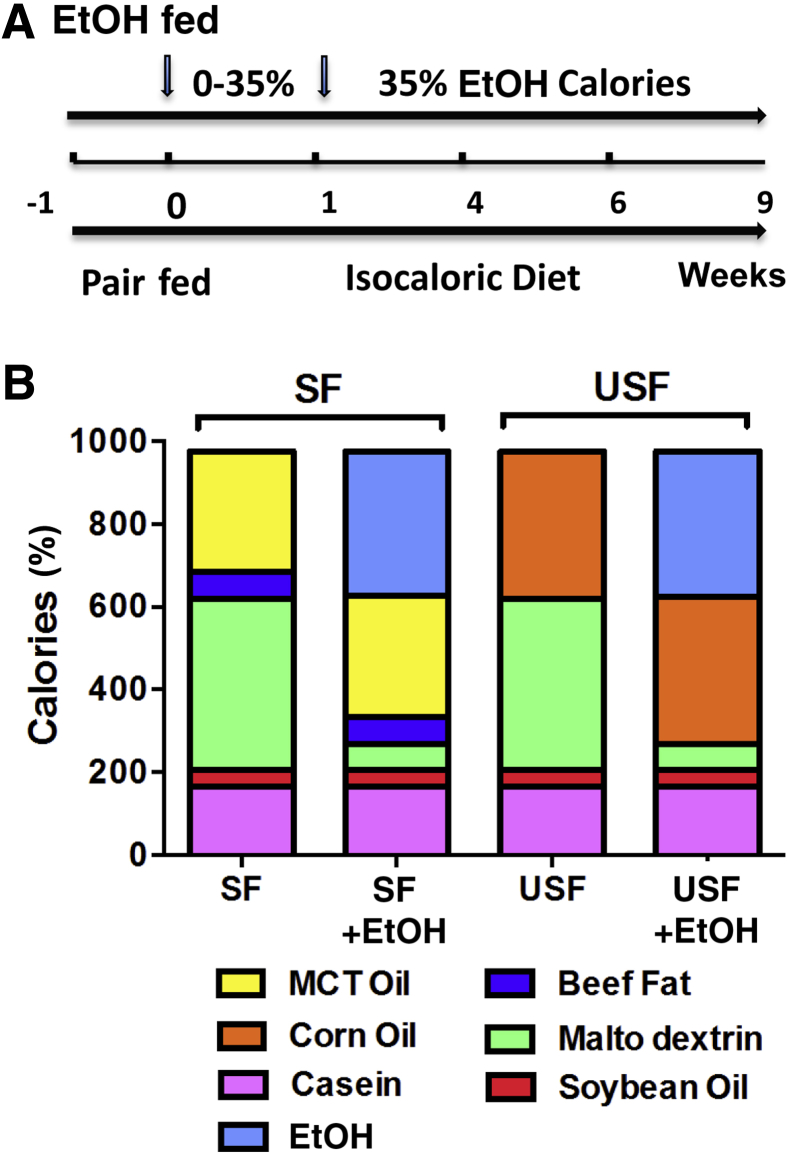
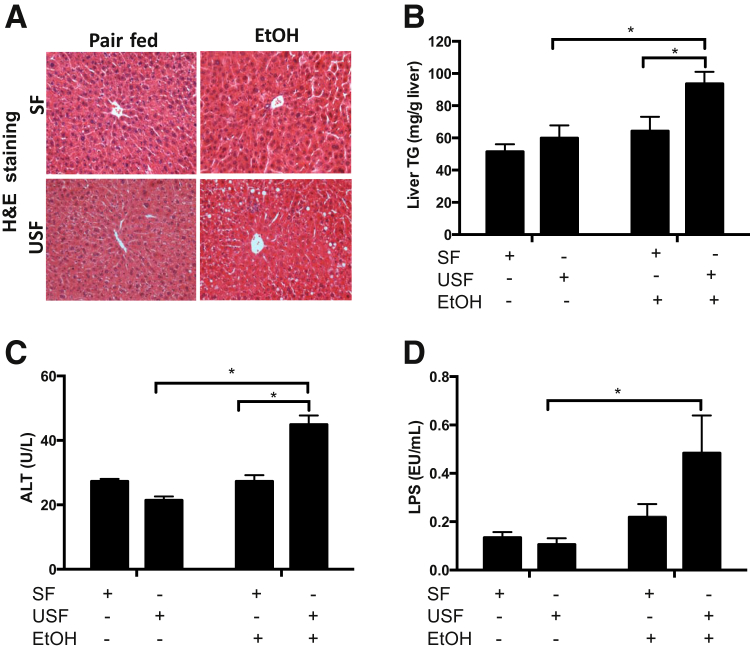
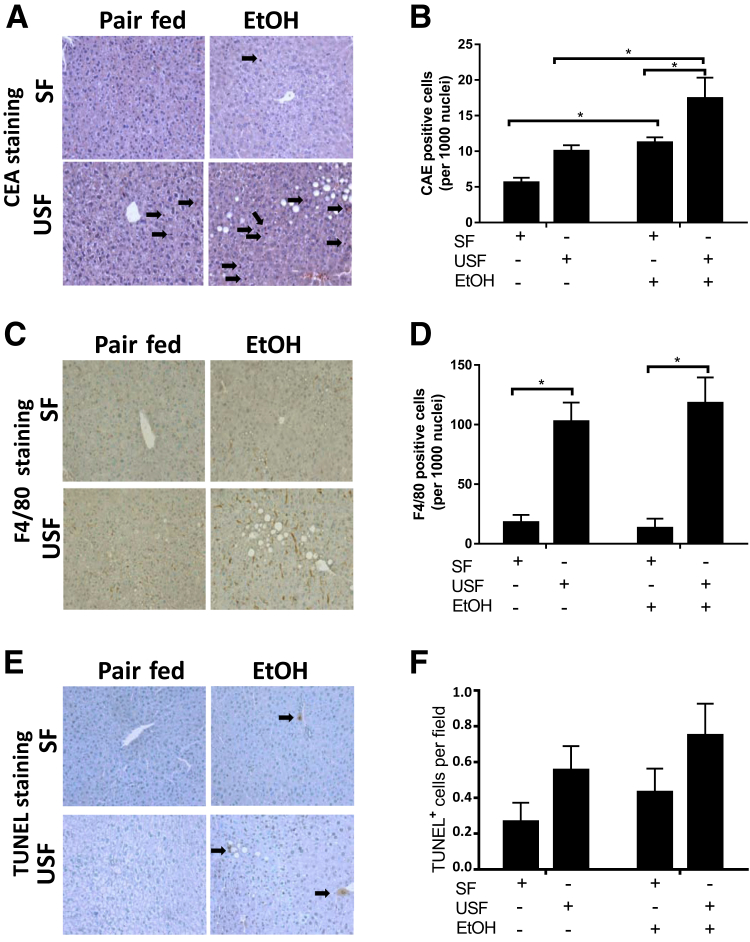
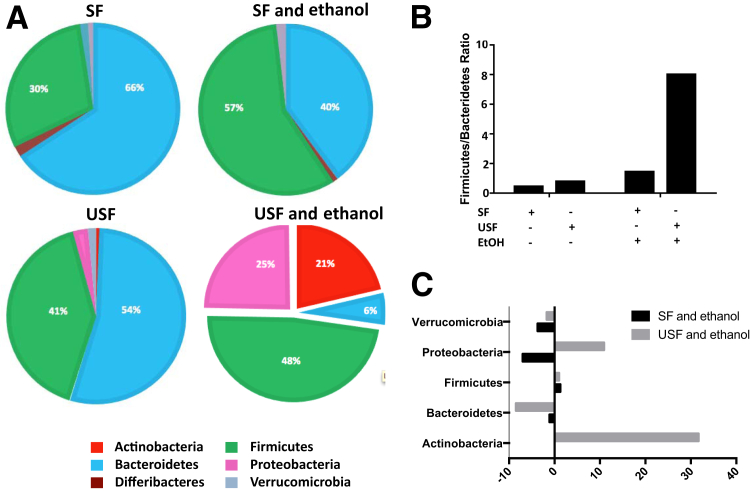
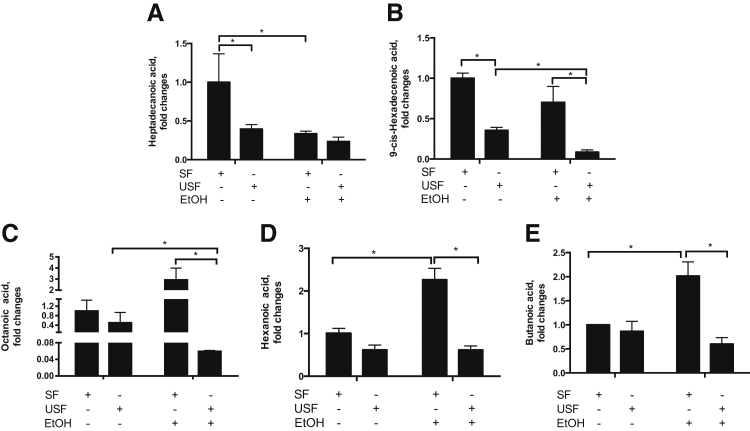
Alcoholic liver disease (ALD) ranks among major causes of morbidity and mortality. Diet and crosstalk between the gut and liver are important determinants of ALD. We evaluated the effects of different types of dietary fat and ethanol on the gut microbiota composition and metabolic activity and the effect of these changes on liver injury in ALD. Compared with ethanol and a saturated fat diet (medium chain triglycerides enriched), an unsaturated fat diet (corn oil enriched) exacerbated ethanol-induced endotoxemia, liver steatosis, and injury. Major alterations in gut microbiota, including a reduction in Bacteroidetes and an increase in Proteobacteria and Actinobacteria, were seen in animals fed an unsaturated fat diet and ethanol but not a saturated fat diet and ethanol. Compared with a saturated fat diet and ethanol, an unsaturated fat diet and ethanol caused major fecal metabolomic changes. Moreover, a decrease in certain fecal amino acids was noted in both alcohol-fed groups. These data support an important role of dietary lipids in ALD pathogenesis and provide insight into mechanisms of ALD development. A diet enriched in unsaturated fats enhanced alcohol-induced liver injury and caused major fecal metagenomic and metabolomic changes that may play an etiologic role in observed liver injury. Dietary lipids can potentially serve as inexpensive interventions for the prevention and treatment of ALD.
Copyright © 2016 American Society for Investigative Pathology. Published by Elsevier Inc. All rights reserved.
Figures
Similar articles
-
Alcoholic Liver Disease: Update on the Role of Dietary Fat.Biomolecules. 2016 Jan 6;6(1):1. doi: 10.3390/biom6010001. Biomolecules. 2016. PMID: 26751488 Free PMC article. Review.
-
The type of dietary fat modulates intestinal tight junction integrity, gut permeability, and hepatic toll-like receptor expression in a mouse model of alcoholic liver disease.Alcohol Clin Exp Res. 2012 May;36(5):835-46. doi: 10.1111/j.1530-0277.2011.01673.x. Epub 2011 Dec 7. Alcohol Clin Exp Res. 2012. PMID: 22150547 Free PMC article.
-
Flaxseed oil ameliorates alcoholic liver disease via anti-inflammation and modulating gut microbiota in mice.Lipids Health Dis. 2017 Feb 22;16(1):44. doi: 10.1186/s12944-017-0431-8. Lipids Health Dis. 2017. PMID: 28228158 Free PMC article.
-
Dietary fat sources differentially modulate intestinal barrier and hepatic inflammation in alcohol-induced liver injury in rats.Am J Physiol Gastrointest Liver Physiol. 2013 Dec;305(12):G919-32. doi: 10.1152/ajpgi.00226.2013. Epub 2013 Oct 10. Am J Physiol Gastrointest Liver Physiol. 2013. PMID: 24113767 Free PMC article.
-
Alcoholic liver disease: the gut microbiome and liver cross talk.Alcohol Clin Exp Res. 2015 May;39(5):763-75. doi: 10.1111/acer.12704. Alcohol Clin Exp Res. 2015. PMID: 25872593 Free PMC article. Review.
Cited by
-
Ethanol and unsaturated dietary fat induce unique patterns of hepatic ω-6 and ω-3 PUFA oxylipins in a mouse model of alcoholic liver disease.PLoS One. 2018 Sep 26;13(9):e0204119. doi: 10.1371/journal.pone.0204119. eCollection 2018. PLoS One. 2018. PMID: 30256818 Free PMC article.
-
High-Fat Diet Augments the Effect of Alcohol on Skeletal Muscle Mitochondrial Dysfunction in Mice.Nutrients. 2022 Feb 28;14(5):1016. doi: 10.3390/nu14051016. Nutrients. 2022. PMID: 35267991 Free PMC article.
-
Vinyl Chloride and High-Fat Diet as a Model of Environment and Obesity Interaction.J Vis Exp. 2020 Jan 12;(155):10.3791/60351. doi: 10.3791/60351. J Vis Exp. 2020. PMID: 31984951 Free PMC article.
-
Gut-liver axis: Recent concepts in pathophysiology in alcohol-associated liver disease.Hepatology. 2024 Dec 1;80(6):1342-1371. doi: 10.1097/HEP.0000000000000924. Epub 2024 May 1. Hepatology. 2024. PMID: 38691396 Review.
-
Guidelines and considerations for the use of system suitability and quality control samples in mass spectrometry assays applied in untargeted clinical metabolomic studies.Metabolomics. 2018;14(6):72. doi: 10.1007/s11306-018-1367-3. Epub 2018 May 18. Metabolomics. 2018. PMID: 29805336 Free PMC article. Review.
References
-
- McClain C.M., Carithers R.L. Alcoholic liver disease. In: Feldman M., Friedman L., Brandt L., editors. Sleisenger and Fordtran's Gastrointestinal and Liver Disease Pathophysiology/Diagnosis/Management. ed 8. Saunders Elsevier; Canada: 2006. pp. 1771–1792.
-
- D'Amico G., Garcia-Tsao G., Pagliaro L. Natural history and prognostic indicators of survival in cirrhosis: a systematic review of 118 studies. J Hepatol. 2006;44:217–231. - PubMed
-
- Wakim-Fleming J., Mullen K.D. Long-term management of alcoholic liver disease. Clin Liver Dis. 2005;9:135–149. - PubMed
Publication types
MeSH terms
Substances
Grants and funding
- R03 DK107912/DK/NIDDK NIH HHS/United States
- U01 AA021893/AA/NIAAA NIH HHS/United States
- U01 AA021901/AA/NIAAA NIH HHS/United States
- P20 GM113226/GM/NIGMS NIH HHS/United States
- R01AA023681/AA/NIAAA NIH HHS/United States
- P50 AA024337/AA/NIAAA NIH HHS/United States
- R21 AA020849-01A1/AA/NIAAA NIH HHS/United States
- R01 AA018869/AA/NIAAA NIH HHS/United States
- U01AA022489/AA/NIAAA NIH HHS/United States
- 1U01AA021901-01/AA/NIAAA NIH HHS/United States
- 1U01AA021893-01/AA/NIAAA NIH HHS/United States
- R21 AA020849/AA/NIAAA NIH HHS/United States
- R01 AA023681/AA/NIAAA NIH HHS/United States
- U01 AA022489/AA/NIAAA NIH HHS/United States
- R01AA018869/AA/NIAAA NIH HHS/United States
- R21 AA022416/AA/NIAAA NIH HHS/United States
- I01 BX000350/BX/BLRD VA/United States
- R01 AA024405/AA/NIAAA NIH HHS/United States
LinkOut - more resources
Full Text Sources
Other Literature Sources
Medical
