

Pathologic electrographic changes after experimental traumatic brain injury
- PMID: 27012461
- PMCID: PMC5081251
- DOI: 10.1111/epi.13359
Pathologic electrographic changes after experimental traumatic brain injury
Abstract
Objective: To investigate possible electroencephalography (EEG) correlates of epileptogenesis after traumatic brain injury (TBI) using the fluid percussion model.
Methods: Experiments were conducted on adult 2- to 4-month-old male Sprague-Dawley rats. Two groups of animals were studied: (1) the TBI group with depth and screw electrodes implanted immediately after the fluid percussion injury (FPI) procedure, and (2) a naive age-matched control group with the same electrode implantation montage. Pairs of tungsten microelectrodes (50 μm outer diameter) and screw electrodes were implanted in neocortex inside the TBI core, areas adjacent to TBI, and remote areas. EEG activity, recorded on the day of FPI, and continuously for 2 weeks, was analyzed for possible electrographic biomarkers of epileptogenesis. Video-EEG monitoring was also performed continuously in the TBI group to capture electrographic and behavioral seizures until the caps came off (28-189 days), and for 1 week, at 2, 3, and 6 months of age, in the control group.
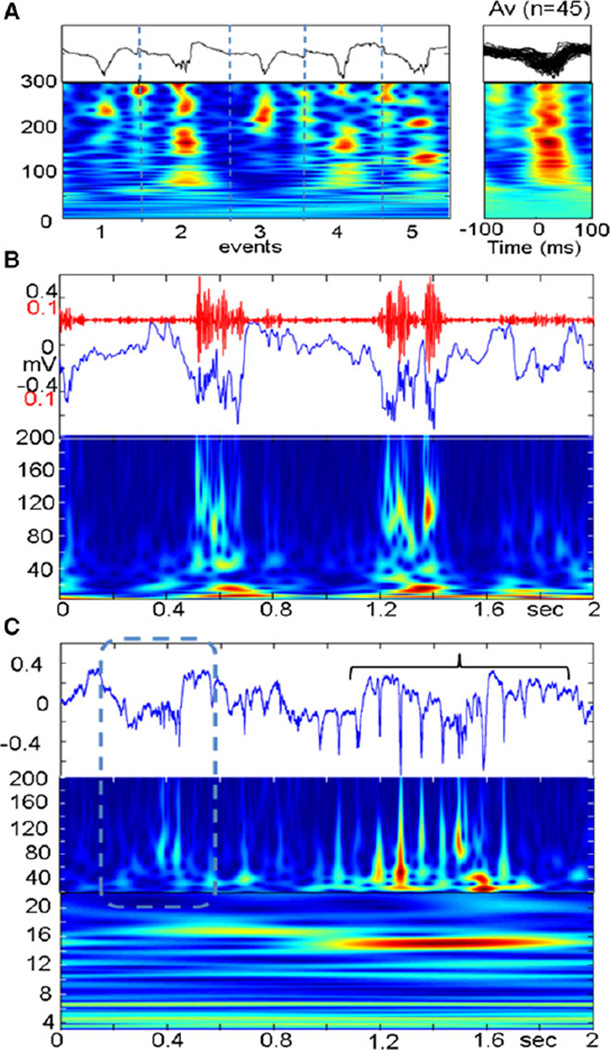
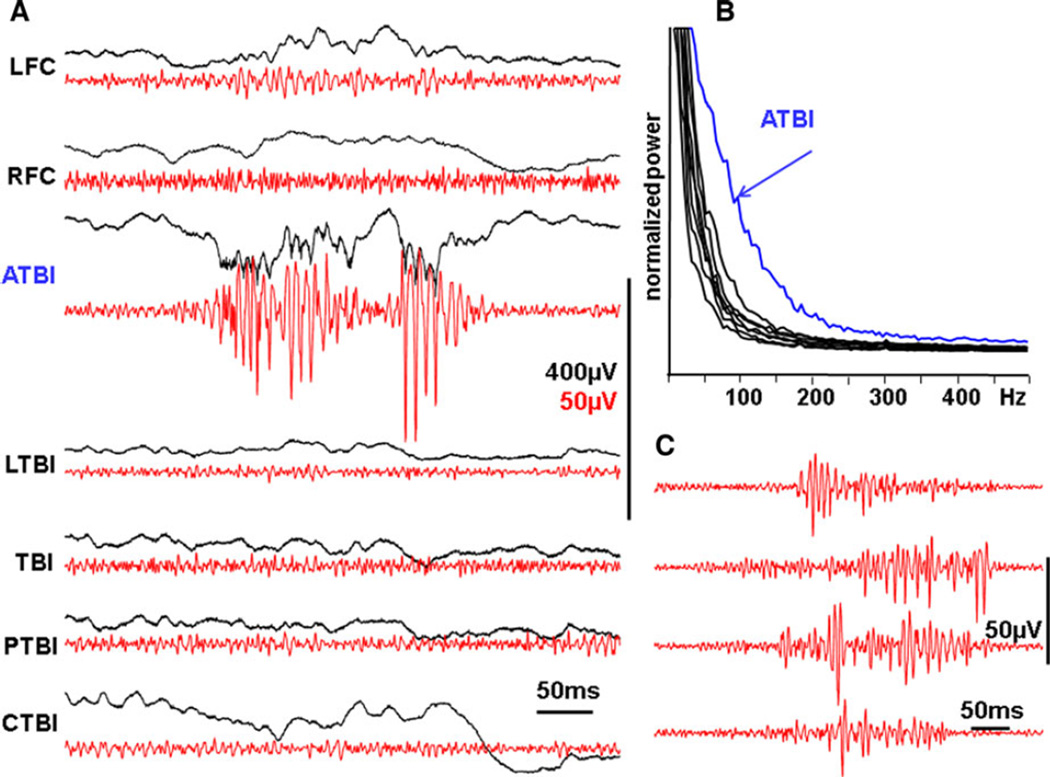
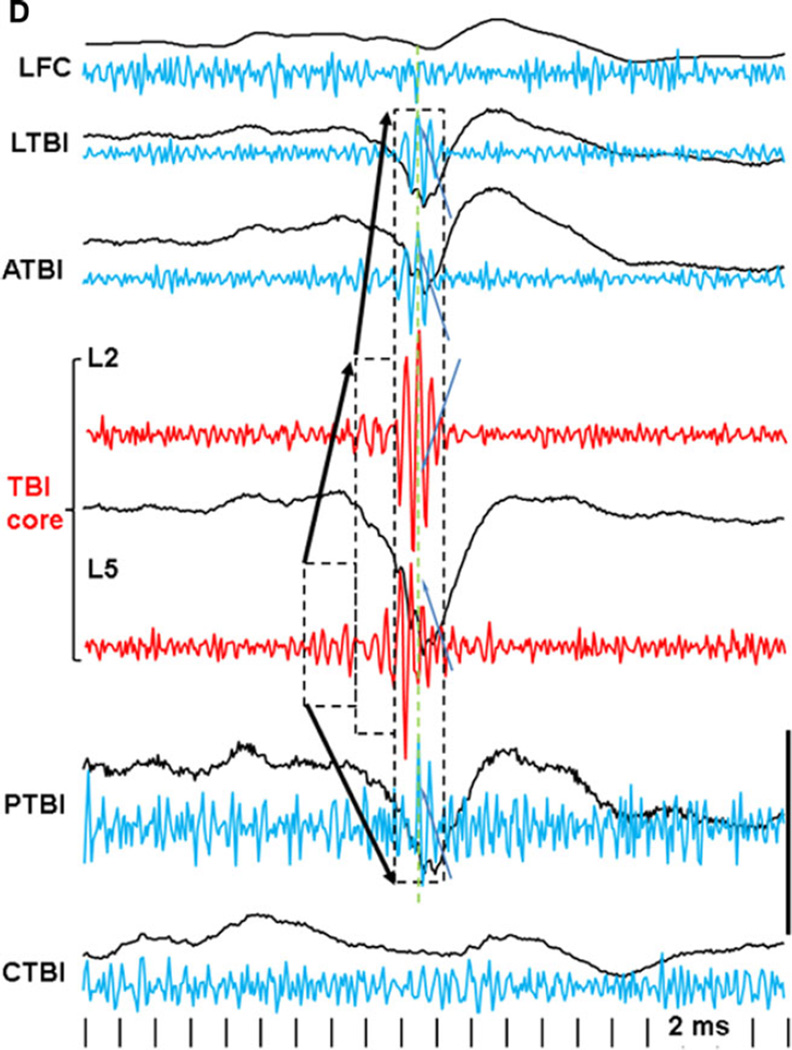
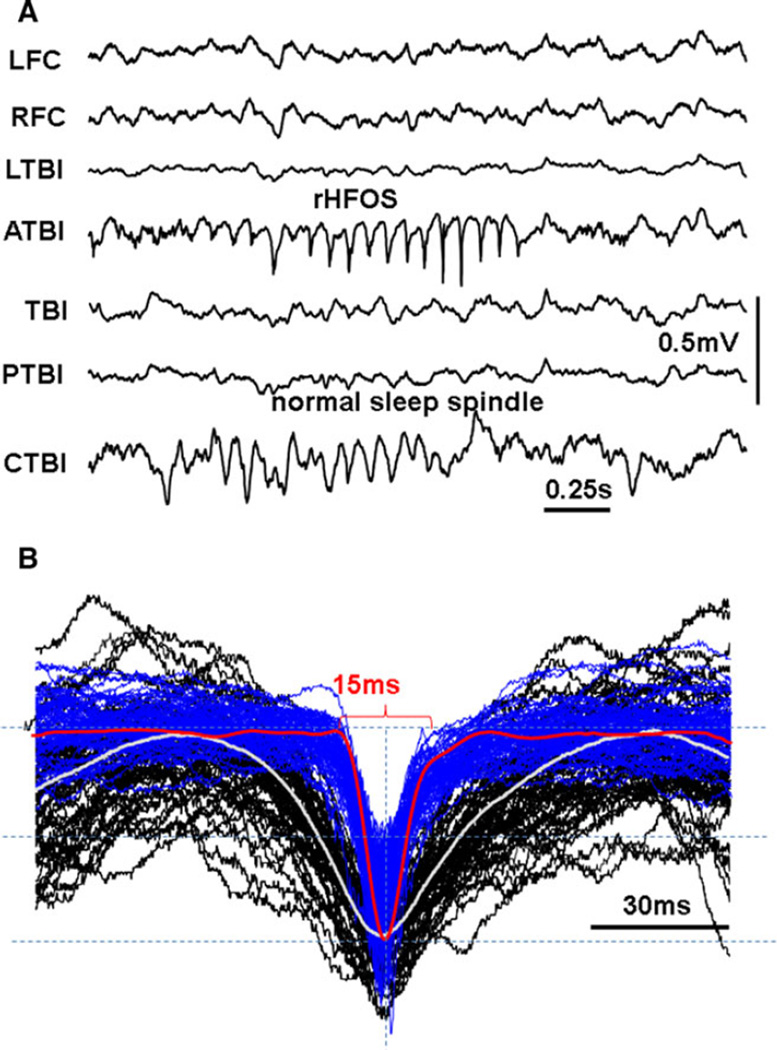
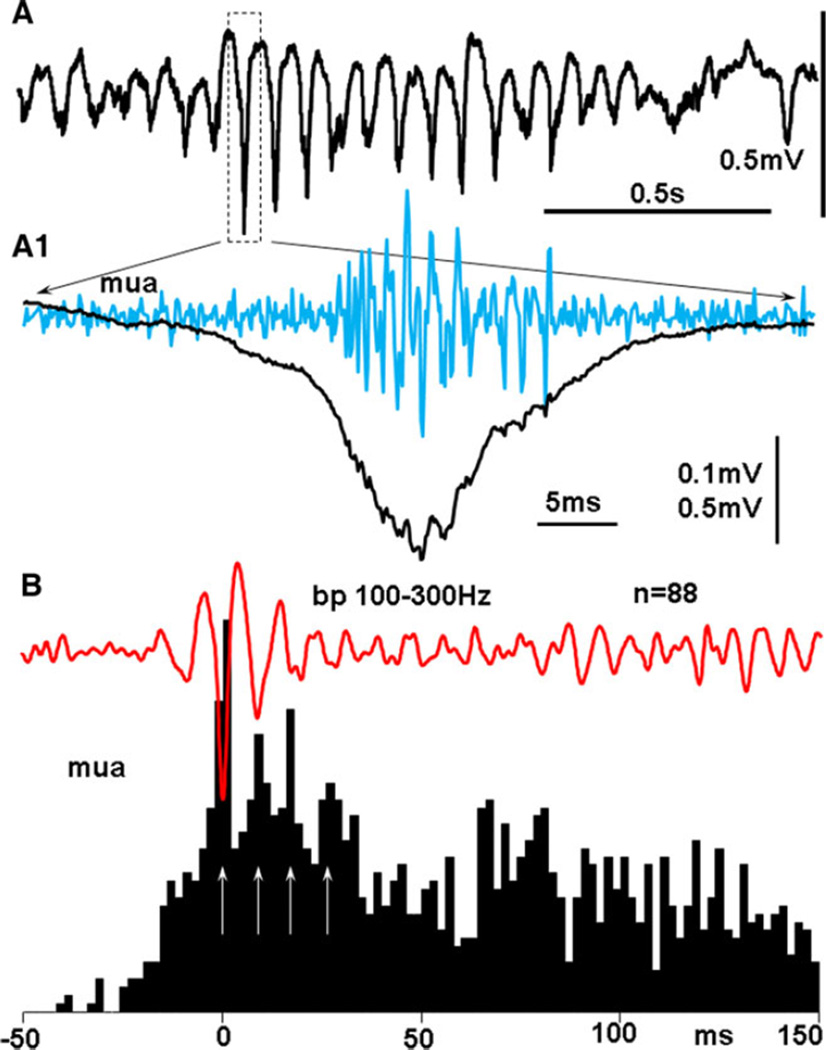
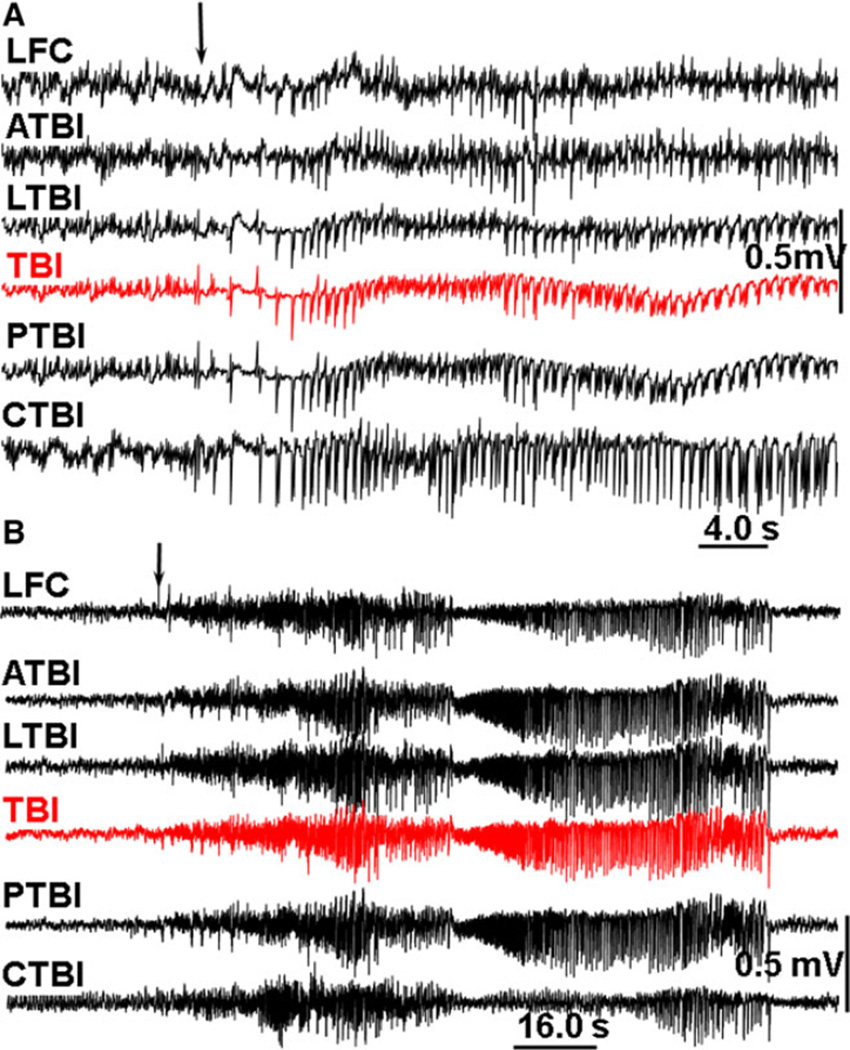
Results: Pathologic high-frequency oscillations (pHFOs) with a central frequency between 100 and 600 Hz, were recorded from microelectrodes, beginning during the first two post-FPI weeks, in 7 of 12 animals in the TBI group (58%) and never in the controls. pHFOs only occurred in cortical areas within or adjacent to the TBI core. These were associated with synchronous multiunit discharges and popSpikes, duration 15-40 msec. Repetitive pHFOs and EEG spikes (rHFOSs) formed paroxysmal activity, with a unique arcuate pattern, in the frequency band 10-16 Hz in the same areas as isolated pHFOs, and these events were also recorded by screw electrodes. Although loss of caps prevented long-term recordings from all rats, pHFOs and rHFOSs occurred during the first 2 weeks in all four animals that later developed seizures, and none of the rats without these events developed late seizures.
Significance: pHFOs, similar to those associated with epileptogenesis in the status rat model of epilepsy, may also reflect epileptogenesis after FPI. rHFOSs could be noninvasive biomarkers of epileptogenesis.
Keywords: Electroencephalography; Epileptogenesis; Pathologic high frequency oscillations; Repetitive HFOs and spikes; Seizure; Spindles; Traumatic brain injury.
Wiley Periodicals, Inc. © 2016 International League Against Epilepsy.
Conflict of interest statement
None of the authors has any conflicts of interests to disclosure. We confirm that we have read the Journal’s position on issues involved in ethical publication and affirm that this report is consistent with those guidelines.
Figures
References
-
- Kharatishvili I, Pitkanen A. Posttraumatic epilepsy. Curr Opin Neurol. 2010;23:183–188. - PubMed
-
- Giza CC. Post-traumatic epileptogenesis: good and bad plasticity. In: Rho JMSR, Stafstrom CE, editors. Epilepsy: mechanisms, models and translational perspectives. Boca Raton, FL: CRC Press, Taylor and Francis Group LLC; 2010. pp. 181–208.
-
- Harrison-Felix C, Whiteneck G, Devivo MJ, et al. Causes of death following 1 year postinjury among individuals with traumatic brain injury. J Head Trauma Rehabil. 2006;21:22–33. - PubMed
Publication types
MeSH terms
Grants and funding
LinkOut - more resources
Full Text Sources
Other Literature Sources
Medical
Miscellaneous
