

Single subject prediction of brain disorders in neuroimaging: Promises and pitfalls
- PMID: 27012503
- PMCID: PMC5031516
- DOI: 10.1016/j.neuroimage.2016.02.079
Single subject prediction of brain disorders in neuroimaging: Promises and pitfalls
Abstract
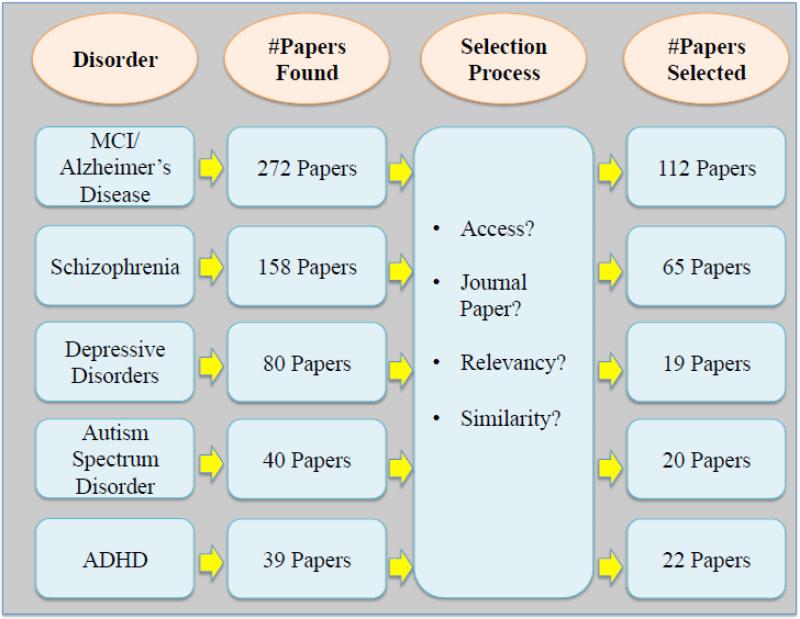
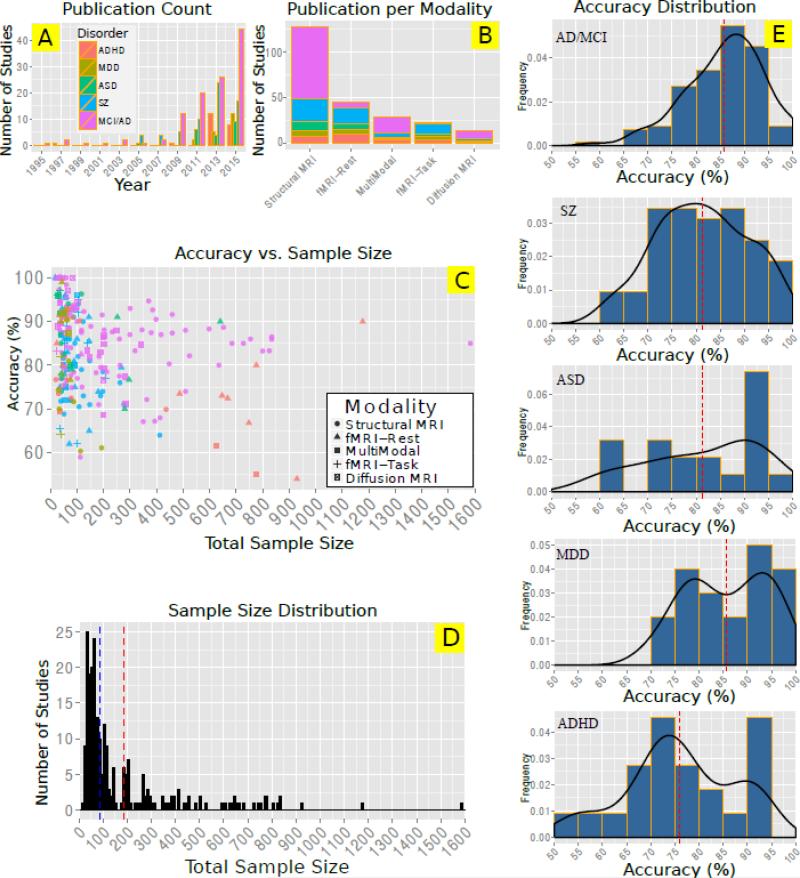
Neuroimaging-based single subject prediction of brain disorders has gained increasing attention in recent years. Using a variety of neuroimaging modalities such as structural, functional and diffusion MRI, along with machine learning techniques, hundreds of studies have been carried out for accurate classification of patients with heterogeneous mental and neurodegenerative disorders such as schizophrenia and Alzheimer's disease. More than 500 studies have been published during the past quarter century on single subject prediction focused on a multiple brain disorders. In the first part of this study, we provide a survey of more than 200 reports in this field with a focus on schizophrenia, mild cognitive impairment (MCI), Alzheimer's disease (AD), depressive disorders, autism spectrum disease (ASD) and attention-deficit hyperactivity disorder (ADHD). Detailed information about those studies such as sample size, type and number of extracted features and reported accuracy are summarized and discussed. To our knowledge, this is by far the most comprehensive review of neuroimaging-based single subject prediction of brain disorders. In the second part, we present our opinion on major pitfalls of those studies from a machine learning point of view. Common biases are discussed and suggestions are provided. Moreover, emerging trends such as decentralized data sharing, multimodal brain imaging, differential diagnosis, disease subtype classification and deep learning are also discussed. Based on this survey, there is extensive evidence showing the great potential of neuroimaging data for single subject prediction of various disorders. However, the main bottleneck of this exciting field is still the limited sample size, which could be potentially addressed by modern data sharing models such as the ones discussed in this paper. Emerging big data technologies and advanced data-intensive machine learning methodologies such as deep learning have coincided with an increasing need for accurate, robust and generalizable single subject prediction of brain disorders during an exciting time. In this report, we survey the past and offer some opinions regarding the road ahead.
Keywords: Brain disorders; Classification; Machine learning; Neuroimaging; Prediction.
Copyright © 2016 Elsevier Inc. All rights reserved.
Figures
References
-
- Adaszewski S, Dukart J, Kherif F, Frackowiak R, Draganski B. How early can we predict Alzheimer's disease using computational anatomy? Neurobiol. Aging. 2013;34:2815–2826. doi: 10.1016/j.neurobiolaging.2013.06.015. - PubMed
-
- Aguilar C, Westman E, Muehlboeck J-S, Mecocci P, Vellas B, Tsolaki M, Kloszewska I, Soininen FL, Lovestone S, Spenger C, Simmons A, Wahlund L-O. Different multivariate techniques for automated classification of MRI data in Alzheimer's disease and mild cognitive impairment. Psychiatry Res. 2013;212:89–98. doi: 10.1016/j.pscychresns.2012.11.005. - PubMed
-
- Akshoomoff N, Lord C, Lincoln AJ, Courchesne RY, Carper RA, Townsend J, Courchesne E. Outcome classification of preschool children with autism spectrum disorders using MRI brain measures. J Am Acad Child Adolesc Psychiatry. 2004;43:349–357. doi:10.1097/00004583-200403000-00018. - PubMed
Publication types
MeSH terms
Grants and funding
LinkOut - more resources
Full Text Sources
Other Literature Sources
Medical
Miscellaneous
