. 2016 Apr 1;30(7):786-97.
doi: 10.1101/gad.274167.115. Epub 2016 Mar 24.

The LATS2 tumor suppressor inhibits SREBP and suppresses hepatic cholesterol accumulation

Affiliations

The LATS2 tumor suppressor inhibits SREBP and suppresses hepatic cholesterol accumulation

Yael Aylon et al. Genes Dev. .

Abstract

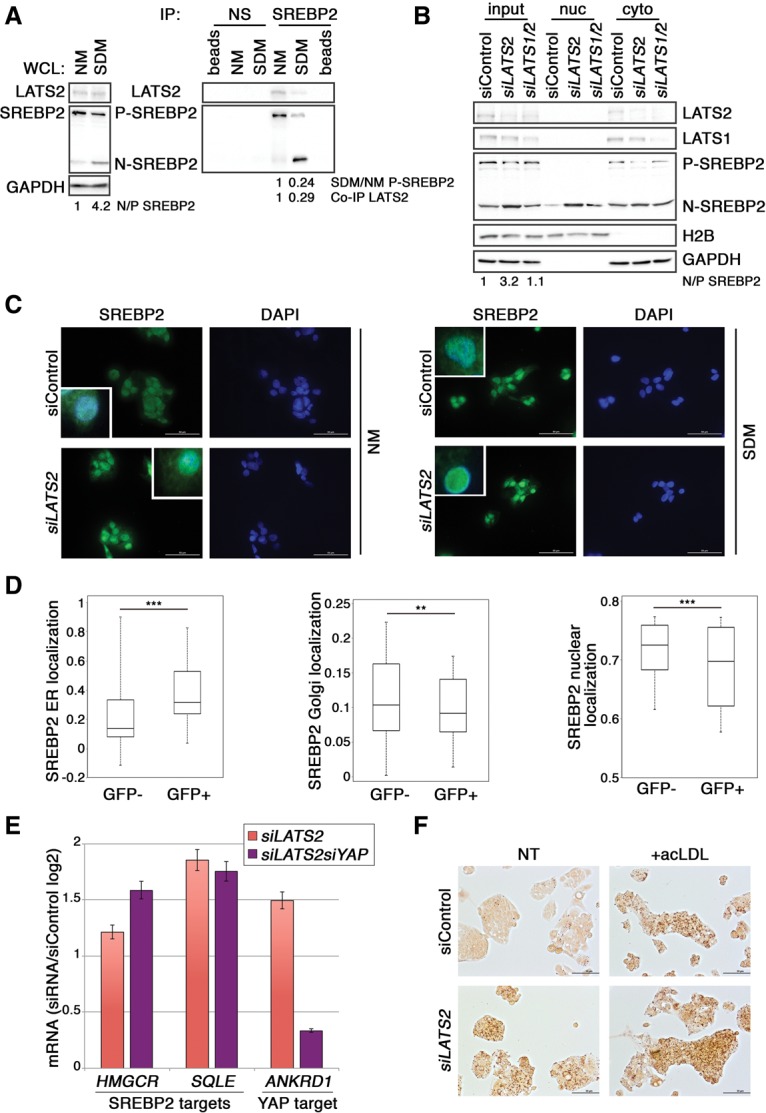
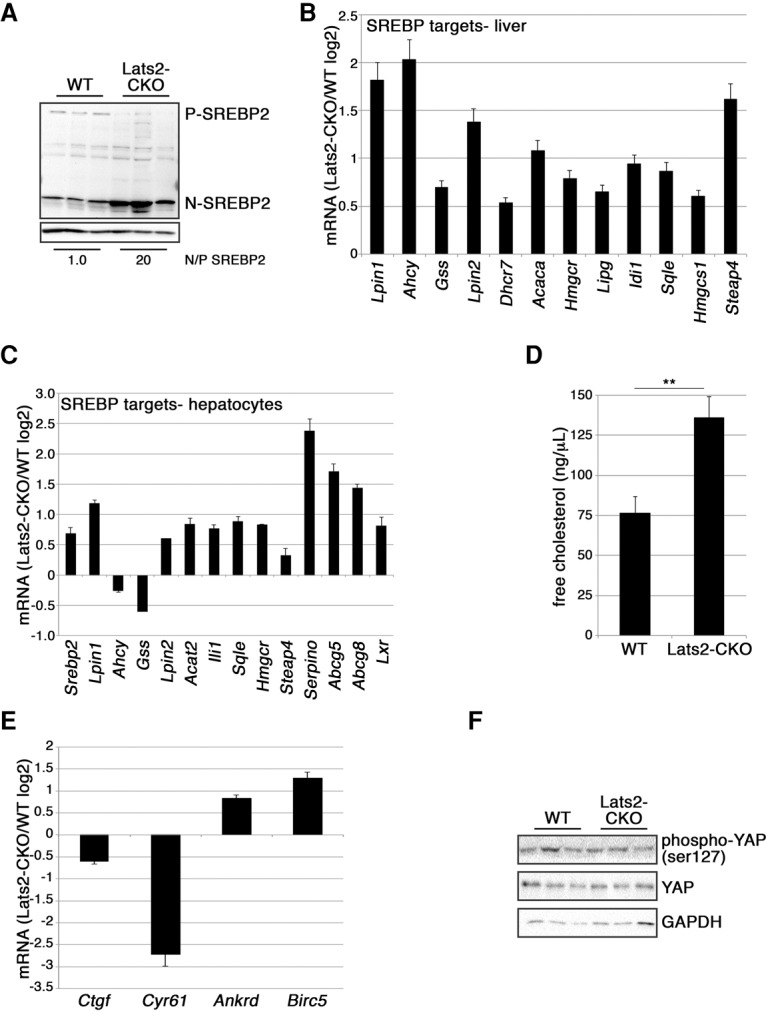
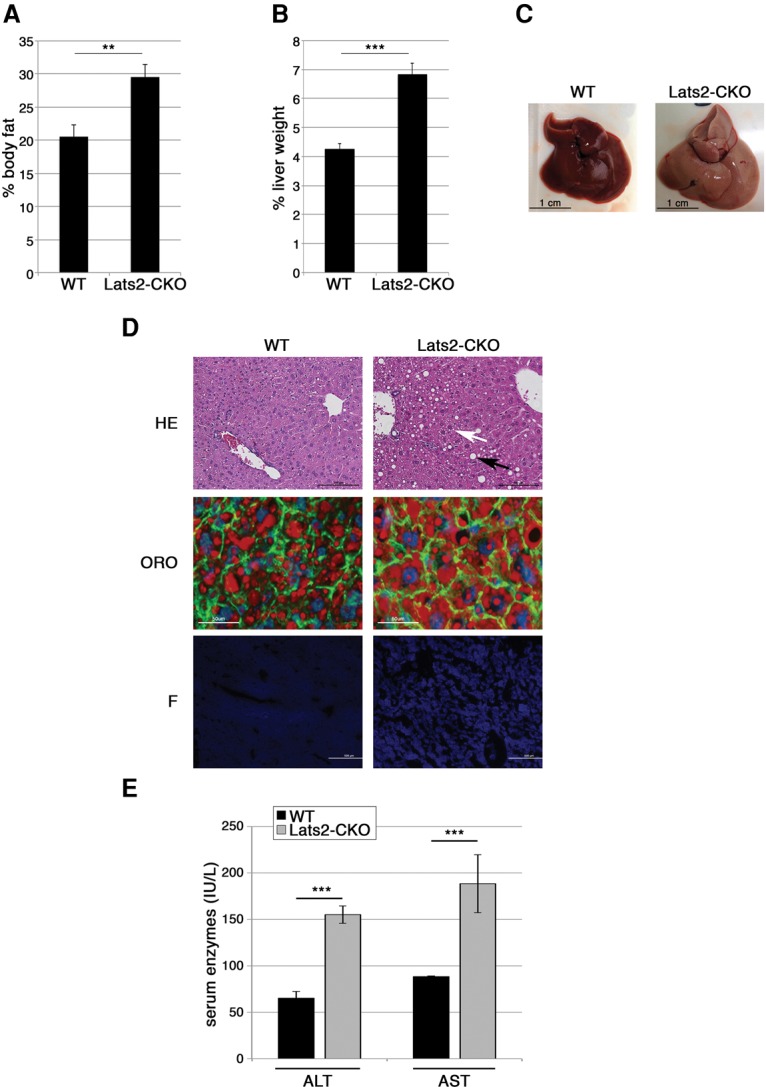
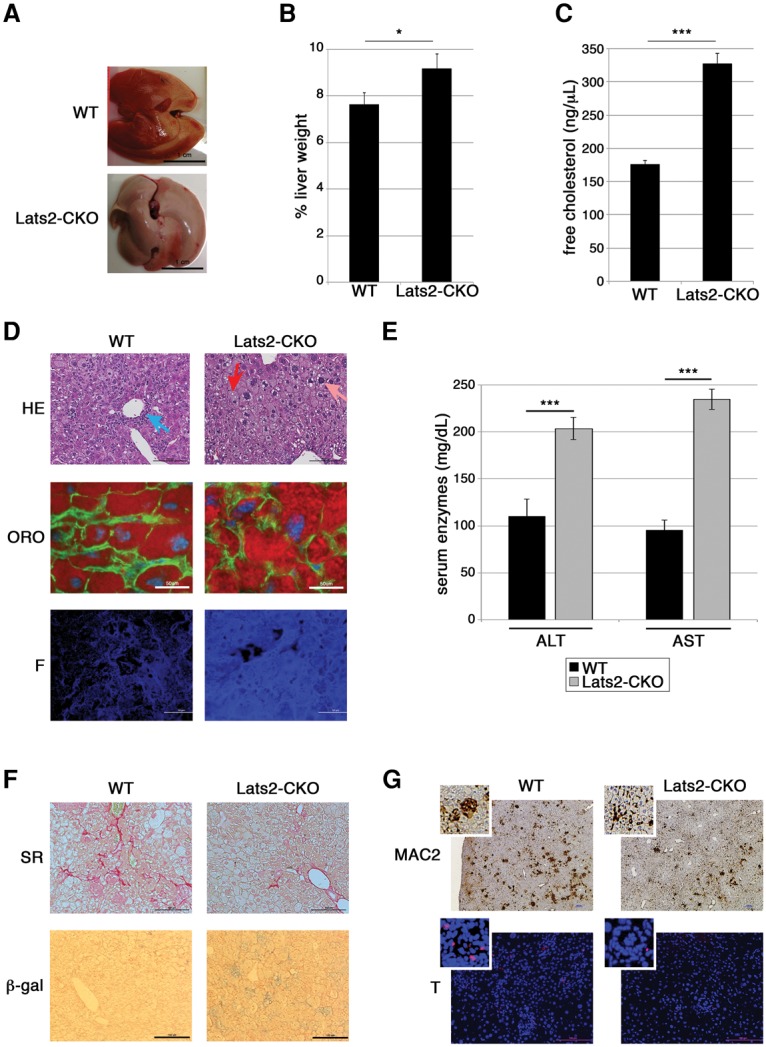
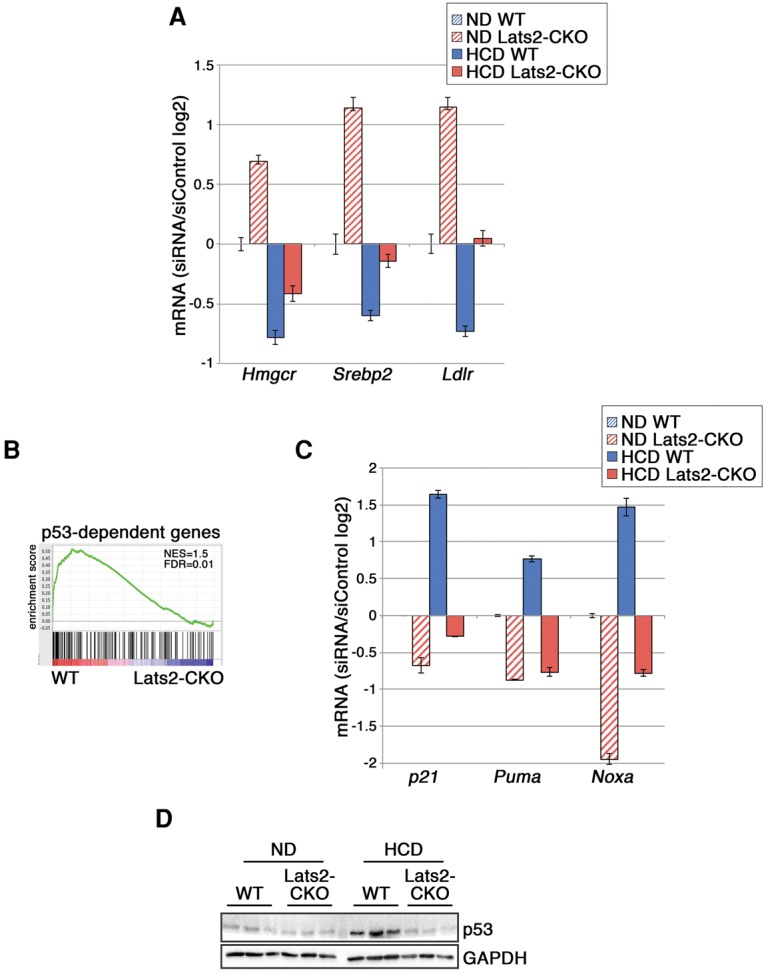
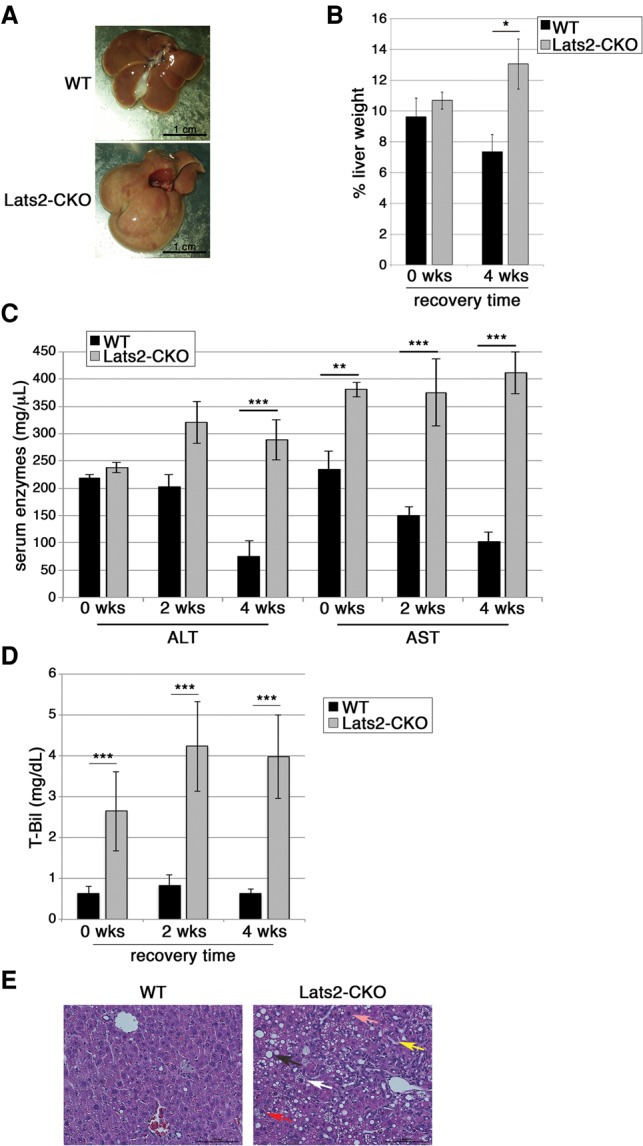
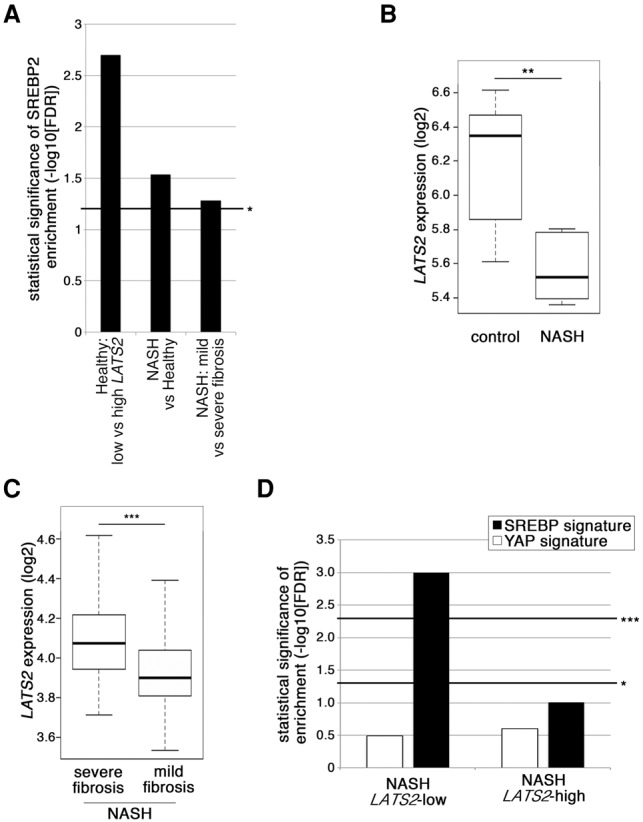
The Hippo signaling pathway is a major regulator of organ size. In the liver, Hippo pathway deregulation promotes hyperplasia and hepatocellular carcinoma primarily through hyperactivation of its downstream effector, YAP. The LATS2 tumor suppressor is a core member of the Hippo pathway. A screen for LATS2-interacting proteins in liver-derived cells identified the transcription factor SREBP2, master regulator of cholesterol homeostasis. LATS2 down-regulation caused SREBP activation and accumulation of excessive cholesterol. Likewise, mice harboring liver-specific Lats2 conditional knockout (Lats2-CKO) displayed constitutive SREBP activation and overexpressed SREBP target genes and developed spontaneous fatty liver disease. Interestingly, the impact of LATS2 depletion on SREBP-mediated transcription was clearly distinct from that of YAP overexpression. When challenged with excess dietary cholesterol, Lats2-CKO mice manifested more severe liver damage than wild-type mice. Surprisingly, apoptosis, inflammation, and fibrosis were actually attenuated relative to wild-type mice, in association with impaired p53 activation. Subsequently, Lats2-CKO mice failed to recover effectively from cholesterol-induced damage upon return to a normal diet. Additionally, decreased LATS2 mRNA in association with increased SREBP target gene expression was observed in a subset of human nonalcoholic fatty liver disease cases. Together, these findings further highlight the tight links between tumor suppressors and metabolic homeostasis.

Keywords: Hippo; Lats; YAP; cholesterol; fatty liver; p53.


Figures

Figure 1.
Figure 1.
LATS2 binds and inhibits SREBP in HepG2 cells. (A) Co-IP of endogenous LATS2 with endogenous SREBP2 from HepG2 cells grown in NM or SDM. The P-SREBP2 and N-SREBP2 forms of SREBP2 are indicated. Extracts were immunoprecipitated (IP) with antibody against SREBP2 or a nonspecific antibody (NS; anti-HA) as a negative control and subjected to SDS-PAGE followed by Western blot analysis. (beads) Antibody-bound beads without extract; (WCL) 2.5% of whole-cell lysate. GAPDH was used as a loading control. Values below the blots were calculated by normalizing the SDM value to the corresponding NM sample. (B) Nuclear fractionation analysis of HepG2 cells grown and transfected with control (siControl), LATS2 siRNA oligos (siLATS2), or LATS1 plus LATS2 oligos (siLATS1/2). Nuclear and cytoplasmic fraction purity was validated with H2B and GAPDH antibodies, respectively. Fold N/P-SREBP2 was calculated by normalizing each sample to the siControl sample. (C) Immunofluorescence imaging of HepG2 cells grown in NM or SDM and transfected with siControl or siLATS2. (Inset) Higher-magnification of the SREBP2/DAPI merged image. (D) ImageStream analysis of relative subcellular distribution of SREBP2 in LATS2-overexpressing cells. HepG2 cells were transfected with GFP-LATS2, and GFP and GFP+ (GFP-LATS2-positive) cells were separately gated and analyzed for colocalization of SREBP2 with markers for ER (PDI), Golgi (p115), and nuclei (DAPI) (see the Supplemental Material). The whiskers denote the most extreme data points within the interquartile range. In each box plot, top and bottom regions represent second and third quartiles, respectively. (E) Quantitative RT–PCR (qRT–PCR) analysis of gene expression in HepG2 cells grown in NM and transfected with siControl, siLATS2 only, or siLATS2 and siYAP. Values were normalized to HPRT and are presented as log2 of siRNA/siControl ratio. Error bars indicate SD. (F) HepG2 cells grown in SDM were transfected with either siControl or siLATS2. Six hours later, the medium was replaced with fresh medium without (NT) or with 100 μg/mL acLDL for 17 h before fixation and staining with Oil-Red-O.
Figure 2.
Figure 2.
Liver-specific LATS2 deletion activates SREBP2 in vivo. (A) Western blot analysis of liver lysates from three wild-type (WT) and three Lats2-CKO 17-wk-old mice. N/P-SREBP2 was calculated by averaging the N-SREBP2/P-SREBP2 ratio for each genotype and normalizing to wild type. (B) Expression of SREBP target genes in Lats2-CKO livers relative to wild-type livers. Values are based on qRT–PCR analysis of RNA from livers of three 17-wk-old mice from each genotype. Expression, normalized to β-actin, is presented as log2 of the Lats2-CKO/wild-type ratio. Error bars indicate SE. (C) Expression of SREBP target genes in RNA of primary hepatocytes from Lats2-CKO livers relative to wild-type livers. Values based on qRT–PCR analysis are presented as log2 of the Lats2-CKO/wild-type ratio. Error bars indicate SD. (D) Quantification of hepatocellular free cholesterol levels normalized to mg tissue. Values represent measurements from three wild-type and three Lats2-CKO 17-wk-old mice. (E) Expression of YAP target genes in Lats2-CKO livers relative to wild-type livers. Values are based on qRT–PCR analysis of RNA from livers of three 17-wk-old mice from each genotype. Expression, normalized to β-actin, is presented as log2 of the Lats2-CKO/wild-type ratio. Error bars indicate SE. (F) Western blot analysis of liver lysates from three wild-type and three Lats2-CKO 17-wk-old mice reacting with the indicated antibodies. GAPDH was used as a loading control.
Figure 3.
Figure 3.
Hepatic Lats2 deletion induces fatty liver. (A) Relative body fat of 26-wk-old wild-type (WT) and Lats2-CKO mice as determined by EchoMRI-100 and normalized to total body weight. (B) Liver weight as a percentage of total body weight of 26-wk-old wild-type and Lats2-CKO mice. (C) Livers of 26-wk-old wild-type and Lats2-CKO mice. (D) Liver sections from 17-wk-old wild-type and Lats2-CKO mice. (Top panels) H&E (HE) staining. White and black arrows indicate microsteatosis and macrosteatosis, respectively. (Middle panels) Oil-Red-O (ORO) staining with DAPI-stained nuclei (blue), phalloidin-stained F-actin (green), and Oil-Red-O-stained lipids (red). (Bottom panels) Filipin (F) staining of cellular free cholesterol. (E) ALT and AST serum levels in 26-wk-old mice.
Figure 4.
Figure 4.
Hepatic Lats2 deletion exacerbates diet-induced cholesterol overload. (A) Livers of wild-type (WT) and Lats2-CKO mice fed an HCD for 9 wk. (B) Liver weight as percentage of total body weight of wild-type and Lats2-CKO mice fed an HCD for 9 wk. (C) Quantification of hepatocellular free cholesterol normalized to mg tissue. Values represent measurements from three wild-type and three Lats2-CKO mice fed an HCD. (D) Liver sections from wild-type and Lats2-CKO mice fed an HCD for 9 wk. (Top panels) H&E staining. (Blue arrow) Portal inflammation; (red arrow) ballooning; (pink arrow) pleomorphic nucleus. (Middle panels) Oil-Red-O (ORO) staining with DAPI-stained nuclei (blue), phalloidin-stained F-actin (green), and Oil-Red-O-stained lipids (red). (Bottom panels) Filipin (F) staining of cellular free cholesterol. (E) ALT and AST serum levels in wild-type and Lats2-CKO mice fed an HCD for 9 wk. (F) Liver sections from wild-type and Lats2-CKO mice fed an HCD for 9 wk. (Top panels) Sirius Red (SR) staining of fibrosis. (Bottom panels) Senescence-associated β-gal (β-gal) staining. (G, top panels) Immunohistochemistry staining of MAC2 (macrophage marker) in liver sections of wild-type and Lats2-CKO mice fed an HCD. (Bottom panels) TUNEL (red) staining for apoptosis. Nuclei were stained with DAPI (blue). Higher-magnification insets are also shown.
Figure 5.
Figure 5.
Lats2-CKO mice fail to mount a p53 response. (A) Expression of SREBP target genes in Lats2-CKO livers relative to wild-type (WT) livers under an ND. Values from qRT–PCR analysis of RNA from livers of three 17-wk-old mice from each genotype, normalized to β-actin, are presented as log2 of the Lats2-CKO/wild-type ratio. Error bars indicate SE. (B) GSEA of the most differentially expressed (fold change >1.5; P-value < 0.05) genes between the livers of wild-type and Lats2-CKO mice fed an HCD, compared with a published p53 target gene data set (p53_DN.V1_DN) (Subramanian et al. 2005). (C) Expression of p53 target genes in Lats2-CKO livers relative to wild-type livers under an ND. Values from qRT–PCR analysis of RNA from livers of three 17-wk-old mice from each genotype, normalized to β-actin, are presented as log2 of the Lats2-CKO/wild-type ratio. Error bars indicate SE. (C) Western blot analysis of liver lysates from three wild-type and three Lats2-CKO mice fed an ND or HCD. GAPDH was used as a loading control.
Figure 6.
Figure 6.
Lats2 facilitates recovery from cholesterol overload-induced liver damage. (A) Livers from wild-type (WT) and Lats2-CKO mice fed an HCD for 18 wk and then returned to an ND for 4 wk. (B) Liver weight, normalized to whole body weight, presented as percentage for wild-type and Lats2-CKO mice fed an HCD for 18 wk and either sacrificed immediately (0 wk) or allowed to recover for 4 wk on an ND. (C) ALT and AST serum levels in mice treated as in A and allowed to recover on an ND for the indicated times. (D) Bilirubin (T-Bil) serum levels in mice treated as in A and allowed to recover on an ND for the indicated times. (E) H&E staining of livers of wild-type and Lats2-CKO mice after 18 wk on an HCD followed by 4 wk of recovery on an ND. Microsteatosis (white arrow), macrosteatosis (black arrow), ductal reaction (yellow arrow), pleomorphic nucleus (pink arrow), and ballooned hepatocyte (red arrow) are indicated.
Figure 7.
Figure 7.
Reduced LATS2 levels and increased SREBP target gene expression in human liver and fatty liver disease. (A) Statistical significance of SREBP2 signature enrichment in different human liver data sets (from left to right: GSE48452, GSE37031, and GSE49541). In the left column, “low” and “high” relate to the 20% of healthy livers in data set GSE48452 with the lowest or highest LATS2 expression, respectively (lowest and highest quintile). Bar height represents −log10 of the corrected false discovery rate (FDR). (B) LATS2 expression (log2) in the livers of NASH patients and controls extracted from data set GSE37031, comprised of seven control and eight NAFLD samples. The whiskers denote the most extreme data points within interquartile range ×1.5. In each box plot, the top and bottom regions represent the second and third quartiles, respectively. (C) LATS2 expression (log2) in the livers of NAFLD patients with severe or mild fibrosis extracted from data set GSE49541. Severe fibrosis, n = 32; mild fibrosis, n = 40. Whisker and box plots are as in B. (D) Enrichment analysis of SREBP signature (summarized in Supplemental Table S2) and YAP signature (Dupont et al. 2011) in data set GSE48452. Control, n = 14; NAFLD, Lats2-high expression, n = 9; NAFLD, Lats2-low expression, n = 9. Bar height represents −log10 of the FDR. (*) FDR < 0.25; (***) FDR < 0.05.

References

    1. Ahrens M, Ammerpohl O, von Schonfels W, Kolarova J, Bens S, Itzel T, Teufel A, Herrmann A, Brosch M, Hinrichsen H, et al. 2013. DNA methylation analysis in nonalcoholic fatty liver disease suggests distinct disease-specific and remodeling signatures after bariatric surgery. Cell Metab 18: 296–302. - PubMed
    1. Albanis E, Friedman SL. 2001. Hepatic fibrosis. Pathogenesis and principles of therapy. Clin Liver Dis 5: 315–334. - PubMed
    1. Amaral JD, Castro RE, Steer CJ, Rodrigues CM. 2009. p53 and the regulation of hepatocyte apoptosis: implications for disease pathogenesis. Trends Mol Med 15: 531–541. - PubMed
    1. Aylon Y, Michael D, Shmueli A, Yabuta N, Nojima H, Oren M. 2006. A positive feedback loop between the p53 and Lats2 tumor suppressors prevents tetraploidization. Genes Dev 20: 2687–2700. - PMC - PubMed
    1. Aylon Y, Yabuta N, Besserglick H, Buganim Y, Rotter V, Nojima H, Oren M. 2009. Silencing of the Lats2 tumor suppressor overrides a p53-dependent oncogenic stress checkpoint and enables mutant H-Ras-driven cell transformation. Oncogene 28: 4469–4479. - PMC - PubMed

Publication types

MeSH terms

Substances