Review
. 2016 Apr;25(2):375-400.
doi: 10.1016/j.soc.2015.11.007.

State-of-the-art Imaging of Pancreatic Neuroendocrine Tumors

Affiliations
Review

State-of-the-art Imaging of Pancreatic Neuroendocrine Tumors

Eric P Tamm et al. Surg Oncol Clin N Am. 2016 Apr.

Abstract

Pancreatic neuroendocrine tumors are rare tumors that present many imaging challenges, from detecting small functional tumors to fully staging large nonfunctioning tumors, including identifying all sites of metastatic disease, particularly nodal and hepatic, and depicting vascular involvement. The correct choice of imaging modality requires knowledge of the tumor type (eg, gastrinoma versus insulinoma), and also the histology (well vs poorly differentiated). Evolving techniques in computed tomography (CT), MRI, endoscopic ultrasonography, and nuclear medicine, such as dual-energy CT, diffusion-weighted MRI, liver-specific magnetic resonance contrast agents, and new nuclear medicine agents, offer new ways to visualize, and ultimately manage, these tumors.

Keywords: Computed tomography; Dual energy; Endoscopic ultrasonography; Imaging; MRI; Octreotide; PET/CT; Pancreatic neuroendocrine tumor.


Figures

Fig. 1
Fig. 1
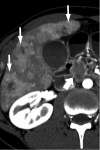
Pancreatic tail neuroendocrine tumor (white arrows) on multiphasic CT. (A) is hyperdense to background on the arterial phase and (B) isodense on the portal venous phase.
Fig. 1
Fig. 1
Pancreatic tail neuroendocrine tumor (white arrows) on multiphasic CT. (A) is hyperdense to background on the arterial phase and (B) isodense on the portal venous phase.
Fig. 2
Fig. 2
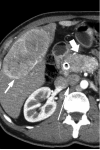
PNET liver metastases (white arrowheads) on multiphasic CT are classically hyperdense to background on (A) early and (B) late arterial phases and either isodense or hypodense on (C) portal venous phase but can be variable.
Fig. 2
Fig. 2
PNET liver metastases (white arrowheads) on multiphasic CT are classically hyperdense to background on (A) early and (B) late arterial phases and either isodense or hypodense on (C) portal venous phase but can be variable.
Fig. 2
Fig. 2
PNET liver metastases (white arrowheads) on multiphasic CT are classically hyperdense to background on (A) early and (B) late arterial phases and either isodense or hypodense on (C) portal venous phase but can be variable.
Fig. 3
Fig. 3
Pancreatic tail NET (white arrows) seen on late arterial phase CT, as seen (A) conventionally at 140kVp, and more conspicuously at dual energy CT (DECT) (B) low energy 50 keV and (C) iodine (minus water) material density images.
Fig. 3
Fig. 3
Pancreatic tail NET (white arrows) seen on late arterial phase CT, as seen (A) conventionally at 140kVp, and more conspicuously at dual energy CT (DECT) (B) low energy 50 keV and (C) iodine (minus water) material density images.
Fig. 3
Fig. 3
Pancreatic tail NET (white arrows) seen on late arterial phase CT, as seen (A) conventionally at 140kVp, and more conspicuously at dual energy CT (DECT) (B) low energy 50 keV and (C) iodine (minus water) material density images.
Fig. 4
Fig. 4
PNET metastases to liver (white arrows) and nodes (thick white arrow) seen on DECT late arterial phase at (A) 70 keV and (B) more conspicuously on iodine (minus water) material density images. Uptake in these sites on (C) octreotide images is highly specific to neuroendocrine tumors.
Fig. 4
Fig. 4
PNET metastases to liver (white arrows) and nodes (thick white arrow) seen on DECT late arterial phase at (A) 70 keV and (B) more conspicuously on iodine (minus water) material density images. Uptake in these sites on (C) octreotide images is highly specific to neuroendocrine tumors.
Fig. 4
Fig. 4
PNET metastases to liver (white arrows) and nodes (thick white arrow) seen on DECT late arterial phase at (A) 70 keV and (B) more conspicuously on iodine (minus water) material density images. Uptake in these sites on (C) octreotide images is highly specific to neuroendocrine tumors.
Fig. 5
Fig. 5
Nonfunctioning tail PNET (white arrows) seen on MRI on dynamic (A) arterial phase, (B) T2 and (C) diffusion weighted imaging. Diffusion imaging improves contrast, though resolution is less than other series.
Fig. 5
Fig. 5
Nonfunctioning tail PNET (white arrows) seen on MRI on dynamic (A) arterial phase, (B) T2 and (C) diffusion weighted imaging. Diffusion imaging improves contrast, though resolution is less than other series.
Fig. 5
Fig. 5
Nonfunctioning tail PNET (white arrows) seen on MRI on dynamic (A) arterial phase, (B) T2 and (C) diffusion weighted imaging. Diffusion imaging improves contrast, though resolution is less than other series.
Fig. 6
Fig. 6
Patient with elevated gastrin levels and large pancreatic gastrinoma (white arrowheads) on multiphasic CT in (A) arterial phase with invasion of portal vein (curved black arrow) and (B) multiple liver metastases (white arrows). Octreotide scan (C) projection images show intense uptake in primary gastrinoma (black arrowhead), and liver metastases (black arrows).
Fig. 6
Fig. 6
Patient with elevated gastrin levels and large pancreatic gastrinoma (white arrowheads) on multiphasic CT in (A) arterial phase with invasion of portal vein (curved black arrow) and (B) multiple liver metastases (white arrows). Octreotide scan (C) projection images show intense uptake in primary gastrinoma (black arrowhead), and liver metastases (black arrows).
Fig. 7
Fig. 7
PNET (thick white arrow), adenopathy (long white arrow), liver metastases (white arrow) and tumor thrombus in vein (black arrowhead) as seen on arterial phase (A) 70keV (B) iodine material density and (C) portal venous phase imaging, the last showing metastases and portal vein thrombus. Octreotide fused SPECT CT (D), as a whole body study, identifies distant metastatic left supraclavicular node. Note similarity of some adenopathy to adjacent vessels.
Fig. 7
Fig. 7
PNET (thick white arrow), adenopathy (long white arrow), liver metastases (white arrow) and tumor thrombus in vein (black arrowhead) as seen on arterial phase (A) 70keV (B) iodine material density and (C) portal venous phase imaging, the last showing metastases and portal vein thrombus. Octreotide fused SPECT CT (D), as a whole body study, identifies distant metastatic left supraclavicular node. Note similarity of some adenopathy to adjacent vessels.
Fig. 8
Fig. 8
Metastatic PNET on whole body fused octreotide SPECT/CT with uptake in metastatic nodal disease (white arrows) in (A) mediastinum (B) retroperitoneum and (C) liver metastasis (thick white arrow).
Fig. 8
Fig. 8
Metastatic PNET on whole body fused octreotide SPECT/CT with uptake in metastatic nodal disease (white arrows) in (A) mediastinum (B) retroperitoneum and (C) liver metastasis (thick white arrow).
Fig. 8
Fig. 8
Metastatic PNET on whole body fused octreotide SPECT/CT with uptake in metastatic nodal disease (white arrows) in (A) mediastinum (B) retroperitoneum and (C) liver metastasis (thick white arrow).
Fig. 9
Fig. 9
Small pancreatic insulinoma on multiphasic CT and octreotide scan. Insulinoma (white arrow) here is uniformly hyperdense on late arterial phase but (B) near isodense to background on portal venous phase. On octreotide scan (C), it is not seen (normal uptake in liver, spleen and kidneys).
Fig. 9
Fig. 9
Small pancreatic insulinoma on multiphasic CT and octreotide scan. Insulinoma (white arrow) here is uniformly hyperdense on late arterial phase but (B) near isodense to background on portal venous phase. On octreotide scan (C), it is not seen (normal uptake in liver, spleen and kidneys).
Fig. 10
Fig. 10
Nonfunctioning poorly differentiated pancreatic body PNET (white arrows) on (A) axial late arterial phase CT and (B) showing intense uptake on PET/CT fused image as is a (C) liver metastasis.
Fig. 10
Fig. 10
Nonfunctioning poorly differentiated pancreatic body PNET (white arrows) on (A) axial late arterial phase CT and (B) showing intense uptake on PET/CT fused image as is a (C) liver metastasis.
Fig. 10
Fig. 10
Nonfunctioning poorly differentiated pancreatic body PNET (white arrows) on (A) axial late arterial phase CT and (B) showing intense uptake on PET/CT fused image as is a (C) liver metastasis.
Fig. 11
Fig. 11
Proximal duodenal histopathologically proven gastrinoma (white arrow) on (A) 50 keV dual energy CT, late arterial phase and (B) 68Ga-DOTA-NOC fused PET/CT image has hypervascular appearance on CT and shows intense uptake of tracer. Water was used as negative contrast on CT.
Fig. 11
Fig. 11
Proximal duodenal histopathologically proven gastrinoma (white arrow) on (A) 50 keV dual energy CT, late arterial phase and (B) 68Ga-DOTA-NOC fused PET/CT image has hypervascular appearance on CT and shows intense uptake of tracer. Water was used as negative contrast on CT.
Fig. 12
Fig. 12
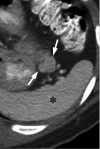
Incidentally identified pancreatic tail mass (white arrows) on CT (A) similar to spleen (black asterisk) on multiphasic imaging, showed (B) no uptake of technetium sulfur colloid (therefore not an accessory spleen). (C) EUS with FNA showed well defined slightly hypoechoic mass, and PNET on histopathology.
Fig. 12
Fig. 12
Incidentally identified pancreatic tail mass (white arrows) on CT (A) similar to spleen (black asterisk) on multiphasic imaging, showed (B) no uptake of technetium sulfur colloid (therefore not an accessory spleen). (C) EUS with FNA showed well defined slightly hypoechoic mass, and PNET on histopathology.
Fig. 13
Fig. 13
Peripancreatic adenopathy as site of gastrinoma. Portal venous phase CT shows enhancing adenopathy (white arrow) (A) anterior to transverse duodenum and (B) near aortocaval space, similar to aorta and opacified bowel loops.
Fig. 13
Fig. 13
Peripancreatic adenopathy as site of gastrinoma. Portal venous phase CT shows enhancing adenopathy (white arrow) (A) anterior to transverse duodenum and (B) near aortocaval space, similar to aorta and opacified bowel loops.
Fig. 14
Fig. 14
Cystic pancreatic tail lesion (white arrows) on CT shows subtle peripheral enhancement. EUS FNA confirmed PNET.
Fig. 15
Fig. 15
Large nonfunctioning pancreatic head PNET on CT (A) late arterial phase shows tumor (white arrows) extending anterior to a metallic biliary stent (black arrow), and (B) infiltrating (black arrowhead) the superior mesenteric vein.
Fig. 15
Fig. 15
Large nonfunctioning pancreatic head PNET on CT (A) late arterial phase shows tumor (white arrows) extending anterior to a metallic biliary stent (black arrow), and (B) infiltrating (black arrowhead) the superior mesenteric vein.
Fig. 16
Fig. 16
A PNET (white arrow) and its liver metastases (black arrows) that is atypically hypodense on CT on (A) late arterial and (B) portal venous phases, that mimics pancreatic ductal adenocarcinoma.
Fig. 16
Fig. 16
A PNET (white arrow) and its liver metastases (black arrows) that is atypically hypodense on CT on (A) late arterial and (B) portal venous phases, that mimics pancreatic ductal adenocarcinoma.
Fig. 17
Fig. 17
Staging of pancreatic head PNET (white arrowheads) that on CT on (A) late arterial phase shows superior mesenteric vein (SMV) abutment. While PNET is not as well seen on (B) portal venous phase images, the SMV is clearly free of thrombus and coronal (C) reconstruction shows PNET not involving the portal vein and separate from superior mesenteric artery.
Fig. 17
Fig. 17
Staging of pancreatic head PNET (white arrowheads) that on CT on (A) late arterial phase shows superior mesenteric vein (SMV) abutment. While PNET is not as well seen on (B) portal venous phase images, the SMV is clearly free of thrombus and coronal (C) reconstruction shows PNET not involving the portal vein and separate from superior mesenteric artery.
Fig. 18
Fig. 18
Metastatic PNET with liver metastases (short white arrows) and nodal disease (white arrowheads) appear bright as seen on typical (A) T2 fat suppressed imaging and (B) diffusion weighted imaging with B value of 500. Unlike CT, portal vein (long white arrow) is black, clearly distinguishable from nodes. Notably, metastatic and reactive nodes appear similar on both techniques.
Fig. 18
Fig. 18
Metastatic PNET with liver metastases (short white arrows) and nodal disease (white arrowheads) appear bright as seen on typical (A) T2 fat suppressed imaging and (B) diffusion weighted imaging with B value of 500. Unlike CT, portal vein (long white arrow) is black, clearly distinguishable from nodes. Notably, metastatic and reactive nodes appear similar on both techniques.
Fig. 19
Fig. 19
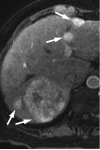
PNET liver metastases (white arrows) on MRI on (A) arterial phase of dynamic, (B) portal venous phase, (C) 20 minute delayed post gadoxetate disodium and (D) diffusion weighted imaging. Conspicuity of liver metastases can vary greatly between arterial/portal venous images but because they lack hepatocytes, metastases are usually distinctly dark and well defined on (C) delayed gadobenate dimeglumine images. Diffusion weighted imaging also show lesions well.
Fig. 19
Fig. 19
PNET liver metastases (white arrows) on MRI on (A) arterial phase of dynamic, (B) portal venous phase, (C) 20 minute delayed post gadoxetate disodium and (D) diffusion weighted imaging. Conspicuity of liver metastases can vary greatly between arterial/portal venous images but because they lack hepatocytes, metastases are usually distinctly dark and well defined on (C) delayed gadobenate dimeglumine images. Diffusion weighted imaging also show lesions well.

References

    1. Fraenkel M, Kim MK, Faggiano A, et al. Epidemiology of gastroenteropancreatic neuroendocrine tumours. Best Pract Res Clin Gastroenterol. 2012;26(6):691–703. - PubMed
    1. Lawrence B, Gustafsson BI, Chan A, et al. The epidemiology of gastroenteropancreatic neuroendocrine tumors. Endocrinol Metab Clin North Am. 2011;40(1):1–18. vii. - PubMed
    1. Zhou J, Enewold L, Stojadinovic A, et al. Incidence rates of exocrine and endocrine pancreatic cancers in the United States. Cancer Causes Control. 2010;21(6):853–861. - PubMed
    1. Baur AD, Pavel M, Prasad V, et al. Acta radiologica (Stockholm, Sweden : 1987) 2015. Diagnostic imaging of pancreatic neuroendocrine neoplasms (pNEN): tumor detection, staging, prognosis, and response to treatment. - PubMed
    1. Jensen RT, Berna MJ, Bingham DB, et al. Inherited pancreatic endocrine tumor syndromes: advances in molecular pathogenesis, diagnosis, management, and controversies. Cancer. 2008;113(7 Suppl):1807–1843. - PMC - PubMed

MeSH terms