. 2016 Apr 15;352(6283):353-8.
doi: 10.1126/science.aad7297. Epub 2016 Mar 24.

Nuclear envelope rupture and repair during cancer cell migration

Affiliations

Nuclear envelope rupture and repair during cancer cell migration

Celine M Denais et al. Science. .

Abstract

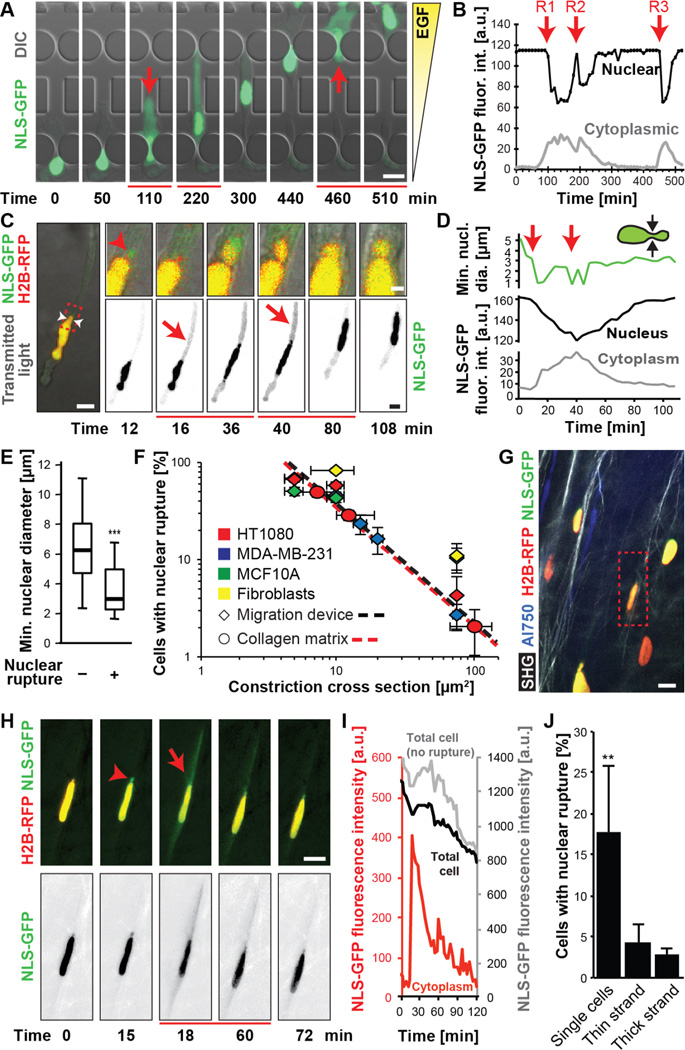
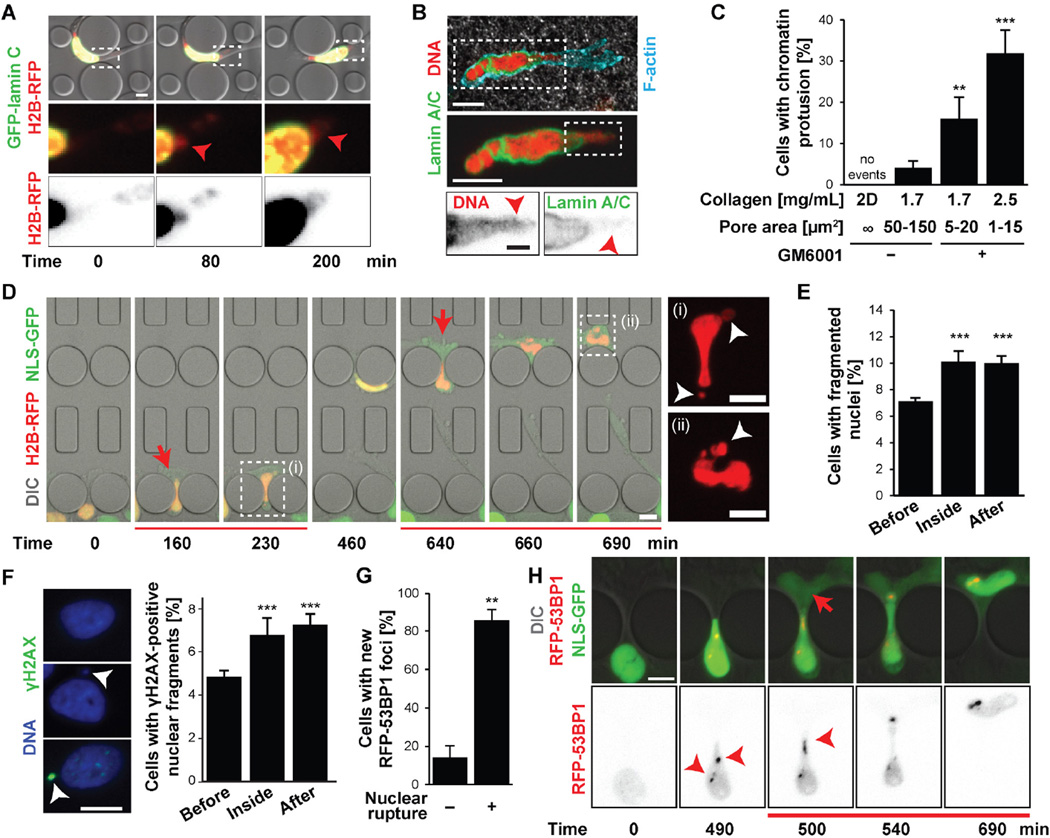
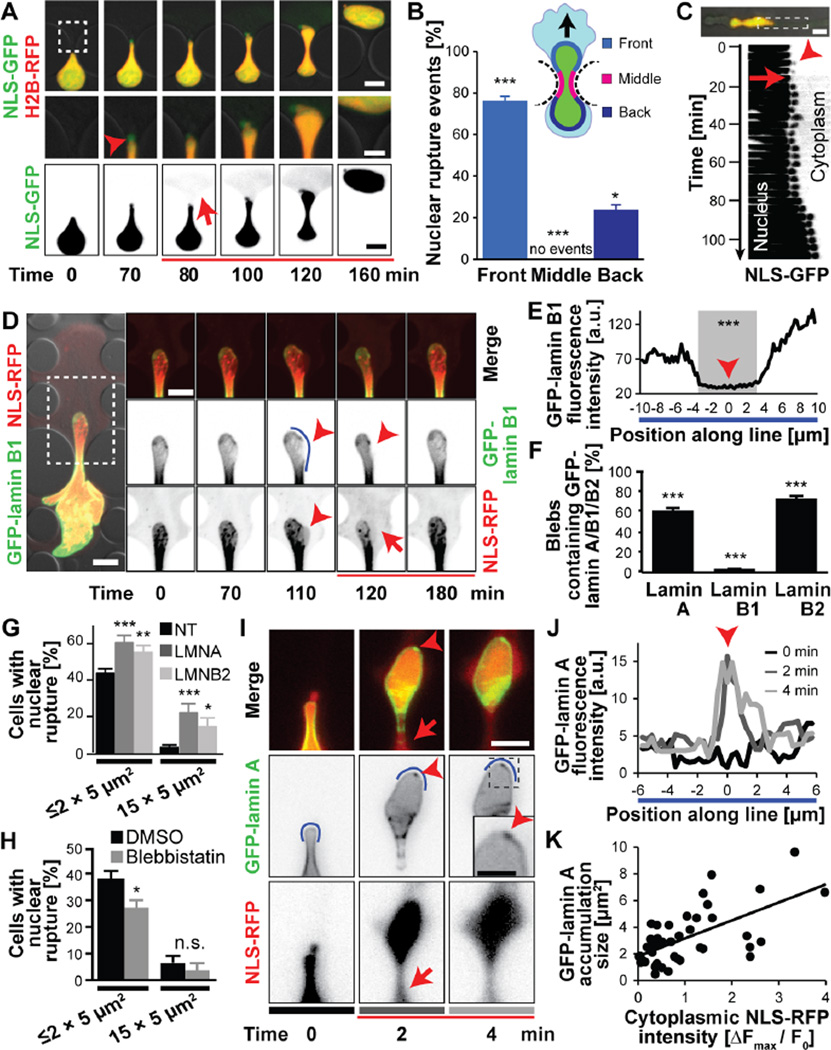
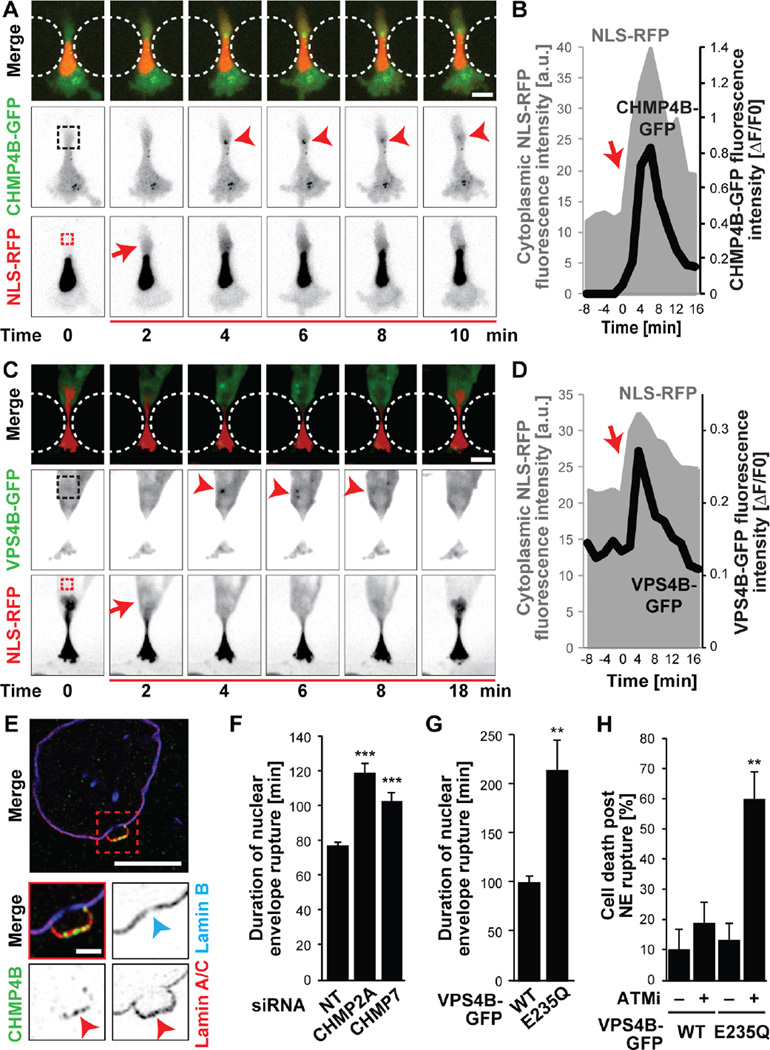
During cancer metastasis, tumor cells penetrate tissues through tight interstitial spaces, which requires extensive deformation of the cell and its nucleus. Here, we investigated mammalian tumor cell migration in confining microenvironments in vitro and in vivo. Nuclear deformation caused localized loss of nuclear envelope (NE) integrity, which led to the uncontrolled exchange of nucleo-cytoplasmic content, herniation of chromatin across the NE, and DNA damage. The incidence of NE rupture increased with cell confinement and with depletion of nuclear lamins, NE proteins that structurally support the nucleus. Cells restored NE integrity using components of the endosomal sorting complexes required for transport III (ESCRT III) machinery. Our findings indicate that cell migration incurs substantial physical stress on the NE and its content and requires efficient NE and DNA damage repair for cell survival.


Figures

Figure 1
Figure 1. Nuclear rupture during migration through confining environments
(A) Image sequence of an MDA-MB-231 breast cancer cell that exhibited multiple NE ruptures while moving through 2 × 5 µm2 constrictions. See also Movie S1. Here and in all other figures, red arrows and lines below frames indicate beginning and duration of NE rupture(s). Scale bar: 20 µm (B) Fluorescence intensity of nuclear and cytoplasmic NLS-GFP of the cell in (A), showing loss of nuclear signal and concomitant increase in cytoplasmic fluorescence upon NE rupture, followed by gradual re-import of NLS-GFP into the nucleus. R1–3 indicate NE rupture events. (C) NE rupture in an HT1080 fibrosarcoma cell co-expressing NLS-GFP and fluorescently labeled histones (H2B-RFP) migrating inside a collagen matrix (2.5 mg/mL) with MMP inhibitor GM6001. See also Movie S2. Insets: close-up of nuclear bleb formation (red arrowhead). White arrowheads indicate the minimal nuclear diameter. Scale bar: 10 µm; 2 µm (insets). (D) Minimal nuclear diameter and nuclear and cytoplasmic NLS-GFP fluorescence intensity for the cell in (C). (E) Minimal nuclear diameter in rupturing and non-rupturing HT1080 cells. ***, p < 0.001; n = 159 and 62 cells, respectively. (F) Incidences of NE rupture as function of constriction sizes in collagen matrices (slope = –1.224; R2 = 0.999) and microfluidic devices during ≈12 hour period (slope = –1.219; R2 = 0.974). Regression based on HT1080 and MDA-MB-231 cells; n = 55–445 cells per condition. (G, H) Multiphoton image of HT1080 fibrosarcoma cells 5 days after implantation into the mouse dermis. Dashed box indicates cell with NE rupture and nuclear bleb (arrowhead) shown in (H). Collagen fibers detected by second harmonic generation (SHG); blood vessels visualized by AlexaFluor-750 labeled 70 kDa-dextran. Scale bar: 20 µm. (I) Fluorescence intensity of cytoplasmic (red) and total (black/gray) NLS-GFP signal in rupturing (red/black) and non-rupturing (gray) cell(s) in the same field of view. (J) Incidence of NE rupture as function of migration mode. **, p< 0.01 vs. thin and thick strands; n = 22–211 cells. Error bars: mean ± s.e.
Figure 2
Figure 2. Confined migration leads to chromatin protrusions, nuclear fragmentation, and DNA damage
(A) Representative image of an MDA-MB-231 cell co-expressing GFP-lamin C and H2B-RFP developing chromatin protrusion (arrowhead) during migration through a microfluidic constriction. Scale bar: 5 µm. (B) HT1080 cell in a collagen matrix (2.5 mg/mL + GM6001) with chromatin protrusion (arrowheads) across the nuclear lamina, stained for lamin A/C (green), DNA (red), and F-actin (turquoise). Scale bars: 10 µm, 2 µm (bottom inset). (C) Percentage of cells with chromatin protrusions as a function of collagen matrix pore size. 2D, unconfined migration on glass slide. **, p < 0.01; ***, p < 0.0001; n = 50–146 cells per condition. (D) Representative image sequence of the formation of chromatin-filled nuclear membrane blebs (white arrowheads) and subsequent nuclear fragmentation in an MDA-MB-231 breast cancer cell co-expressing NLS-GFP (green) and H2B-RFP (red) during migration through consecutive 2 × 5 µm2 constrictions. Insets are indicated by dashed lines. See also Movie S6. (E) Percentage of cells with fragmented nuclei before entry into constriction channel, inside the channel, and after exit. ***, p < 0.001; n = 9775, 1376, and 3072, respectively. (F) Example of an intact nucleus (left top), a nucleus with a small fragment (arrowhead) (left middle), and a nucleus with a γ-H2AX-positive fragment (left bottom). Scale bar: 10 µm. Percentage of cells with γ-H2AX-positive nuclear fragments before, inside, and after migration through constriction channels (right). ***, p < 0.001; n = 1376–3072 cells per condition. (G) Percentage of HT1080 cells migrating through 2 × 5 µm2 or 1 × 5 µm2 constrictions that formed 53BP1-RFP foci as a function of nuclear rupture. **, p < 0.01 n = 35 cells total. (H) Representative example of formation of 53BP1 foci (arrowheads) in U2OS cell co-expressing NLS-GFP and 53BP1-RFP during migration through 2 × 5 µm2 constriction and NE rupture. Scale bar: 10 µm. Error bars in figure: mean ± s.e.
Figure 3
Figure 3. Molecular sequence of nuclear rupture
(A) Nuclear membrane bleb formation (arrowhead) and collapse upon NE rupture. Scale bars: 10 µm (top and bottom rows), 5 µm (inset). (B) Distribution of NE rupture sites along nuclear periphery. Regions are based on the migration direction (black arrow) and denoted in the cartoon. n = 352 cells; *, p < 0.05; ***, p < 0.001; all comparisons relative to the hypothetical uniform distribution of 33%. (C) Kymograph of nuclear bleb formation (arrowhead) and collapse during subsequent NE rupture, corresponding to the image sequence in Fig. 1C. (D) Nuclear membrane blebs formed at sites of low GFP-lamin B1 intensity and were devoid of GFP-lamin B1 (arrowheads). Intensity along the blue line is quantified in panel E. Representative cell out of 178 cells observed. (E) GFP-lamin B1 fluorescence intensity profile. The gray area indicates the section where the nuclear bleb forms. ***, p < 0.0001; comparing values inside versus outside gray area. (F) Percentage of nuclear blebs containing detectable amounts of either lamin A, B1, B2. ***, p < 0.001; compared to the expected value of 100% for the primary nucleus; n = 178–199 cells per condition. (G) Incidence of NE rupture after siRNA treatment against lamins A/C, lamin B2, or non-target (NT) control. *, p < 0.05; **, p < 0.01; ***, p < 0.001; n = 384, 150, and 163 cells for constrictions ≤ 2 × 5 µm2; n = 166, 68, and 49 for 15 × 5 µm2 constrictions. (H) Blebbistatin treatment reduced NE rupture incidence during migration in constriction channels, but not in 15 × 5 µm2 control channels. *, p < 0.05; n = 286 and 194 for constrictions ≤ 2 × 5 µm2; n = 122, and 54 for cells in 15 × 5 µm2 constrictions. (I) GFP-lamin A accumulated at sites of NE rupture, forming ‘lamin scars’ (arrowheads). Grey bars under images correspond to line profiles at different times in (J). Scale bar: 10 µm. (J) GFP-lamin A signal intensity along a section of the nuclear rim (blue line in panel I). (K) GFP-lamin A accumulation increases with the severity of NE rupture. p < 0.0001; n = 46 cells (slope = 1.345, R2 = 0.3945). Error bars in figure: mean ± s.e.
Figure 4
Figure 4. ESCRT-III mediates nuclear envelope repair
(A) CHMP4B-GFP was transiently recruited to the site of nuclear membrane damage (arrowhead). See also Movie S7. Dashed boxes indicate areas used for measurements in (B). Representative sequence from 12 HT1080 cells total. Scale bar: 10 µm. (B) CHMP4B-GFP fluorescence intensity at rupture site (black), normalized to pre-rupture intensity, increased following NE rupture, indicated by increase in cytoplasmic RFP-NLS signal (grey). Red arrow indicates time of NE rupture. (C) Recruitment of VPS4B-GFP to sites of NE rupture (arrowhead) in an MDA-MB-231 cell. Dashed boxes indicate areas used for measurements in (D). Representative example from 18 cells total. Scale bar: 10 µm. (D) VPS4B-GFP fluorescence intensity in the cytoplasm (black) increased rapidly following NE rupture, detected by increase in cytoplasmic RFP-NLS signal (grey). Red arrow indicates time of NE rupture. (E) Representative super-resolution image (from 12 cells total) of endogenous CHMP4B accumulation at NE rupture site. Lamin A/C accumulation confirmed rupture site (red arrowhead). Blue arrowhead indicates decreased lamin B intensity at the base of the bleb. Scale bars: 5 µm and 1 µm (inset). (F) siRNA-mediated depletion of ESCRT-III proteins CHMP7 and CHMP2A in HT1080 cells resulted in an increased duration of NLS-GFP in the cytoplasm after migration induced NE rupture compared to non-target (NT) controls. ***, p < 0.001; n = 137 and 107, respectively. (G) Expression of the dominant-negative mutant VPS4BE235Q-GFP increased the duration of NLS-GFP in the cytoplasm after migration induced NE rupture in HT1080 cells, indicating impaired nuclear membrane repair. **, p < 0.005; n = 17 and 10, respectively. (H) Percentage of HT1080 cells dying after migration induced NE rupture, in the absence or presence of inhibition of ESCRT-III by dominant-negative VPS4BE235Q-GFP and/or DNA repair with the ATM inhibitor KU-55933 (ATMi). **, p < 0.01; n = 20, 32, 38, 30, respectively, compared to WT with ATMi and E235Q without ATMi. Error bars in figure: mean ± s.e.m.

Comment in

References

    1. Burke B, Stewart CL. Functional architecture of the cell's nucleus in development, aging, and disease. Current topics in developmental biology. 2014;109:1. - PubMed
    1. Hatch E, Hetzer M. Breaching the nuclear envelope in development and disease. The Journal of cell biology. 2014 Apr 28;205:133. - PMC - PubMed
    1. Weigelin B, Bakker G-J, Friedl P. Intravital third harmonic generation microscopy of collective melanoma cell invasion. Principles of interface guidance and microvesicle dynamics. IntraVital. 2012;1:32. - PMC - PubMed
    1. Harada T, et al. Nuclear lamin stiffness is a barrier to 3D migration, but softness can limit survival. The Journal of cell biology. 2014 Mar 3;204:669. - PMC - PubMed
    1. Thomas DG, et al. Non-muscle myosin IIB is critical for nuclear translocation during 3D invasion. The Journal of cell biology. 2015 Aug 17;210:583. - PMC - PubMed

Publication types