

Regulators of complement activity mediate inhibitory mechanisms through a common C3b-binding mode
- PMID: 27013439
- PMCID: PMC4868954
- DOI: 10.15252/embj.201593673
Regulators of complement activity mediate inhibitory mechanisms through a common C3b-binding mode
Abstract
Regulators of complement activation (RCA) inhibit complement-induced immune responses on healthy host tissues. We present crystal structures of human RCA (MCP, DAF, and CR1) and a smallpox virus homolog (SPICE) bound to complement component C3b. Our structural data reveal that up to four consecutive homologous CCP domains (i-iv), responsible for inhibition, bind in the same orientation and extended arrangement at a shared binding platform on C3b. Large sequence variations in CCP domains explain the diverse C3b-binding patterns, with limited or no contribution of some individual domains, while all regulators show extensive contacts with C3b for the domains at the third site. A variation of ~100° rotation around the longitudinal axis is observed for domains binding at the fourth site on C3b, without affecting the overall binding mode. The data suggest a common evolutionary origin for both inhibitory mechanisms, called decay acceleration and cofactor activity, with variable C3b binding through domains at sites ii, iii, and iv, and provide a framework for understanding RCA disease-related mutations and immune evasion.
Keywords: cofactor activity; complement; decay‐accelerating activity; immune evasion; regulators of complement activity.
© 2016 The Authors. Published under the terms of the CC BY NC ND 4.0 license.
Figures

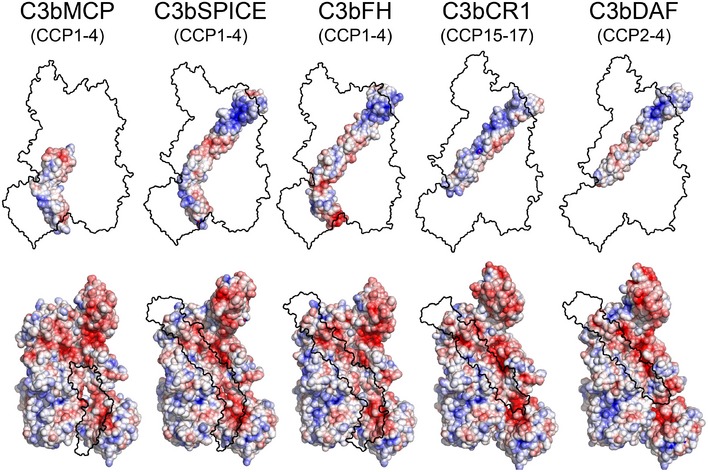
From left to right, surface representation of the three‐dimensional structures of C3b‐MCP (CCP1–4) (blue), C3b‐SPICE (CCP1–4) (green), C3b‐FH (CCP1–4) (orange), C3b‐CR1 (CCP15–17) (dark red), C3b‐DAF (CCP2–4) (purple).
Cartoon representation of the five regulators. The width of the cartoon is proportional to the B‐factors observed in the structural data. The B‐factor coloring (from blue to red) is in relative scale according to the resolution of the crystal structures.
Cartoon representation of the five C3b molecules in the C3b‐regulator complexes. Coloring and style as in (B).
Highlight of electron density maps (2F o‐F c, blue, contour level 1.2σ; F o‐F c, green and red, contour level 3σ and −3σ, resp.) for the regions of the C3b‐regulator complexes showing flexibility. From left to right: the putative site for MCP CCP2, SPICE CCP4, CR1 CCP15, and DAF CCP2.

- A–C
The C3b binding affinity of all regulators used in this study was measured by SPR on a surface that was prepared via on‐chip convertase‐mediated deposition of C3b. All regulators showed dose‐dependent binding over the injected concentration ranges [MCP (CCP1–4) = 0.003–7 μM, SPICE = 0.003–3.5 μM, FH (CCP1–4) = 0.005–19 μM, CR1 (CCP15–17) = 0.005–11 μM, and DAF (CCP1–4) = 0.09–50 μM] with rapid dissociation phases that resulted in block‐shaped response curves. Reported values for binding affinities (K D) range from 0.5 to 10 μM (Liszewski et al, 2006; Harris et al, 2007; Wu et al, 2009), with the order of affinity MCP > SPICE > FH > CR1 > DAF (A). All SPR response curves were normalized for molecular weight of the regulator and surface density of C3b. The steady state responses of all regulators could be fitted to a single binding site model, resulting in the listed K D values (B). Of note, DAF (CCP1–4) was evaluated in a separate experiment under the same conditions and superimposed with the normalized results of the other regulators. In the case of MCP, the E. coli‐ and HEK cell‐produced protein essentially showed the same binding and affinity (C); only MCP from E. coli is shown in panels (A) and (B). Among the regulators, MCP (CCP1–4) showed the highest affinity to C3b with a K D ˜350 nM, slightly stronger than in recently published SPR data for the interaction of soluble MCP (CCP1–4) to randomly immobilized C3b (K D ˜1 μM; Heurich et al, 2011). Recombinant SPICE showed an affinity of 1.3 μM affinity to C3b; previous studies in low‐salt buffer also indicated a stronger binding of MCP when compared with SPICE (Liszewski et al, 2006), yet the K D difference observed here is smaller. CR1 (CCP15–17) bound with slightly weaker affinity (K D ˜2 μM) as SPICE. On the other hand, SPICE bound with higher affinity to C3b than recombinant DAF (CCP1–4) and FH (CCP1–4), which yielded K D's of 6.1 and 7.2 μM, respectively. Similar to other studies (Morgan et al, 2011), physiological deposition of C3b appears to generate slightly stronger affinities when compared to the previously reported K D of 11 μM for FH (CCP1–4) binding to non‐enzymatically deposited C3b (Wu et al, 2009). Indeed, the affinity for DAF determined here is much closer to previous values of DAF binding to thioester‐deposited C3b (K D = 7 μM) when compared to randomly deposited C3b (K D = 14 μM; Harris et al, 2005).
- D
The plasma protein β2‐glycoprotein 1 (β2GPI) had previously been described to bind C3b via its CCP domains 1–4 and enhance the binding of FH to C3b (Gropp et al, 2011). When replicating the conditions of the previous ELISA‐based study on SPR, no direct binding of β2GPI (CCP1–4) to C3b could be observed at a concentration of 500 nM. Similarly, no enhancement of FH binding (12.5–50 nM) was detected in the presence of 500 nM β2GPI (CCP1–4).

“Open‐book” surface representation of C3b and regulator molecules, highlighting their domain organizations using different colors as shown in the neighboring schemes. Domains in complement regulators are labeled using domain numbering from CCPi to CCPiv based on their contact sites on C3b. The corresponding CCP domains in each regulator described in this work are shown in the bottom‐left scheme. Domains CCP1–2 of MCP are shown in shaded gray because they are not involved in C3b binding. The table reports the extent of the regulator contact surface on C3b and the associated buried surface area.
Opened view of the molecular footprint of the regulator‐C3b interaction (as shown in Fig 2A), highlighting the C3b domains on the regulator surface (top) and the regulator domains on C3b (bottom).

Superposition of MCP and FH domains CCP3–4 (shown as blue and orange cartoons, respectively) on the surface of C3b.
Cartoon representation of the superposition of domains CCP3–4 of MCP (blue), FH (orange), and SPICE (green). Despite the strong structural similarity and the conserved angle between domains CCP3 and CCP4, MCP and SPICE show a rotation of approximately 100° in the position of CCP4 compared to FH.
The reported mutagenesis data on MCP CCP3 and CCP4 (data from Liszewski et al, 2000) are consistent with the crystal structure. Shown are two orientations of the surface of MCP CCP3–4 as in the crystal structure of the C3b‐MCP complex, highlighting the contact sites with the C3b platform (purple), the MCP mutations identified as critical for C3b binding (red) and those not affecting the interaction (blue). The GB24 antibody epitope is shown as yellow contour on the MCP surface.
Model of the putative positioning of the flexible CCP1–2 domains of MCP. The model has been generated by superposing the structure of CCP1–4 of MCP from PDB 3O8E (Persson et al, 2010) onto the structure of the C3b‐MCP (CCP1–4) complex. CCP1–2 domains of MCP, not visible in the C3b‐MCP (CCP1–4) structure, are shown in gray.
Highlight of the primary sequence differences between SPICE and VCP. The 11 mutations distinguishing the two viral regulators are shown on the surface of SPICE in purple. The contact surface of C3b on the regulator in the C3b‐SPICE (CCP1–4) complex is shown in green on the right panel.

Histograms showing the most prominent features of C3b‐regulator interactions normalized for comparison among regulator structures. Shown are total number of amino‐acid contacts, buried surface area, electrostatic, and hydrophobic contacts. The histogram bar colors refer to each regulator molecule as shown in Fig 1A. For each C3b contact site, the contribution of each interaction is provided as percentage from the total contact interface of the regulator.
Specific details of C3b‐regulators interaction sites. Each of the four panels, representing binding sites CCPi–iv as described Fig 2, shows the contact site between C3b (displayed as cartoon) and the surface contour of a regulator (FH) to highlight its steric hindrance. Amino acids of C3b involved in protein–protein interactions have their side chains shown as ball‐and‐sticks and labeled with residue numbering. The alignments above each panel show the amino acids of the various complement regulators involved in binding. Underlined residues are buried in the contact interface. Residues involved in specific hydrogen‐bonding interactions, salt bridges, or strong hydrophobic contacts are highlighted with the color of the C3b domain corresponding to the specific interaction site. The limited resolution (4.2 Å) of the C3bDAF (CCP2–4) structure precludes a detailed interpretation of the contact interface. In this case, the sequence coloring refers to amino‐acid proximity between DAF and C3b residues likely involved in hydrogen‐bonding interactions.

Orientations of the CTC domains in the various C3b‐regulator complexes, represented as cartoons. C3b from Janssen et al (2006) is used as reference (shown in cyan).
Superposition of C3b structures from the C3b‐regulator complexes showing upward (left) and downward (right) shifts of CUB‐TED domains compared to free C3b (cyan).
Details of the upward (top) and downward (bottom) CUB‐TED shift around the CUB‐TED linker region.
Details of the upward (top) and downward (bottom) CUB‐TED shift at the bottom of the TED domain.
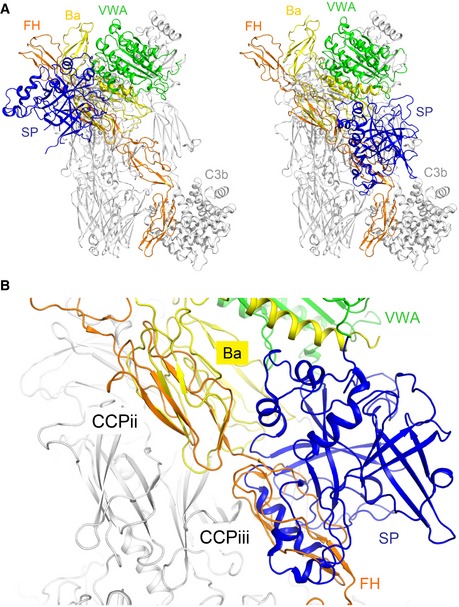
Cartoon representation of the superposition between C3b‐FH (CCP1–4) and the C3b‐FB complex in its closed (left, model based on the CVF‐FB structure (Janssen et al, 2009)) and “open” (right) states (PDB ID 2XWJ; Forneris et al, 2010).
Zoomed view of the superposition of C3b‐FH (CCP1–4) with the “open” state of C3b‐FB. The CCPii site shows complete overlap between FH CCP2 (orange) and FB CCP2 (yellow). In the “open” state of FB, the SP domain of the protease (blue) overlaps with the binding site for FH CCP3.

Mapping of known disease‐related mutations on C3b (Appendix Table S4). The high‐resolution C3b three‐dimensional structure is used as structural template, shown as white surface. The regulator contact surfaces (based on C3b‐FH (CCP1–4; Wu et al, 2009) and C3d‐FH (CCP19–20; Kajander et al, 2011; Morgan et al, 2011)) are shown as black contour. All mutations reported in Appendix Table S4 are shown in blue on the C3b surface. Disease‐related mutants reported to affect regulator binding are shown in red and labeled in the right magnified panel.
Mapping of disease‐related mutations on the FH (CCP1–4) surface using data from Appendix Table S5. Colors as in (A).
Mapping of disease‐related mutations on the MCP (CCP3–4) surface using data from Appendix Table S5. Colors as in (A).
References
-
- Adams EM, Brown MC, Nunge M, Krych M, Atkinson JP (1991) Contribution of the repeating domains of membrane cofactor protein (CD46) of the complement system to ligand binding and cofactor activity. J Immunol 147: 3005–3011 - PubMed
-
- Adams PD, Afonine PV, Bunkoczi G, Chen VB, Davis IW, Echols N, Headd JJ, Hung LW, Kapral GJ, Grosse‐Kunstleve RW, McCoy AJ, Moriarty NW, Oeffner R, Read RJ, Richardson DC, Richardson JS, Terwilliger TC, Zwart PH (2010) PHENIX: a comprehensive Python‐based system for macromolecular structure solution. Acta Crystallogr D Biol Crystallogr 66: 213–221 - PMC - PubMed
-
- Ahmad M, Pyaram K, Mullick J, Sahu A (2007) Viral complement regulators: the expert mimicking swindlers. Indian J Biochem Biophys 44: 331–343 - PubMed
-
- Ahmad M, Raut S, Pyaram K, Kamble A, Mullick J, Sahu A (2010) Domain swapping reveals complement control protein modules critical for imparting cofactor and decay‐accelerating activities in vaccinia virus complement control protein. J Immunol 185: 6128–6137 - PubMed
Publication types
MeSH terms
Substances
Grants and funding
LinkOut - more resources
Full Text Sources
Other Literature Sources
Miscellaneous
