. 2016 Dec;75(12):2192-2200.
doi: 10.1136/annrheumdis-2015-208476. Epub 2016 Mar 24.

Dysregulated bioenergetics: a key regulator of joint inflammation

Affiliations

Dysregulated bioenergetics: a key regulator of joint inflammation

M Biniecka et al. Ann Rheum Dis. 2016 Dec.

Abstract

Objectives: This study examines the relationship between synovial hypoxia and cellular bioenergetics with synovial inflammation.

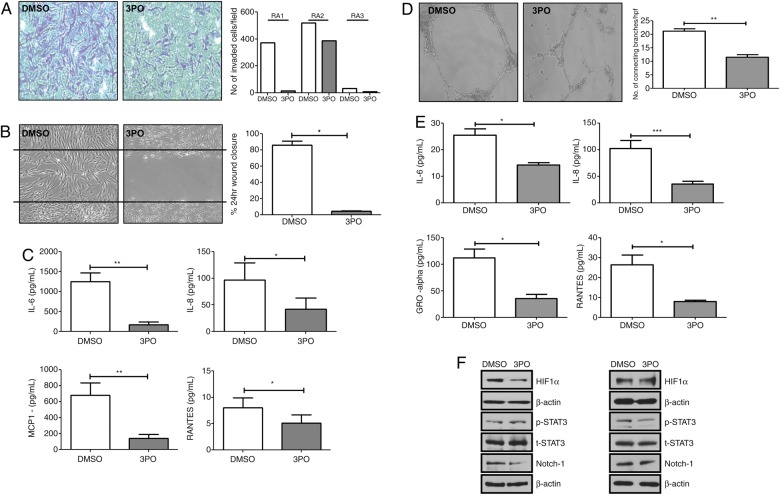
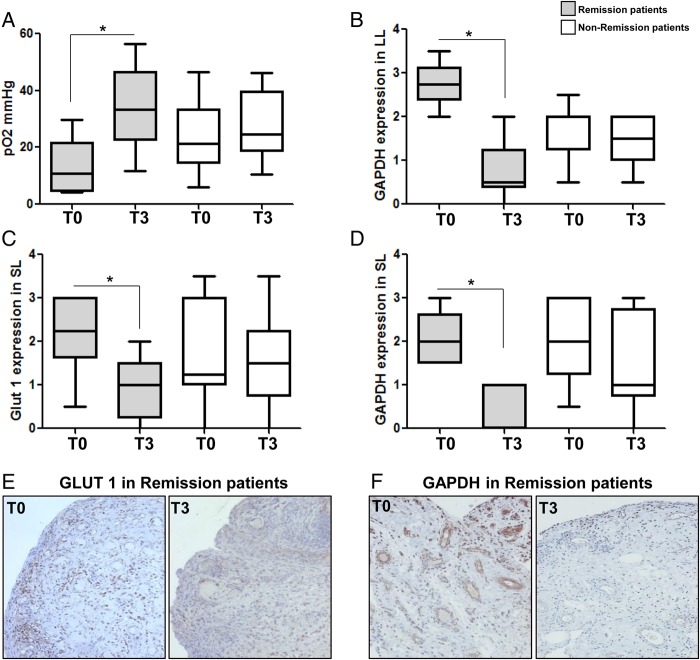
Methods: Primary rheumatoid arthritis synovial fibroblasts (RASF) were cultured with hypoxia, dimethyloxalylglycine (DMOG) or metabolic intermediates. Mitochondrial respiration, mitochondrial DNA mutations, cell invasion, cytokines, glucose and lactate were quantified using specific functional assays. RASF metabolism was assessed by the XF24-Flux Analyzer. Mitochondrial structural morphology was assessed by transmission electron microscopy (TEM). In vivo synovial tissue oxygen (tpO2 mmHg) was measured in patients with inflammatory arthritis (n=42) at arthroscopy, and markers of glycolysis/oxidative phosphorylation (glyceraldehyde 3-phosphate dehydrogenase (GAPDH), PKM2, GLUT1, ATP) were quantified by immunohistology. A subgroup of patients underwent contiguous MRI and positron emission tomography (PET)/CT imaging. RASF and human dermal microvascular endothelial cells (HMVEC) migration/angiogenesis, transcriptional activation (HIF1α, pSTAT3, Notch1-IC) and cytokines were examined in the presence of glycolytic inhibitor 3-(3-Pyridinyl)-1-(4-pyridinyl)-2-propen-1-one (3PO).

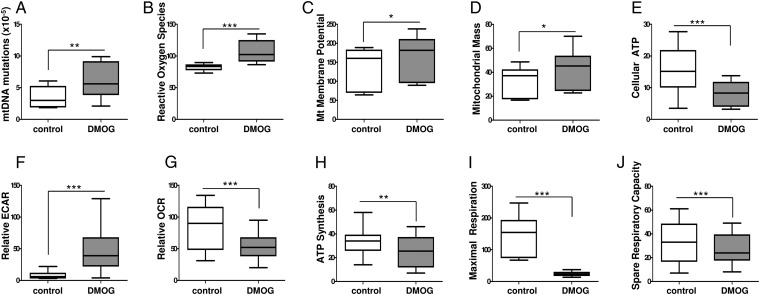
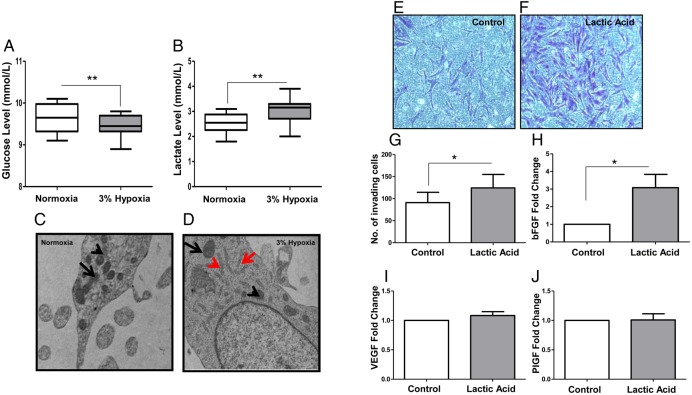
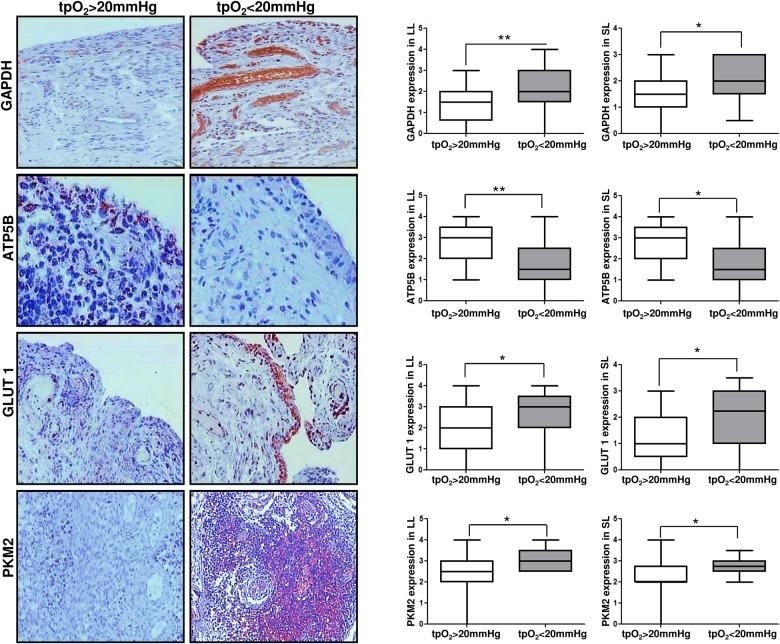
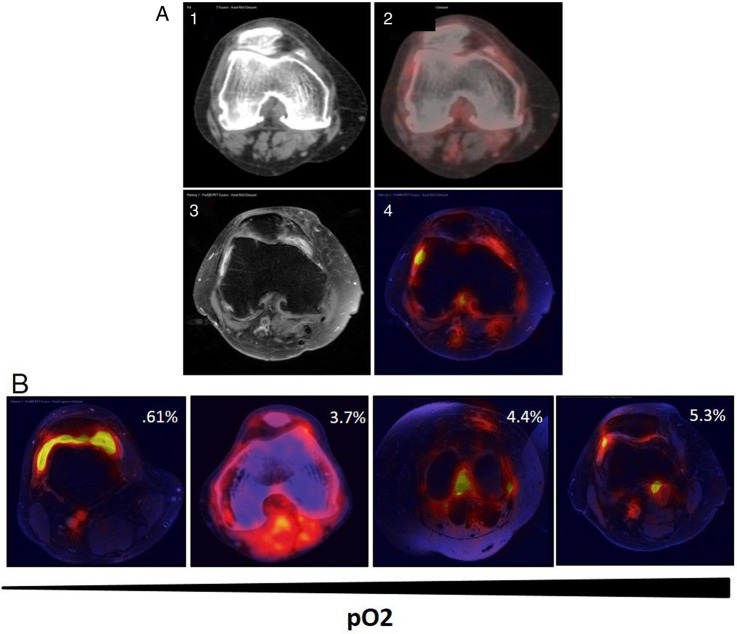
Results: DMOG significantly increased mtDNA mutations, mitochondrial membrane potential, mitochondrial mass, reactive oxygen species and glycolytic RASF activity with concomitant attenuation of mitochondrial respiration and ATP activity (all p<0.01). This was coupled with altered mitochondrial morphology. Hypoxia-induced lactate levels (p<0.01), which in turn induced basic fibroblast growth factor (bFGF) secretion and RASF invasiveness (all p<0.05). In vivo glycolytic markers were inversely associated with synovial tpO2 levels <20 mm Hg, in contrast ATP was significantly reduced (all p<0.05). Decrease in GAPDH and GLUT1 was paralleled by an increase in in vivo tpO2 in tumour necrosis factor alpha inhibitor (TNFi) responders. Novel PET/MRI hybrid imaging demonstrated close association between metabolic activity and inflammation. 3PO significantly inhibited RASF invasion/migration, angiogenic tube formation, secretion of proinflammatory mediators (all p<0.05), and activation of HIF1α, pSTAT3 and Notch-1IC under normoxic and hypoxic conditions.

Conclusions: Hypoxia alters cellular bioenergetics by inducing mitochondrial dysfunction and promoting a switch to glycolysis, supporting abnormal angiogenesis, cellular invasion and pannus formation.

Keywords: Fibroblasts; Inflammation; Rheumatoid Arthritis; Synovitis; TNF-alpha.


Conflict of interest statement

Conflicts of Interest: None declared.

Figures

Figure 1
Figure 1
Dimethyloxalylglycine (DMOG) induces mitochondrial dysfunction and glycolytic metabolism in RASF. (A–J) Box plots representing frequency of mitochondrial DNA mutation (A), reactive oxygen species (ROS) (B), mitochondrial membrane potential (MMP) (C), mitochondrial mass (MM) (D), ATP (E) extracellular acidification rates (ECAR) (F), basal oxygen consumption rates (OCR) (G), ATP synthesis (H), maximal respiration (I) and spare respiratory capacity (J), quantification in response to DMOG (1 mM) or vehicle control (1 mM) in primary RASF (n=7). Boxes represent the 25th to 75th centiles, lines within the boxes represent the median, and lines outside the boxes represent the 10th and 90th centiles. *p<0.05 statistically significant.
Figure 2
Figure 2
Hypoxia induces lactate, abnormal mitochondrial morphology, invasiveness and secretion of bFGF in RASF in vitro. RASF were cultured under normoxic and 3% hypoxic conditions for 24 h. Box plots represent glucose (A) and lactate (B) levels in RASF cultured supernatants (n=7). Boxes represent the 25th to 75th centiles, lines within the boxes represent the median, and lines outside the boxes represent the 10th and 90th centiles. *p<0.05 statistically significant. (C,D) Representative transmission electron microscopy images of RASF mitochondria under normoxic and 3% hypoxic conditions. Regular shaped mitochondria indicated by black arrows and irregular elongated mitochondria indicated by red arrows. Invasion was assessed using Biocoat Transwell invasion chambers following lactic acid treatment (1 mM) and representative images were taken (E,F). Following 24 h stimulation, invading cells attached to lower membrane were fixed (1% glutaraldehyde) and stained (0.1% crystal violet) (×40). (G) Quantification of RASF invasion (n=7). Quantification of bFGF (H), VEGF (I) and PIGF (J) in RASF supernatants following culture with lactic acid (1 mM) compared with basal (n=8). *p<0.05 statistically significant.
Figure 3
Figure 3
GAPDH, ATP5B, GLUT1 and PKM2 expression in synovial tissue is associated with in vivo synovial pO2 levels. Representative images and semiquantification of immunohistochemical staining for glycolytic and oxidative phosphorylation markers GAPDH, ATP5B, GLUT1 and PKM2 in lining layer (LL) and sublining layer (SL) of synovial tissue. GAPDH, ATP5B, GLUT1 and PKM2 quantification was categorised into patients with in vivo pO2 levels >20 mm Hg versus <20 mm Hg. Quantification was performed using a semiquantitative scoring method (0–4). Boxes represent the 25th to 75th centiles, lines within the boxes represent the median, and lines outside the boxes represent the 10th and 90th centiles. *p<0.05 statistically significant.
Figure 4
Figure 4
Co-localisation of metabolic activity and inflammation in vivo using hybrid PET/MRI images. Contiguous CT, PET and MRI scans from patients with rheumatoid arthritis were obtained and then fused to create hybrid PET/MRIs to co-localise metabolic activity and inflammation in the joint. (A) Representative images of axial CT slice (1), axial PET/CT (2), axial contrast-enhanced MRI (3) and hybrid PET/MRI fusion (4). (B) Representative images of four patients demonstrating co-localisation of metabolic activity and inflammation and in vivo synovial pO2 levels.
Figure 5
Figure 5
3PO inhibits proinflammatory mechanisms in RASF and HMVEC cells. RASF (left panel) and HMVEC (right panel) were cultured in the presence of the glycolytic inhibitor 3PO (20 µM). Invasion was assessed using Biocoat Transwell invasion chambers following RASF treatment with 3PO (n=3) and representative images and quantification is shown in (A). Representative images of inhibition of RASF migration following 3PO treatment and quantification of wound repair (n=6) are shown in (B). (C) Quantification of interleukin (IL) 6, IL-8, MCP-1 and RANTES in RASF supernatants following RASF culture with 3PO compared with basal (n=9). Representative images and quantification of HMVEC tube formation in response to 3PO (D). Quantification of IL-6, IL-8, GRO and RANTES in HMVEC supernatants following culture with 3PO compared with basal (n=8) (E). Representative western blots are shown in (F) for HIF1α, pSTAT3, tSTAT3, Notch1 and βactin in both K4IM (left panel) and HMVEC (right panel) following 3PO treatment under hypoxia. *p<0.05 statistically significant.
Figure 6
Figure 6
Successful TNFi treatment increases synovial pO2 levels while decreasing expression of GAPDH and GLUT1. Improvements in synovial pO2 levels in patients who responded to TNFi treatment after 3 months compared with non-responders (A). (B–F) Representative images and semiquantification of immunohistochemical staining for glycolytic marker GAPDH in the lining layer (LL) and sublining layer (SL) of synovial tissue and GLUT1 in the SL of synovial tissue. GAPDH and GLUT1 quantification was categorised into patients who were either responders or non-responders to treatment. Quantification was performed using a semiquantitative scoring method (0–4). Boxes represent the 25th to 75th centiles, lines within the boxes represent the median, and lines outside the boxes represent the 10th and 90th centiles. *p<0.05 statistically significant.

References

    1. Chang X, Wei C. Glycolysis and rheumatoid arthritis. Int J Rheum Dis 2011;14:217–22. 10.1111/j.1756-185X.2011.01598.x - DOI - PubMed
    1. Scrivo R, Vasile M, Müller-Ladner U, et al. . Rheumatic diseases and obesity: adipocytokines as potential comorbidity biomarkers for cardiovascular diseases. Mediators Inflamm 2013;2013:808125 10.1155/2013/808125 - DOI - PMC - PubMed
    1. Choy E, Ganeshalingam K, Semb AG, et al. . Cardiovascular risk in rheumatoid arthritis: recent advances in the understanding of the pivotal role of inflammation, risk predictors and the impact of treatment. Rheumatology (Oxford) 2014;53:2143–54. 10.1093/rheumatology/keu224 - DOI - PMC - PubMed
    1. Jiang P, Li H, Li X. Diabetes mellitus risk factors in rheumatoid arthritis: a systematic review and meta-analysis. Clin Exp Rheumatol 2015;33:115–21. - PubMed
    1. Reece RJ, Canete JD, Parsons WJ, et al. . Distinct vascular patterns of early synovitis in psoriatic, reactive, and rheumatoid arthritis. Arthritis Rheum 1999;42:1481–4. 10.1002/1529-0131(199907)42:7<1481::AID-ANR23>3.0.CO;2-E - DOI - PubMed