

EHDViz: clinical dashboard development using open-source technologies
- PMID: 27013597
- PMCID: PMC4809078
- DOI: 10.1136/bmjopen-2015-010579
EHDViz: clinical dashboard development using open-source technologies
Abstract
Objective: To design, develop and prototype clinical dashboards to integrate high-frequency health and wellness data streams using interactive and real-time data visualisation and analytics modalities.
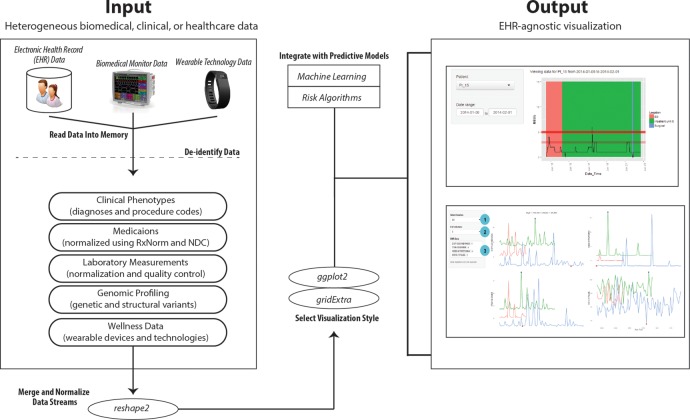
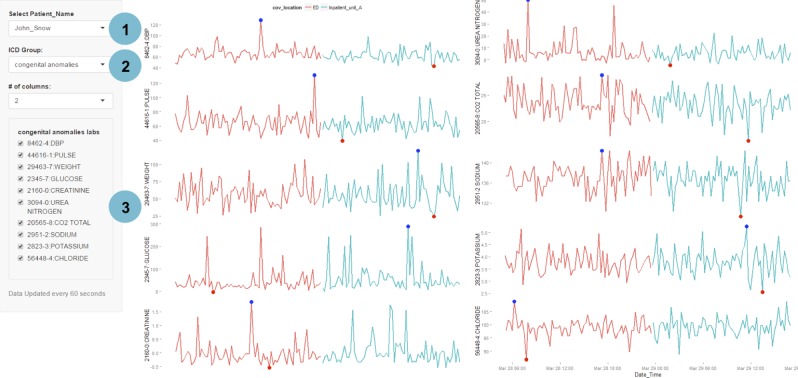
Materials and methods: We developed a clinical dashboard development framework called electronic healthcare data visualization (EHDViz) toolkit for generating web-based, real-time clinical dashboards for visualising heterogeneous biomedical, healthcare and wellness data. The EHDViz is an extensible toolkit that uses R packages for data management, normalisation and producing high-quality visualisations over the web using R/Shiny web server architecture. We have developed use cases to illustrate utility of EHDViz in different scenarios of clinical and wellness setting as a visualisation aid for improving healthcare delivery.
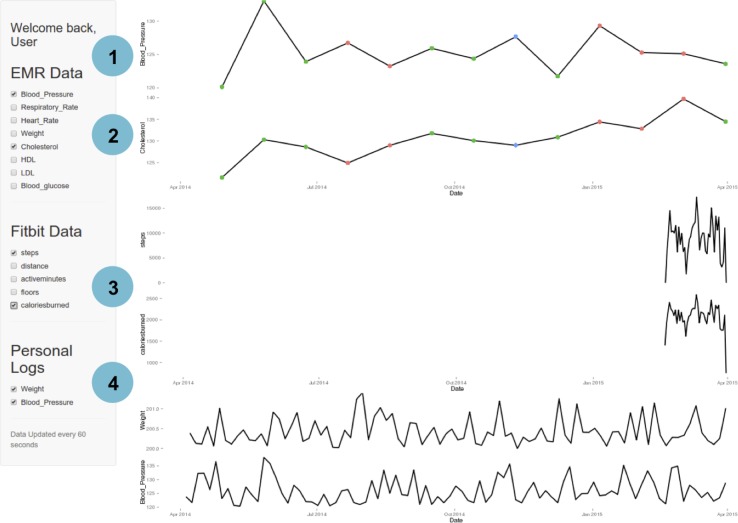
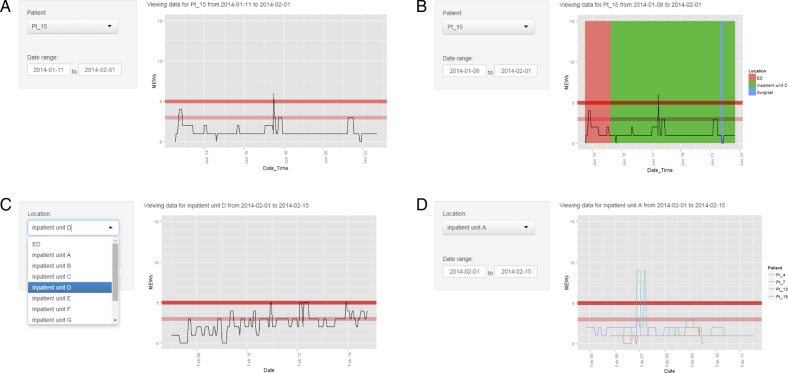
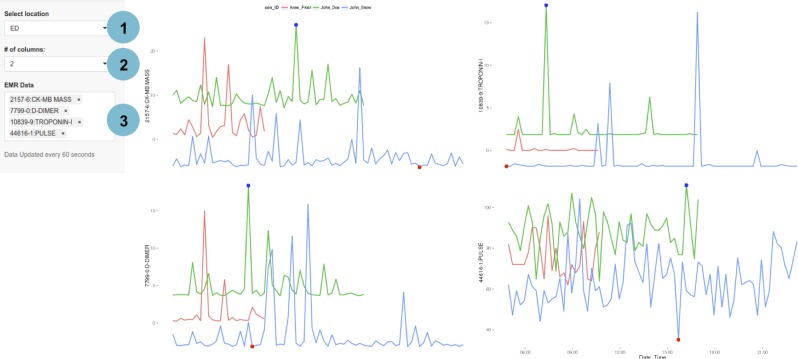
Results: Using EHDViz, we prototyped clinical dashboards to demonstrate the contextual versatility of EHDViz toolkit. An outpatient cohort was used to visualise population health management tasks (n=14,221), and an inpatient cohort was used to visualise real-time acuity risk in a clinical unit (n=445), and a quantified-self example using wellness data from a fitness activity monitor worn by a single individual was also discussed (n-of-1). The back-end system retrieves relevant data from data source, populates the main panel of the application and integrates user-defined data features in real-time and renders output using modern web browsers. The visualisation elements can be customised using health features, disease names, procedure names or medical codes to populate the visualisations. The source code of EHDViz and various prototypes developed using EHDViz are available in the public domain at http://ehdviz.dudleylab.org.
Conclusions: Collaborative data visualisations, wellness trend predictions, risk estimation, proactive acuity status monitoring and knowledge of complex disease indicators are essential components of implementing data-driven precision medicine. As an open-source visualisation framework capable of integrating health assessment, EHDViz aims to be a valuable toolkit for rapid design, development and implementation of scalable clinical data visualisation dashboards.
Keywords: biomedical informatics; clinical dashboard; clinical decision systems; data visuzalization; early warning systems.
Published by the BMJ Publishing Group Limited. For permission to use (where not already granted under a licence) please go to http://www.bmj.com/company/products-services/rights-and-licensing/
Figures
References
-
- Powsner SM, Tufte ER. Graphical summary of patient status. Lancet 1994;344:386–9. http://www.ncbi.nlm.nih.gov/pubmed/7914312 (accessed 12 Sep 2014). - PubMed
-
- Merry P. Healthcare information. Slow to learn. Health Serv J 1997;107:28–9. http://www.ncbi.nlm.nih.gov/pubmed/10169554 (accessed 19 Mar 2015). - PubMed
Publication types
MeSH terms
Grants and funding
LinkOut - more resources
Full Text Sources
Other Literature Sources
Medical
Research Materials