. 2016 May 27;291(22):11657-75.
doi: 10.1074/jbc.M115.688218. Epub 2016 Mar 24.

Receptor Activity-modifying Proteins 2 and 3 Generate Adrenomedullin Receptor Subtypes with Distinct Molecular Properties

Affiliations

Receptor Activity-modifying Proteins 2 and 3 Generate Adrenomedullin Receptor Subtypes with Distinct Molecular Properties

Harriet A Watkins et al. J Biol Chem. .

Abstract

Adrenomedullin (AM) is a peptide hormone with numerous effects in the vascular systems. AM signals through the AM1 and AM2 receptors formed by the obligate heterodimerization of a G protein-coupled receptor, the calcitonin receptor-like receptor (CLR), and receptor activity-modifying proteins 2 and 3 (RAMP2 and RAMP3), respectively. These different CLR-RAMP interactions yield discrete receptor pharmacology and physiological effects. The effective design of therapeutics that target the individual AM receptors is dependent on understanding the molecular details of the effects of RAMPs on CLR. To understand the role of RAMP2 and -3 on the activation and conformation of the CLR subunit of AM receptors, we mutated 68 individual amino acids in the juxtamembrane region of CLR, a key region for activation of AM receptors, and determined the effects on cAMP signaling. Sixteen CLR mutations had differential effects between the AM1 and AM2 receptors. Accompanying this, independent molecular modeling of the full-length AM-bound AM1 and AM2 receptors predicted differences in the binding pocket and differences in the electrostatic potential of the two AM receptors. Druggability analysis indicated unique features that could be used to develop selective small molecule ligands for each receptor. The interaction of RAMP2 or RAMP3 with CLR induces conformational variation in the juxtamembrane region, yielding distinct binding pockets, probably via an allosteric mechanism. These subtype-specific differences have implications for the design of therapeutics aimed at specific AM receptors and for understanding the mechanisms by which accessory proteins affect G protein-coupled receptor function.

Keywords: G protein-coupled receptor (GPCR); GPCR; RAMP; adrenomedullin; allosteric regulation; cardiovascular disease; conformational change; extracellular loops; molecular modeling; receptor activity-modifying protein.


Figures

FIGURE 1.
FIGURE 1.
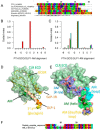
Modeling the AM peptide. A, selected class B peptide alignments. Homologs of each of PTH, glucagon, and GLP-1 were aligned against AM homologs in a multireference profile alignment, as described by Lock et al. (36), over the helical region denoted X. B, the multireference alignment scores. Alignment 0, corresponding to the alignment in A, has the highest score; the next highest score (alignment −4) corresponds to moving the AM helix 4 residues to the left, but this alternative score is low. C, as for B but missing PTH (red), glucagon (green), or GLP-1 (cyan); the results are presented as a control. D, a structural alignment of CLR (light green surface, schematic)/AM(35–52) (dark green schematic), GLP-1R (orange schematic)/exendin-4 (wheat/orange schematic), and GCGR (yellow schematic)/glucagon Thr7–Tyr13 (yellow). The AM(23–52) comparative modeling template was taken from AM(35–52) and glucagon Thr7–Tyr13. The exendin-4 is largely wheat-colored, but the region corresponding to Thr7–Tyr13 of glucagon is orange. E, the final AM(16–52) structure (black schematic, used as one of the templates for modeling the AM receptor) structurally aligned to the CLR ECD. The various components of AM are shown as color-coded transparent spheres: yellow, carbon atoms (disulfide-bonded loop); green, carbon atoms (helix); cyan, carbon atoms (loop); blue, carbon atoms (from the original x-ray structure). The final structure is very similar to this initial template structure. F, the alignment for the comparative modeling of AM(23–52).
FIGURE 2.
FIGURE 2.
The template structure of RAMP docked to an active model of CLR. The template structure (gray) was generated as follows. The length of the TM helix for RAMP1 is given as 21 residues by UniProt, but this is too short for a tilted helix to span the membrane. Consequently, for RAMP1, helices of lengths 26, 28, and 30 residues were constructed using Maestro, commencing at Ser117, Pro115, and Asp113, respectively. For RAMP2, helices of length 24, 26, and 28 residues were constructed, commencing at Asp144, Pro142, and Asp140, respectively. For RAMP3, helices of lengths 25, 26, and 28 residues were constructed, commencing at Asp116, Pro115, and Asp113, respectively. The helices were docked using the Cluspro, PatchDock, and SwarmDock servers to two active models of the CLR transmembrane helical bundle (six docking experiments) (30, 65–67); the active explicit membrane CLR model has been shown to be in very good agreement with the x-ray crystal structures of the GCGR and CRF1R (26). Results from each server that were not compatible with the membrane topology were eliminated, and the remaining viable solutions were clustered. Representative solutions were then refined and rescored using the FireDock server (so that poses generated by the different servers are treated equally) (68, 69). The three best poses (on the basis of lowest energy and geometry consensus) were then docked using RosettaDock (70–72). The consensus result showed a preference for the helix to dock to TM7 of the active receptor, in agreement with experimental results that indicate an interaction with TM6/7 (60). The active AM1 (light blue) and AM2 (wheat) model TM domains, the inactive GCGR (yellow), and TM1–TM4 of inactive CRF1R (orange) structures, superimposed over TM1, TM2, TM3, the top of TM4 (because of irregularities in the GCGR x-ray structure; c.f. CRF1R), and TM7, are also shown. TM5, TM6, and the top of TM7 were omitted from the fitting because of differences in active and inactive structures in this region. All root mean square deviations were <2 Å.
FIGURE 3.
FIGURE 3.
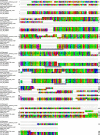
The alignment for comparative modeling. The alignment was generated by structural alignment of the templates using the SALIGN module of MODELER and refined using Jalview (73). The residues are color-coded according to their properties as follows: blue, positive; red, negative or small polar; purple, polar; green large hydrophobic; yellow, small hydrophobic; cyan, polar, aromatic. This corresponds to the “Taylor” scheme, as implemented in Jalview. The extracellular loops are denoted by gray shading and the loop number.
FIGURE 4.
FIGURE 4.
Examples of mutants with common effects on cAMP production in both the AM1 and AM2 receptors. Concentration-response curves are combined normalized data ± S.E. (error bars) for at least three individual experiments.
FIGURE 5.
FIGURE 5.
Examples of mutants with common-differential and differential (C282A and Y277A) effects on cAMP production between the AM receptors. WT curves were included in every experiment but are only shown as examples for L195A so that mutant differences between the receptors are not obscured by these curves in the other panels. The horizontal line represents maximal (100%) cAMP accumulation for the WT receptors. Concentration-response curves are combined normalized data ± S.E. (error bars) for at least three individual experiments.
FIGURE 6.
FIGURE 6.
125I-AM(13–52) binding at selected mutants with common-differential and differential (Y277A and C282A) effects in cAMP assays. The curves are combined normalized data ± S.E. (error bars) for three individual experiments.
FIGURE 7.
FIGURE 7.
Models of the full-length AM receptors. A, AM1 receptor; B, AM2 receptor. Images were generated from an overlay aligning CLR residues 138–394 for both models (root mean square deviation = 2.0 Å). Relative sizes and orientations are thus not an artifact of figure generation. C, surface representation of the peptide binding pocket of the AM1 and AM2 receptors illustrating the changes in receptor conformation and the peptide binding pocket. D, close-up surface representation of the peptide binding pocket showing the docked AM peptide and its five close receptor neighbors, determined by the models in blue sticks (AM1 receptor) and yellow sticks (AM2 receptor). Other colors in C and D are as described for A and B.
FIGURE 8.
FIGURE 8.
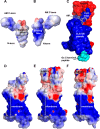
The electrostatic potential of AM, CLR, and the AM1 and AM2 receptors. Blue, positive; red, negative; the potential has been contoured between −5 and +5 onto the solvent-accessible surface. A, the electrostatic potential on the face of AM that is exposed as it binds to the CLR ECD; the electrostatic potential is weakly positive, and the general orientation is as shown in C. B, the electrostatic potential on the ECD-binding surface, as defined by C; the electrostatic potential is strongly positive. The +4 charge on AM includes the N-terminal amine. C, a representation of AM binding to the AM1 receptor that can be used to identify the peptide-binding region in D–F: the CLR solvent-accessible surface is blue, the RAMP surface is red, and the C-terminal peptide of Gs is cyan. The solvent radius was expanded to 2.4 Å to mimic that in D–F. AM is shown in white. D, CLR electrostatic potential. E, AM1 electrostatic potential. F, AM2 electrostatic potential. The electrostatic potential of the AM1 and AM2 receptors was evaluated in an implicit membrane using APBS (the Adaptive Poisson-Boltzmann Solver) coupled with apbs_mem version 2.0 and the pdb2PQR server (74–76). The parameters for the APBSmem calculations were as follows: PARSE atomic charges (77); temperature, 298.15 K; ionic strength, 0.15 mm; protein and membrane relative dieletric constant, 2.0; relative solvent dielectric, 80; membrane thickness, 40 Å. The grid lengths were 300 × 300 × 300 Å with two levels of focusing; the grid dimensions were 97 × 97 × 97 for A and B and 129 × 129 × 225 for D–F. The CHARMM-gui was used to assist in placing the receptor within the membrane (78).
FIGURE 9.
FIGURE 9.
Receptor model overlay. Residues with common (A), common-differential (B), or differential (C) effects are shown as sticks, with oxygen atoms in red and nitrogen in blue. A, residues Ala199, Asp280, Ile284, and Phe349 have similar side chain and main chain orientations; Tyr365 has side chain rotation of ∼180° between the two AM receptors. B, residues Lys213, Ile352, and Trp354 have similar main chain but differing side chain orientations. C, Tyr277 shows substantial movement between the two receptors, whereas Tyr278 shows some movement but maintains similar interactions. D, close-up view of TM6-ECL3-TM7 showing the main residues involved in the change of the ECL3 position (red arrow denotes change in position). The increased proximity of RAMP2 to the CLR ECL3 in the AM1 receptor is clearly visible. AM1 and AM2 receptors are colored as per the figure; the movement of residues between the receptors is shown with arrows. E and F, juxtamembrane region of the two receptors with distances between residues (dotted lines) in Å. Distances were measured between the same set of Cα atoms in both receptors.
FIGURE 10.
FIGURE 10.
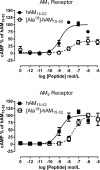
Concentration-response curves for the alanine-substituted AM peptide, F18A AM(15–52). Curves are combined normalized data from at least three individual experiments ± S.E. (error bars).
FIGURE 11.
FIGURE 11.
Small molecule druggable sites predicted using PockDrug and viewed from above. A, the AM1 site is shown in light blue, and the site residues that contact AM are shown in blue. B, the AM2 site is shown in magenta, and the site residues that contact AM are shown in red. This site is narrower and deeper than the AM1 site; the PockDrug druggability scores for the AM1 and AM2 sites are 0.97 and 0.91, respectively. C and D, surface cutaway views of the receptors; the different size, conformation, and situation of the pockets are evident from the shading. Selected residues are labeled.

References

    1. Nishikimi T., Kuwahara K., Nakagawa Y., Kangawa K., and Nakao K. (2013) Adrenomedullin in cardiovascular disease: a useful biomarker, its pathological roles and therapeutic application. Curr. Protein Pept. Sci. 14, 256–267 - PubMed
    1. Manuela C., Laura S., Benedetta S., Raffaele C., Alessandro V., Chiara C., Tommaso P., Daniela G., and Silvia D. R. (2014) Adrenomedullin and intermedin gene transcription is increased in leukocytes of patients with chronic heart failure at different stages of the disease. Peptides 55, 13–16 - PubMed
    1. Wong C. P., Loh S. Y., Loh K. K., Ong P. J., Foo D., and Ho H. H. (2012) Acute myocardial infarction: clinical features and outcomes in young adults in Singapore. World J. Cardiol. 4, 206–210 - PMC - PubMed
    1. Burley D. S., Hamid S. A., and Baxter G. F. (2007) Cardioprotective actions of peptide hormones in myocardial ischemia. Heart Fail. Rev. 12, 279–291 - PubMed
    1. Nagaya N., Nishikimi T., Uematsu M., Satoh T., Oya H., Kyotani S., Sakamaki F., Ueno K., Nakanishi N., Miyatake K., and Kangawa K. (2000) Haemodynamic and hormonal effects of adrenomedullin in patients with pulmonary hypertension. Heart 84, 653–658 - PMC - PubMed

Publication types

MeSH terms

Substances

LinkOut - more resources