. 2016 Mar 23;36(12):3430-40.
doi: 10.1523/JNEUROSCI.1787-15.2016.

Experience Affects Critical Period Plasticity in the Visual Cortex through an Epigenetic Regulation of Histone Post-Translational Modifications

Affiliations

Experience Affects Critical Period Plasticity in the Visual Cortex through an Epigenetic Regulation of Histone Post-Translational Modifications

Laura Baroncelli et al. J Neurosci. .

Abstract

During an early phase of enhanced sensitivity called the critical period (CP), monocular deprivation causes a shift in the response of visual cortex binocular neurons in favor of the nondeprived eye, a process named ocular dominance (OD) plasticity. While the time course of the CP for OD plasticity can be modulated by genetic/pharmacological interventions targeting GABAergic inhibition, whether an increased sensory-motor experience can affect this major plastic phenomenon is not known. We report that exposure to environmental enrichment (EE) accelerated the closure of the CP for OD plasticity in the rat visual cortex. Histone H3 acetylation was developmentally regulated in primary visual cortex, with enhanced levels being detectable early in enriched pups, and chromatin immunoprecipitation revealed an increase at the level of the BDNF P3 promoter. Administration of the histone deacetylase inhibitor SAHA (suberoylanilide hydroxamic acid) to animals reared in a standard cage mimicked the increase in H3 acetylation observed in the visual cortex and resulted in an accelerated decay of OD plasticity. Finally, exposure to EE in adulthood upregulated H3 acetylation and was paralleled by a reopening of the CP. These findings demonstrate a critical involvement of the epigenetic machinery as a mediator of visual cortex developmental plasticity and of the impact of EE on OD plasticity.

Significance statement: While it is known that an epigenetic remodeling of chromatin structure controls developmental plasticity in the visual cortex, three main questions have remained open. Which is the physiological time course of histone modifications? Is it possible, by manipulating the chromatin epigenetic state, to modulate plasticity levels during the critical period? How can we regulate histone acetylation in the adult brain in a noninvasive manner? We show that the early exposure of rat pups to enriching environmental conditions accelerates the critical period for plasticity in the primary visual cortex, linking this effect to increased histone acetylation, specifically at the BDNF gene level. Moreover, we report that the exposure of adult animals to environmental enrichment enhances histone acetylation and reopens juvenile-like plasticity.

Keywords: BDNF; critical period; histone acetylation; ocular dominance plasticity.


Figures

Figure 1.
Figure 1.
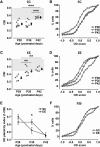
Early environmental enrichment accelerates the critical period for OD plasticity. A, Filled circles represent the average CBI ±SEM for each experimental group; open symbols represent individual CBIs for each animal. At P28 and P35, the CBIs of SC-reared animals were comparable, indicating a clear OD shift toward the open eye (P28: n = 9, CBI = 0.37 ± 0.03; P35: n = 8, CBI = 0.38 ± 0.03; one-way ANOVA, post hoc Holm–Sidak method, p = 0.964); at P42, the CBI of SC-reared rats differed from those of the previous two ages (n = 6, CBI = 0.55 ± 0.01; p < 0.001 for both comparisons) as a result of a reduced OD plasticity. The gray box denotes the CBI range in adult normal animals calculated as the mean ± 2*SD from recordings of adult naive rats. B, Analogously to CBI, the OD score distributions for P28 animals (n = 9; 202 cells) and P35 animals (n = 8, 181 cells) did not differ (Kolmogorov–Smirnov test, p = 0.924), whereas the OD score distribution for P42 rats (n = 6, 131 cells) was different from those of the two other ages (p < 0.001 for both comparisons). C, The CBI of enriched animals was shifted toward the not-deprived eye only at P28, when it significantly differed from that at both P35 and P42 (P28: n = 5, CBI = 0.30 ± 0.03; P35: n = 7, CBI = 0.48 ± 0.04; P42: n = 5, CBI = 0.54 ± 0.03; one-way ANOVA, post hoc Holm–Sidak method, p < 0.01 for both comparisons); starting from P35, enriched rats displayed an earlier closure of OD plasticity, as indicated by their higher CBI, which did not differ from that recorded at P42 (p = 0.299). The gray box denotes the CBI range in adult normal animals calculated as the mean ±2*SD from recordings of adult naive rats. D, The results obtained with the CBI were confirmed by those with computation of OD score in enriched animals: indeed, the OD score distribution for P28 animals (n = 8; 97 cells) differed from that at both P35 (n = 7, 161 cells) and P42 (n = 5, 104 cells; Kolmogorov–Smirnov test, p < 0.01 for P28 vs P35; p < 0.001 for P28 vs P42). The OD score distributions for P35 and P42 groups were not different (p = 0.088). E, A plasticity index for each animal was calculated as 1 − CBI. Two-way ANOVA showed an interaction between age and environmental housing conditions (p < 0.05). A post hoc Holm–Sidak test revealed a difference (*) at P35 between SC and EE groups (p < 0.05). F, OD score cumulative distributions for the P35 SC and EE groups differed (Kolmogorov–Smirnov test, p < 0.05). The asterisks indicates statistical significance: *p < 0.05; **p < 0.01; ***p < 0.001. Data are expressed as the mean ± SEM.
Figure 2.
Figure 2.
Similar basic cell properties in enriched and standard-reared animals. We analyzed cell responsiveness and receptive field (RF) size in the same animals in which OD evaluation was performed. A, Cell responsiveness for each unit was expressed as the ratio between the peak response and the mean baseline activity obtained by optimal stimulation of the preferred eye. Data are represented as box charts. For each box chart, the central horizontal line represents the median value, and the other two horizontal lines are the 25th and 75th percentiles; error bars denote the 5th and 95th percentiles; square symbols denote the mean value. No statistical difference in cell responsiveness was found among the experimental groups (two-way ANOVA on ranks, p = 0.243). B, RF size for each cell was calculated on the basis of the peristimulus time histogram obtained by optimal stimulation of the preferred eye and was expressed in degrees (°) of visual angle. No differences in receptive field size distribution were detected among the experimental groups (mean RF size: P28-SC = 18.6° ± 0.7°; P28-EE = 16.7° ± 0.9°; P35-SC = 16.6° ± 1.1°; P35-EE = 17.1° ± 1.1°; P42-SC = 15.5° ± 1.5°; P42-EE = 14.6° ± 2.3°; two-way ANOVA, p = 0.474). Data are expressed as the mean ± SEM.
Figure 3.
Figure 3.
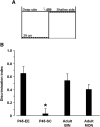
Depth perception abilities are not altered by the acceleration of critical period timing in enriched rats. A, In an explorative version of the visual cliff task, P45 SC animals (n = 17, exploration index = 0.401 ± 0.073) and EE animals (n = 12, exploration index = 0.541 ± 0.100) displayed a preference for the shallow side, thus revealing the maturation of proper stereopsis abilities. B, The discrimination index scores did not differ between the two experimental groups (one-way ANOVA, post hoc Holm–Sidak method, p = 0.409), and, importantly, it was also not significantly different from that recorded in adult naive animals with normal binocular vision (adult BIN: n = 9, exploration index = 0.652 ± 0.101; one-way ANOVA, post hoc Holm–Sidak method, p = 0.147 and p = 0.409 respectively); instead, adult rats with one eye closed through eyelid suture exhibited a prominent change in their discrimination index (adult MON: n = 9; exploration index = 0.028 ± 0.077), equally exploring the deep and the shallow sides of the arena (one-way ANOVA, post hoc Holm–Sidak method, p < 0.05 for all comparison with adult MON animals). The asterisk indicates statistical significance: *p < 0.05. Data are expressed as the mean ± SEM.
Figure 4.
Figure 4.
Developmental regulation of histone acetylation in V1: effects of exposure to EE. The ratio between the intensity of the bands of acetyl-H3 and total H3 (AcH3/H3 ratio) was used as an index for measuring the amount of acetylated H3. A, A representative immunoblot showing protein levels in the visual cortex of SC-reared rats at P15 (n = 11), P25 (n = 11), P45 (n = 9), P60 (n = 9), and P90 (n = 8). In each gel, the AcH3/H3 ratio measured for all samples was normalized to the mean ratio calculated for the control group (P60 animals). B, Quantification of acetylated H3 levels showed a developmental regulation in the primary visual cortex of SC-reared rats. A Kruskal–Wallis one-way ANOVA on ranks revealed a significant effect of age (p < 0.001). C, A representative Western blot gel displaying protein levels in the visual cortex of P15, P25, P45, and P60 animals reared either in SC or EE conditions (EE-P15, n = 4; EE-P25, n = 6; EE-P45, n = 7; EE-P60, n = 6). In each gel, the AcH3/H3 ratio measured for all samples was normalized to the mean ratio calculated for the control group (SC animals for each age). D, Percentage of variation of AcH3/H3 ratio in the visual cortices of rats reared under SCs and with EE computed as [(EE/SC-1) × 100] at different ages. Acetylated H3 levels were significantly increased in the visual cortex of EE animals at P15 (Mann–Whitney rank sum test, p < 0.05), while they did not differ between SC and EE groups at the other ages tested (t test, p = 0.994 for P25; Mann–Whitney rank sum test, p = 0.535 for P45; t test, p = 0.850 for P60). The asterisk indicates statistical significance: *p < 0.05. Data are expressed as the mean ± SEM.
Figure 5.
Figure 5.
Exposure to EE enhances H3 acetylation at the BDNF promoter 3. A, Schematic diagram of the structure of the rat BDNF gene. Boxes represent exons, and lines represent introns. BDNF exons I to IV are shown as checkered boxes and are directed by promoters I to IV, shown as right-angled arrows. B, Levels of H3 acetylation at the BDNF promoter 3 in rats reared with EE and under SCs at P15 (n = 4 in both groups), calculated as mean fold changes over SC-reared controls. A t test revealed a significant increase in the fold change for EE rats compared with SC-reared animals (p < 0.05). C, Levels of exon 3 BDNF mRNA normalized over total BDNF mRNA in rats reared with EE and under SCs at P15 (n = 4 in both groups). A t test revealed a significant increase in the fold change for EE rats compared with SC-reared animals (p < 0.05). The asterisk indicates statistical significance: *p < 0.05. Data are expressed as the mean ± SEM.
Figure 6.
Figure 6.
Injection of a histone deacetylase inhibitor mimics increased H3 acetylation. A, A representative Western blot filter displays protein levels in the visual cortex of animals raised under SCs (n = 8), and those treated with SAHA (n = 5) and DMSO (n = 7) at P15. In each gel, the AcH3/H3 ratio measured for all samples was normalized to the mean ratio calculated for the control group (SC of the same age). B, Quantification of acetylated H3 levels showed that acetylation levels were significantly increased in the visual cortex of SAHA animals, while the AcH3/H3 ratio of DMSO rats was not different from that measured in the SC control group (Kruskal–Wallis one-way ANOVA on ranks vs controls, post hoc Dunn's method). The asterisk indicates statistical significance: *p < 0.05. Data are expressed as the mean ± SEM.
Figure 7.
Figure 7.
Injection of a histone deacetylase inhibitor mimics accelerated closure of OD plasticity. A, CBI values for animals raised under SCs (n = 8, 0.38 ± 0.03), and those treated with SAHA (n = 5, 0.51 ± 0.03) and DMSO (n = 7, 0.41 ± 0.04). Filled circles represent the average CBI ±SEM for each experimental group; open symbols represent individual CBIs for each animal. At P35, the CBI of DMSO-treated rats was not significantly different from that of SC animals, whereas the visual cortex driving force in SAHA rats remained significantly shifted toward the contralateral (deprived) eye (one-way ANOVA vs control, post hoc Holm–Sidak method). The gray box denotes the CBI range in adult normal animals calculated as the mean ± 2*SD from recordings of adult naive rats. B, OD score distribution for animals raised under SCs (181 cells) and those treated with DMSO (147 cells) did not significantly differ between each other (Kolmogorov–Smirnov test, p = 0.540), whereas OD distribution for the SAHA-treated group (109 cells) was significantly shifted in favor of the deprived eye (Kolmogorov–Smirnov test, p < 0.01 for both comparisons). C, D, The functional basic properties of visual cortical neurons were not affected in SAHA- and DMSO-treated animals. The data for cell responsiveness are represented as box charts. No statistical differences were present among all groups for either cell responsiveness (C, Kruskal–Wallis one-way ANOVA on ranks, p = 0.939) or RF size distribution (mean RF size: SC = 16.6° ± 1.1°; SAHA = 18.5° ± 1.6°; DMSO = 19.0° ± 0.9°; one-way ANOVA, p = 0.289). The asterisk indicates statistical significance: *p < 0.05. Data are expressed as the mean ± SEM.
Figure 8.
Figure 8.
Environmental enrichment restores OD plasticity in adulthood and increases H3 acetylation in the visual cortex of adult animals. A, Filled symbols represent the average CBI ±SEM for each experimental group; open symbols represent the CBI of each individual recorded. After 7 d of MD, the CBI of SC rats was completely comparable to that of noMD-SC animals (SC rats: n = 7, CBI = 0.59 ± 0.04; noMD-SC: n = 5, CBI = 0.64 ± 0.04; one-way ANOVA, post hoc Holm–Sidak method, p = 0.342), whereas the CBI of EE rats (n = 8; CBI = 0.43 ± 0.03) significantly differed from those of the two control groups (one-way ANOVA, post hoc Holm–Sidak method, p < 0.01 for both comparisons). B, No statistical difference in cell responsiveness was present among noMD-SC (132 cells), SC (189 cells), and EE animals (211 cells; Kruskal–Wallis one-way ANOVA on ranks, p = 0.749). Data are represented as box charts. C, EE exposure did not alter the receptive field size distribution of the cell population (mean RF size: noMD-SC = 13.7° ± 1.8°; SC = 11.9° ± 0.6°; EE = 12.1° ± 0.9°; one-way ANOVA, p = 0.515). D, Inset, A representative immunoblot showing protein levels in the visual cortex of animals of different experimental groups (animals reared under SCs and animals reared with EE for 14 d). In each gel, the AcH3/H3 ratio measured for all samples was normalized to the mean ratio calculated for the control group (SCs). Quantification of acetylated H3 levels revealed that EE conditions significantly increased histone acetylation in the adult visual cortex (SCs: n = 8; EE: n = 7; t test, p < 0.05). Data are expressed as the mean ± SEM. The asterisks denote significant differences: *p < 0.05; **p < 0.01.

References

    1. Abidin I, Eysel UT, Lessmann V, Mittmann T. Impaired GABAergic inhibition in the visual cortex of brain-derived neurotrophic factor heterozygous knockout mice. J Physiol. 2008;586:1885–1901. doi: 10.1113/jphysiol.2007.148627. - DOI - PMC - PubMed
    1. Baroncelli L, Sale A, Viegi A, Maya Vetencourt JF, De Pasquale R, Baldini S, Maffei L. Experience-dependent reactivation of ocular dominance plasticity in the adult visual cortex. Exp Neurol. 2010;226:100–109. doi: 10.1016/j.expneurol.2010.08.009. - DOI - PubMed
    1. Baroncelli L, Braschi C, Spolidoro M, Begenisic T, Maffei L, Sale A. Brain plasticity and disease: a matter of inhibition. Neural Plast. 2011;2011:286073. doi: 10.1155/2011/286073. - DOI - PMC - PubMed
    1. Baroncelli L, Bonaccorsi J, Milanese M, Bonifacino T, Giribaldi F, Manno I, Cenni MC, Berardi N, Bonanno G, Maffei L, Sale A. Enriched experience and recovery from amblyopia in adult rats: impact of motor, social and sensory components. Neuropharmacology. 2012;62:2388–2397. doi: 10.1016/j.neuropharm.2012.02.010. - DOI - PubMed
    1. Baroncelli L, Braschi C, Maffei L. Visual depth perception in normal and deprived rats: effects of environmental enrichment. Neuroscience. 2013;236:313–319. doi: 10.1016/j.neuroscience.2013.01.036. - DOI - PubMed