. 2016 Mar 25;351(6280):1450-1454.
doi: 10.1126/science.aad2257. Epub 2016 Mar 24.

Survey of variation in human transcription factors reveals prevalent DNA binding changes

Affiliations

Survey of variation in human transcription factors reveals prevalent DNA binding changes

Luis A Barrera et al. Science. .

Abstract

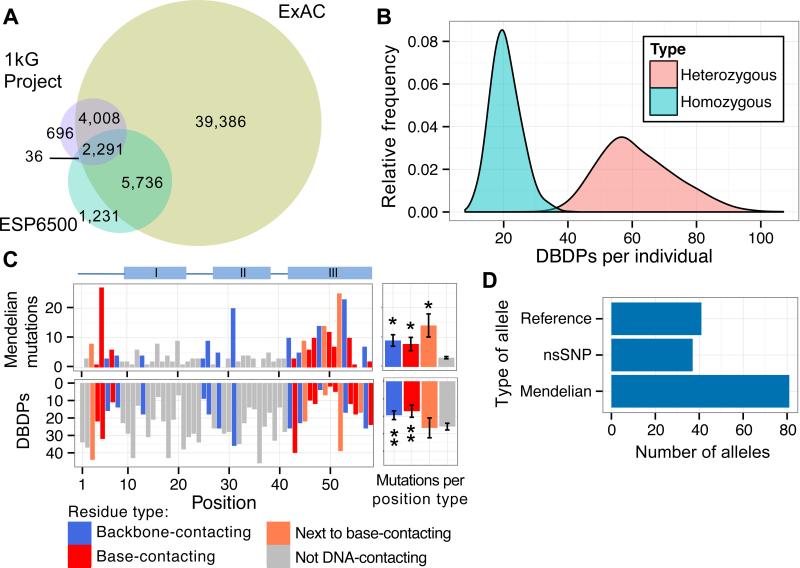
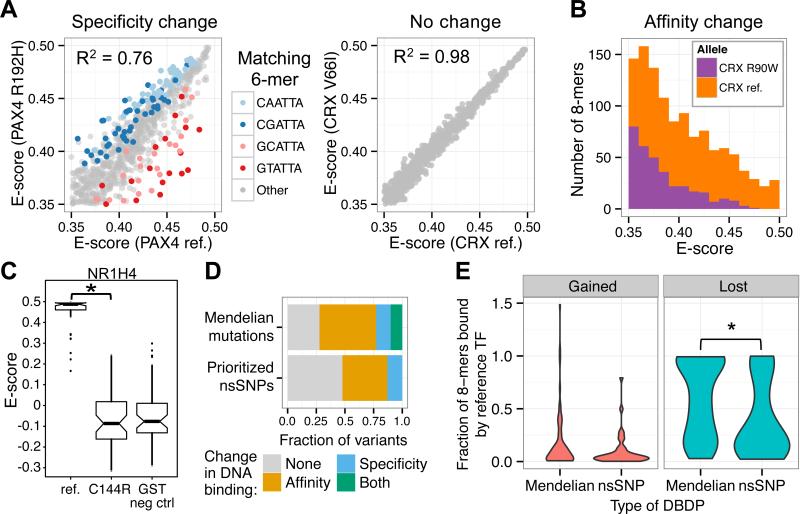
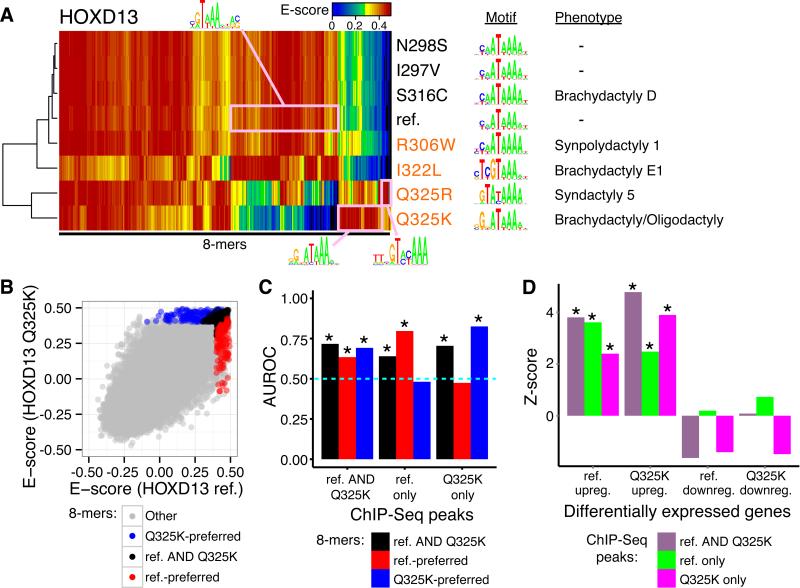
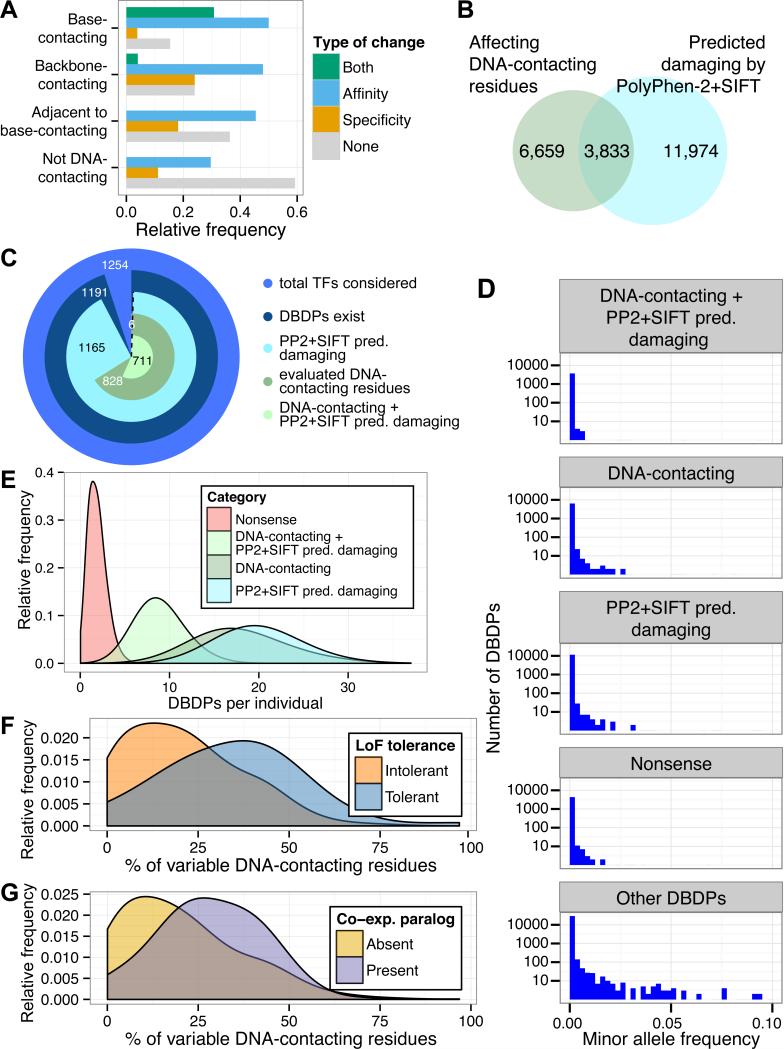
Sequencing of exomes and genomes has revealed abundant genetic variation affecting the coding sequences of human transcription factors (TFs), but the consequences of such variation remain largely unexplored. We developed a computational, structure-based approach to evaluate TF variants for their impact on DNA binding activity and used universal protein-binding microarrays to assay sequence-specific DNA binding activity across 41 reference and 117 variant alleles found in individuals of diverse ancestries and families with Mendelian diseases. We found 77 variants in 28 genes that affect DNA binding affinity or specificity and identified thousands of rare alleles likely to alter the DNA binding activity of human sequence-specific TFs. Our results suggest that most individuals have unique repertoires of TF DNA binding activities, which may contribute to phenotypic variation.


Figures

Figure 1
Figure 1. Evaluation of coding variation in TF DBDs
(A) Number of unique DBDPs in 1kG (Phase 3), ESP 6500, or ExAC v0.2 individuals. (B) Histograms of unique DBDPs per individual in either homozygous or heterozygous states. (C) Number of Mendelian mutations, and nsSNPs found in ExAC, across all homeodomain TFs annotated by their position and type of DNA contact associated with each position. “I”, “II, “III” refer to α-helices; III is the DNA-recognition helix. Adjacent bar graphs depict mean number of variants for each position type; enrichment (*) or depletion (**) relative to non-DNA-contacting residues (P < 0.05, permutation test), error bars = 1 standard error of the mean, N = 332 Mendelian mutations, 1,300 nsSNPs, and 11 base-contacting, 12 phosphate-backbone-contacting, 5 neighboring-DNA-contacting, and 30 non-DNA-contacting positions. (D) Allele types assayed by PBMs.
Figure 2
Figure 2. Perturbed DNA-binding caused by nsSNPs or Mendelian disease mutations
(A) Specificity change in PAX4 R192H allele compared to no change in CRX V66I allele. Colored 6-mers are allele-preferred (Q < 0.05, intersection-union test with Benjamini-Hochberg correction). (B) Altered E-score distribution of CRX R90W allele relative to the reference allele indicates altered DNA binding affinity. (C) Box plots depict E-scores of NR1H4 reference and C144R alleles and GST negative controls (6) for the top 50 8-mers bound by NR1H4 reference allele. C144R abolished binding specificity (* P < 2.2 × 10⁻¹⁶, Wilcoxon rank-sum test), resulting in E-scores indistinguishable from GST negative controls (Table S7). (D) Fraction of alleles with observed changes in DNA-binding affinity, specificity, both, or neither as determined from PBM binding profiles. Prioritized nsSNPs exclude those predicted as benign by both PolyPhen-2 and SIFT. (E) Violin plots depicting fraction of 8-mer binding sites gained or lost by variants relative to the number of 8-mers bound by the reference allele. Gains or losses were defined as E ≥ 0.4 for one allele and E < 0.4 for the other allele. * P = 0.0044, Wilcoxon rank-sum test.
Figure 3
Figure 3. Perturbations in TF DNA-binding and gene expression associated with HOXD13 genetic variants
(A) Heatmap depicting PBM E-scores of DBD alleles (rows) for all 8-mers (columns) bound strongly (E > 0.45) by at least one allele, with corresponding motifs (13) and phenotypes. Rows and columns were clustered hierarchically. Pink boxes highlight allele-preferred sequences with corresponding motifs, generated by alignment of the indicated 8-mers (14). Variants in orange font exhibited altered specificity. “–” indicates no known phenotype. (B) Scatter plot comparing 8-mer E-scores of HOXD13 reference versus Q325K alleles. Allele-preferred and allele-common 8-mers (6) are colored. (C) PBM-derived allele-preferred 8-mers are enriched (* P < 0.01, Wilcoxon signed-rank test) within genomic regions bound in vivo exclusively by the respective allele. Dashed horizontal line indicates AUROC = 0.5 (no enrichment or depletion). (D) Genes associated with ChIP-Seq peaks enriched for reference-preferred versus Q325K-preferred 8-mers are over-represented (* P < 0.01, permutation test) among genes up-regulated by the same allele. Z-scores were calculated using 100 random background gene sets (6).
Figure 4
Figure 4. Properties of ExAC DBDPs predicted to alter DNA-binding activity
(A) Relative frequency of DNA-binding changes observed for variants at DNA-contacting residues. “Both” comprises residues at which variants changed DNA binding affinity and specificity either simultaneously in one protein or separately across different proteins. (B) Overlap between DBDPs affecting DNA-contacting residues in zf-C2H2, Fork_head, HLH, and Homeobox Pfam domains (blue) or predicted as “probably damaging” by PolyPhen-2 and “damaging” by SIFT (green). (C) Number of sequence-specific TFs for which DBDPs were identified and their evaluation, as in (B). (D) Minor allele frequencies (ExAC v0.2) of nsSNPs. (E) Histogram of DBD variants per individual (1000 Genomes Project Phase 3), annotated as in C. (F) Fraction of DNA-contacting residues per TF altered by at least one nsSNP (ExAC), for genes tolerant of homozygous or compound heterozygous LoF mutations versus genes for which LoF-tolerance was not observed (21). (G) Fraction of variable DNA-contacting residues (ExAC) in TFs with versus without at least one co-expressed paralog.

References

    1. Consortium EA. bioRxiv. 2015
    1. Abecasis GR, et al. Nature. 2010;467:1061–1073. - PMC - PubMed
    1. Westra H-J, et al. Nat Genet. 2013;45:1238–1243. - PMC - PubMed
    1. Veraksa A, Del Campo M, McGinnis W. Mol Genet Metab. 2000;69:85–100. - PubMed
    1. Vaquerizas JM, Kummerfeld SK, Teichmann SA, Luscombe NM. Nat Rev Genet. 2009;10:252–263. - PubMed

Publication types