. 2016 Mar 7:10:72.
doi: 10.3389/fnhum.2016.00072. eCollection 2016.

Simultaneous tDCS-fMRI Identifies Resting State Networks Correlated with Visual Search Enhancement

Affiliations

Simultaneous tDCS-fMRI Identifies Resting State Networks Correlated with Visual Search Enhancement

Daniel E Callan et al. Front Hum Neurosci. .

Abstract

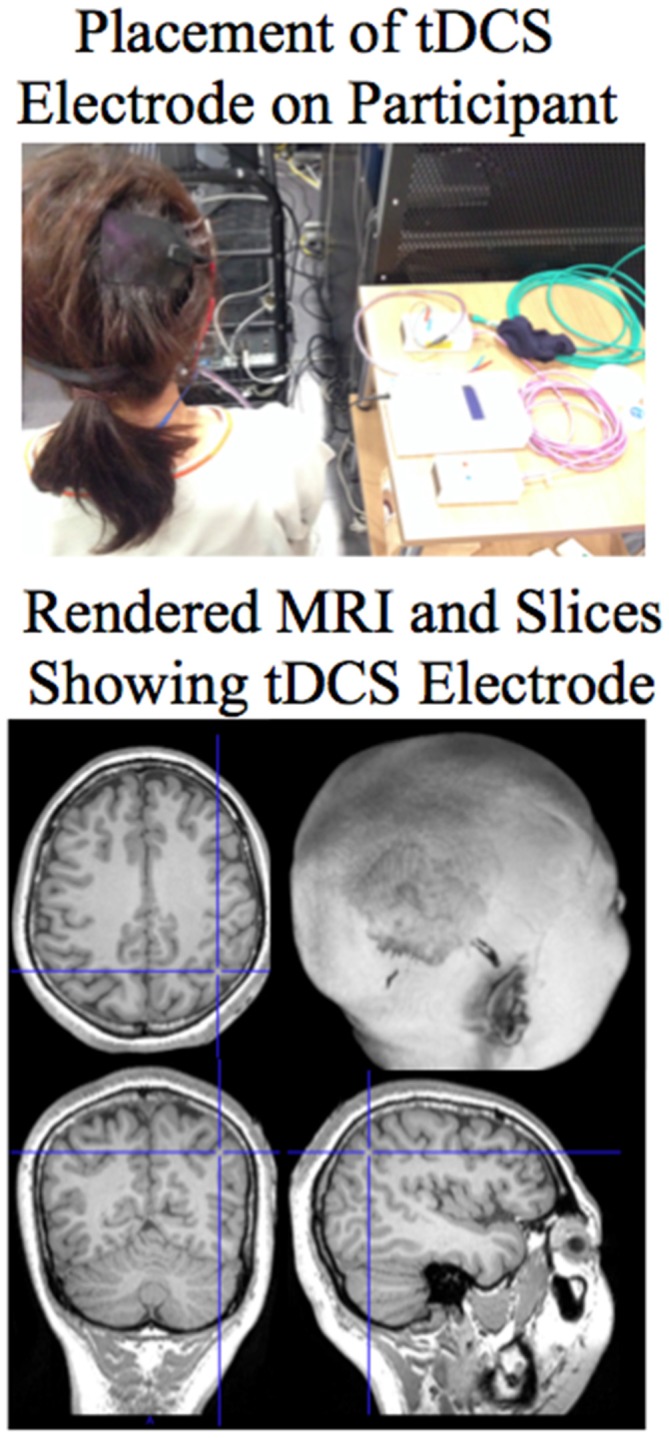
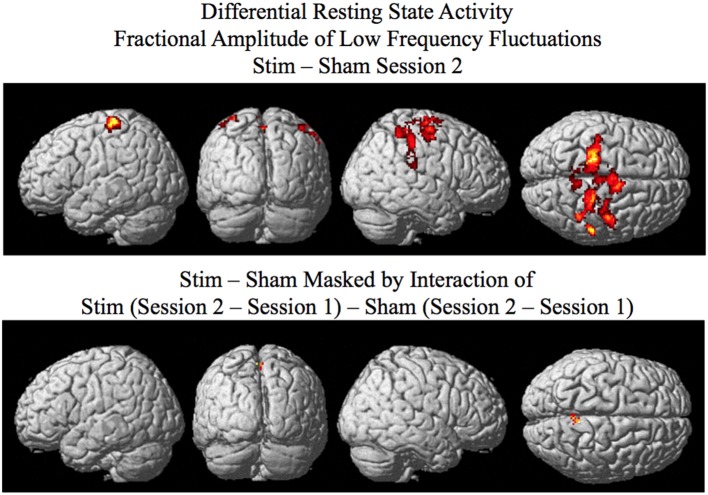
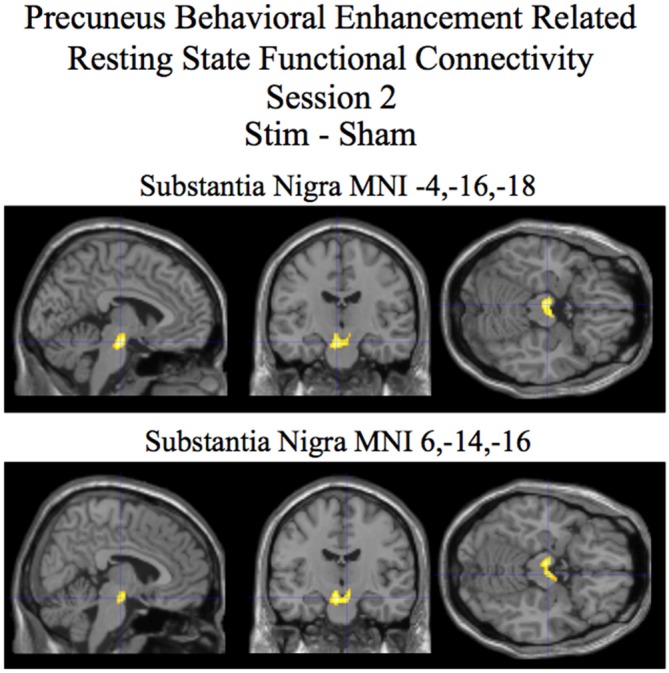
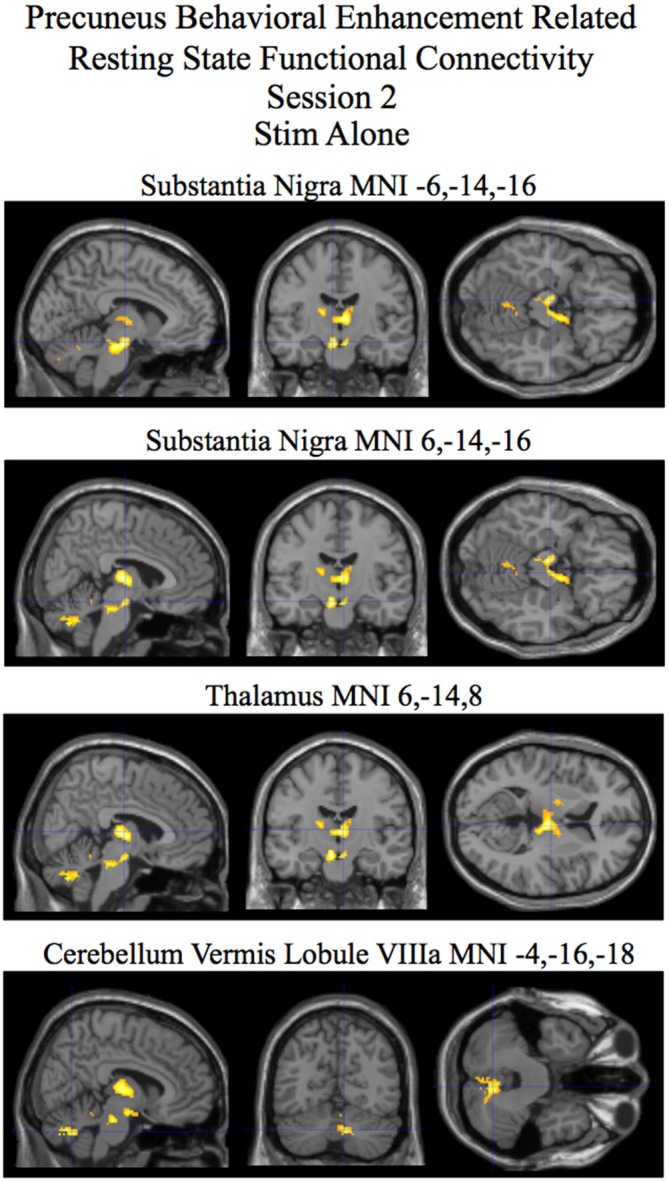
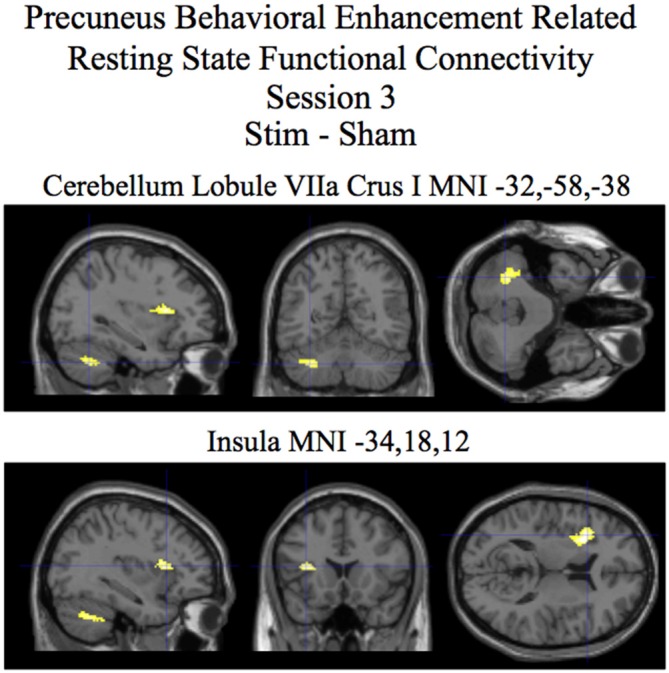
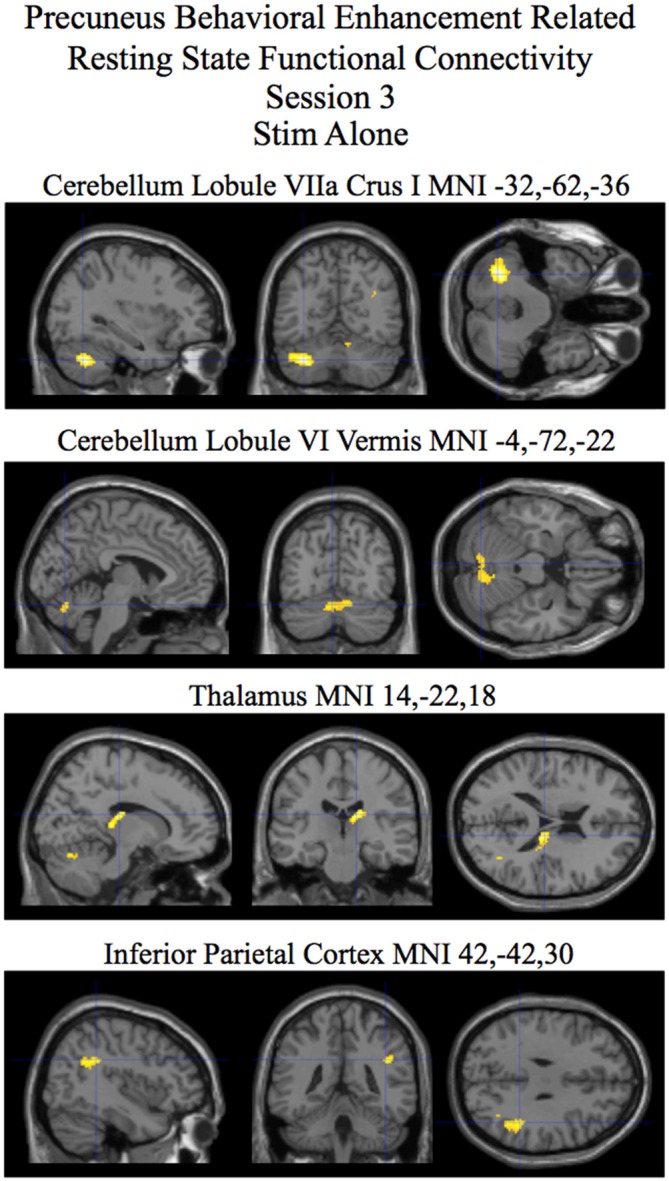
This study uses simultaneous transcranial direct current stimulation (tDCS) and functional MRI (fMRI) to investigate tDCS modulation of resting state activity and connectivity that underlies enhancement in behavioral performance. The experiment consisted of three sessions within the fMRI scanner in which participants conducted a visual search task: Session 1: Pre-training (no performance feedback), Session 2: Training (performance feedback given), Session 3: Post-training (no performance feedback). Resting state activity was recorded during the last 5 min of each session. During the 2nd session one group of participants underwent 1 mA tDCS stimulation and another underwent sham stimulation over the right posterior parietal cortex. Resting state spontaneous activity, as measured by fractional amplitude of low frequency fluctuations (fALFF), for session 2 showed significant differences between the tDCS stim and sham groups in the precuneus. Resting state functional connectivity from the precuneus to the substantia nigra, a subcortical dopaminergic region, was found to correlate with future improvement in visual search task performance for the stim over the sham group during active stimulation in session 2. The after-effect of stimulation on resting state functional connectivity was measured following a post-training experimental session (session 3). The left cerebellum Lobule VIIa Crus I showed performance related enhancement in resting state functional connectivity for the tDCS stim over the sham group. The ability to determine the relationship that the relative strength of resting state functional connectivity for an individual undergoing tDCS has on future enhancement in behavioral performance has wide ranging implications for neuroergonomic as well as therapeutic, and rehabilitative applications.

Keywords: fMRI; functional connectivity; neuroergonomics; resting state; tDCS; visual search.


Figures

Figure 1
Figure 1
Top: Picture showing the placement of the anodal tDCS electrode on the right posterior parietal cortex of the participant. Bottom: The placement of the tDCS electrode can be seen in the rendered MRI of the participant. Sections are shown through the brain at the site of the electrode. For the MRI sections the right side of the image is the right side of the brain.
Figure 2
Figure 2
Results of the SPM random effects analysis rendered on the surface of the brain. Top: Differential resting state activity as measured by fractional amplitude of low frequency fluctuations (fALFF) for the stim–sham groups for session 2 corrected for multiple comparisons at the cluster level (p <0.05) using Monte-Carlo simulation (corrected cluster extent threshold greater than 154 contiguous voxels over uncorrected significance threshold of p < 0.005). Bottom: Activity in the session 2 stim–sham analysis above that is additionally masked by the interaction of Stim (Session 2 – Session 1) – Sham (Session 2 – Session 1) corrected (p < 0.05) for multiple comparisons at the cluster level.
Figure 3
Figure 3
Session 2 results of the SPM random effects between groups t-test for stim relative to the sham group for resting state functional connectivity with the precuneus using post-pre behavioral performance as a covariate of interest. Statistically significant (p < 0.05 corrected) differences in behaviorally related resting state functional connectivity are rendered on sections of a template T1 MRI scan at MNI coordinates for the peaks in the various significant clusters. Negative “x” MNI coordinates denote left hemisphere and positive “x” values denote right hemisphere activity. For the MRI sections the right side of the image is the right side of the brain.
Figure 4
Figure 4
Session 2 results of the SPM random effects t-test for stim alone contrast for resting state functional connectivity with the precuneus using post-pre behavioral performance as a covariate of interest. Statistically significant (p < 0.05 corrected) behaviorally related resting state functional connectivity is rendered on sections of a template T1 MRI scan at MNI coordinates for the peaks in the various significant clusters. Negative “x” MNI coordinates denote left hemisphere and positive “x” values denote right hemisphere activity. For the MRI sections the right side of the image is the right side of the brain.
Figure 5
Figure 5
Session 3 results of the SPM random effects between groups t-test for stim relative to the sham group for resting state functional connectivity with the precuneus using post-pre behavioral performance as a covariate of interest. Statistically significant (p < 0.05 corrected) differences in behaviorally related resting state functional connectivity are rendered on sections of a template T1 MRI scan at MNI coordinates for the peaks in the various significant clusters. Negative “x” MNI coordinates denote left hemisphere and positive “x” values denote right hemisphere activity. For the MRI sections the right side of the image is the right side of the brain.
Figure 6
Figure 6
Session 2 results of the SPM random effects t-test for the stim alone contrast for resting state functional connectivity with the precuneus using post-pre behavioral performance as a covariate of interest. Statistically significant (p < 0.05 corrected) behaviorally related resting state functional connectivity is rendered on sections of a template T1 MRI scan at MNI coordinates for the peaks in the various significant clusters. Negative “x” MNI coordinates denote left hemisphere and positive “x” values denote right hemisphere activity. For the MRI sections the right side of the image is the right side of the brain.

Similar articles

Cited by

References

    1. Adelstein J., Shehzad Z., Mennes M., Deyoung C., Zou X., Kelly C., et al. . (2011). Personality is reflected in the brain’s intrinsic functional architecture. PLoS One 6:e27633. 10.1371/journal.pone.0027633 - DOI - PMC - PubMed
    1. Antal A., Polania R., Schmidt-Samoa C., Dechent P., Paulus W. (2011). Transcranial direct current stimulation over the primary motor cortex during fMRI. Neuroimage 55, 590–596. 10.1016/j.neuroimage.2010.11.085 - DOI - PubMed
    1. Baldassarre A., Lewis C., Committeri G., Snyder A., Romani G., Corbetta M. (2012). Individual variability in functional connectivity predicts performance of perceptual task. Proc. Natl. Acad. Sci. U S A 109, 3201–3521. 10.1073/pnas.1113148109 - DOI - PMC - PubMed
    1. Bikson M., Inoue M., Akiyama H., Deans J., Fox J., Miyakawa H., et al. . (2004). Effects of uniform extracellular DC electric fields on excitability in rat hippocampal slices in vitro. J. Physiol. 557, 175–190. 10.1113/jphysiol.2003.055772 - DOI - PMC - PubMed
    1. Biswal B., Yetkin F., Haughton V., Hyde J. (1995). Functional connectivity in the motor cortex of resting human brain using echo-planer MRI. Magn. Reson. Med. 34, 537–541. 10.1002/mrm.1910340409 - DOI - PubMed

LinkOut - more resources