. 2016 Mar 15:10:22.
doi: 10.3389/fncom.2016.00022. eCollection 2016.

Kilohertz Frequency Deep Brain Stimulation Is Ineffective at Regularizing the Firing of Model Thalamic Neurons

Affiliations

Kilohertz Frequency Deep Brain Stimulation Is Ineffective at Regularizing the Firing of Model Thalamic Neurons

João Couto et al. Front Comput Neurosci. .

Abstract

Deep brain stimulation (DBS) is an established therapy for movement disorders, including tremor, dystonia, and Parkinson's disease, but the mechanisms of action are not well understood. Symptom suppression by DBS typically requires stimulation frequencies ≥100 Hz, but when the frequency is increased above ~2 kHz, the effectiveness in tremor suppression declines (Benabid et al., 1991). We sought to test the hypothesis that the decline in efficacy at high frequencies is associated with desynchronization of the activity generated within a population of stimulated neurons. Regularization of neuronal firing is strongly correlated with tremor suppression by DBS, and desynchronization would disrupt the regularization of neuronal activity. We implemented computational models of CNS axons with either deterministic or stochastic membrane dynamics, and quantified the response of populations of model nerve fibers to extracellular stimulation at different frequencies and amplitudes. As stimulation frequency was increased from 2 to 80 Hz the regularity of neuronal firing increased (as assessed with direct estimates of entropy), in accord with the clinical effects on tremor of increasing stimulation frequency (Kuncel et al., 2006). Further, at frequencies between 80 and 500 Hz, increasing the stimulation amplitude (i.e., the proportion of neurons activated by the stimulus) increased the regularity of neuronal activity across the population, in accord with the clinical effects on tremor of stimulation amplitude (Kuncel et al., 2007). However, at stimulation frequencies above 1 kHz the regularity of neuronal firing declined due to irregular patterns of action potential generation and conduction block. The reductions in neuronal regularity that occurred at high frequencies paralleled the previously reported decline in tremor reduction and may be responsible for the loss of efficacy of DBS at very high frequencies. This analysis provides further support for the hypothesis that effective DBS masks the intrinsic patterns of activity in the stimulated neurons and replaces it with regularized firing.

Keywords: computational model; conduction block; desynchronization; high frequency stimulation; informational lesion.


Figures
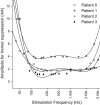
Figure 1
Figure 1
Effect of stimulation frequency on the stimulation amplitude required for tremor suppression by thalamic deep brain stimulation (DBS). Fourth order polynomial functions were used to fit the experimental data (points) as in the original figure. Original data from Benabid et al. (1991).
Figure 2
Figure 2
Extracellular stimulation of model thalamic nerve fibers. (A) Arrangement of the population of parallel model axons around the stimulating electrode. Fibers were not allowed in the U-shaped region around the electrode. (B) Intrinsic burst activity was evoked by intracellular stimulation at the proximal node of each fiber, the extracellular electrode was positioned closest to the 40th node from the distal end, and the transmembrane potential was recorded at the distal end.
Figure 3
Figure 3
Example of inter-spike interval (ISI) histograms and ISI pair histograms for fibers exhibiting intrinsic bursting activity, regular firing, and irregular firing. (A) Transmembrane voltage in bursting, regular, and irregular firing model nerve fibers. (B) Histograms representing the probability of each ISI interval. (C) ISI pair maps illustrating the probability of an ISI pair. Larger circles represent higher probability. Bursting fibers (entropy 1.49 bits/spike) displayed peaks at short (intra-burst spikes) and at long (inter-burst spikes) ISIs; as compared to regular firing fibers (entropy 0 bits/spike) that displayed a single peak at the firing frequency in both the ISI histograms and the ISI pair histograms. Irregular fibers displayed very different firing patterns; in this example (entropy 2.8 bits/spike) the ISI histogram and ISI pair histograms are spread below 50 ms.
Figure 4
Figure 4
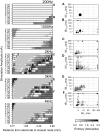
Entropy maps and simulated spike trains from quiescent model nerve fibers for multiple stimulation frequencies and at different distances from the stimulating electrode. (A) Entropy maps from stochastic model nerve fibers with 200 or 10,000 sodium channels per node and the deterministic model nerve fibers stimulated by an extracellular electrode at different frequencies. The amplitude of stimulation was set to activate 50% of the fibers at 100 Hz. The grayscale indicates the entropy of the spike train for a fiber at a particular distance. (B) Firing patterns (rastergrams) and entropy values (H) of an example model nerve fiber 1.59 mm from the electrode (arrow in the entropy maps) for each of the three models (three columns) across stimulation frequencies (rows). The low channel density stochastic model fired spontaneously with high entropy even in the absence of stimulation, but this was not observed in the high channel density stochastic model or in the deterministic model. In the later two cases, stimulation had similar effects for all frequencies.
Figure 5
Figure 5
Firing patterns generated by extracellular stimulation at 200 Hz, 2 kHz, and 3 kHz. Raster plots and entropy maps (vertical bars indicate fibers where conduction was blocked) for a population of 100 deterministic model nerve fibers and a stimulation current of 1.6 mA, which evoked firing in ~75% of the fibers at 100 Hz.
Figure 6
Figure 6
Effect of the amplitude of the stimulating current on the firing pattern of model axons during high frequency extracellular stimulation. Entropy maps for multiple frequencies and current amplitudes (left), and population ISI pair histograms (right), i.e., from all fibers at a particular current amplitude. The area of each circle represents the probability of a given ISI being followed by another. The ISI pair histograms (A–F) correspond to the labels in the left panels and refer to: (A) The intrinsic activity was masked by extracellular stimulation in all fibers and replaced by entirely regular firing, thereby reducing the ISI pair histogram to a single circle. (B) Stimulation regularized firing in 50% of the fibers, but did not mask the intrinsic activity in the remaining fibers. (C–F) Irregular firing patterns evoked by high frequency stimulation. Stimulation amplitudes higher than 3.19 mA at frequencies above 1 kHz generated irregular activity patterns in the fibers closer to the electrode due to activation initiating at nodes further away from the electrode. In the entropy maps, the horizontal lines indicate fibers where the action potential conduction was blocked by extracellular stimulation.
Figure 7
Figure 7
Block of action potential conduction by high frequency stimulation. (A) Fraction of model nerve fibers undergoing conduction block at different stimulation frequencies and amplitudes. (B) Example of a model nerve fiber undergoing conduction block; node at 0 cm is the closest to the extracellular electrode and −6 cm is the location of the node where the intrinsic burst activity was introduced with an intracellular electrode. The intrinsic activity does not propagate through the central node at 0.0 cm, immediately beneath the stimulating electrode.
Figure 8
Figure 8
Firing patterns generated by extracellular stimulation at multiple frequencies. Stimulation at a current sufficient to evoke firing in (A) 50% and (B) 80% of the fibers at 100 Hz. (C) 400 ms of the simulated spike trains for a single model nerve fiber located 2.02 mm away from the electrode (arrow in left entropy map) and the entropy values obtained when stimulating at each frequency.
Figure 9
Figure 9
Loss of efficacy of DBS at very high frequencies can be explained by increases in entropy. (A) Fraction of fibers where the entropy of the output firing is <1 bit per spike at different amplitudes and frequencies of stimulation. The fibers that have a regular output pattern are depicted in gray and those that undergo conduction block in black. For large stimulation currents and higher frequencies, we did not see regularized firing due to the occurrence of conduction block and the finite extent of the population of model nerve fibers. (B) Overlay of the clinical data from Benabid et al. (1991) (each point was normalized by the per patient minimum value and then multiplied by the average of the minimum values across patients) and the minimal amplitude to regularize half of the fibers in the simulations.

Similar articles

Cited by

References

    1. Agnesi F., Johnson M. D., Vitek J. L. (2013). Deep brain stimulation: how does it work? Handb. Clin. Neurol. 116, 39–54. 10.1016/B978-0-444-53497-2.00004-8 - DOI - PubMed
    1. Agnesi F., Muralidharan A., Baker K. B., Vitek J. L., Johnson M. D. (2015). Fidelity of frequency and phase entrainment of circuit-level spike activity during DBS. J. Neurophysiol. 114, 825–834. 10.1152/jn.00259.2015 - DOI - PMC - PubMed
    1. Bellinger S., Miyazawa G., Steinmetz P. (2008). Submyelin potassium accumulation may functionally block subsets of local axons during deep brain stimulation: a modeling study. J. Neural Eng. 5, 263. 10.1088/1741-2560/5/3/001 - DOI - PubMed
    1. Benabid A. L., Pollak P., Gervason C., Hoffmann D., Gao D. M., Hommel M., et al. . (1991). Long-term suppression of tremor by chronic stimulation of the ventral intermediate thalamic nucleus. Lancet 337, 403–406. 10.1016/0140-6736(91)91175-T - DOI - PubMed
    1. Bhadra N., Kilgore K. L. (2005). High-frequency electrical conduction block of mammalian peripheral motor nerve. Muscle Nerve 32, 782–790. 10.1002/mus.20428 - DOI - PubMed