Cross Acclimation between Heat and Hypoxia: Heat Acclimation Improves Cellular Tolerance and Exercise Performance in Acute Normobaric Hypoxia
- PMID: 27014080
- PMCID: PMC4781846
- DOI: 10.3389/fphys.2016.00078
Cross Acclimation between Heat and Hypoxia: Heat Acclimation Improves Cellular Tolerance and Exercise Performance in Acute Normobaric Hypoxia
Abstract
Background: The potential for cross acclimation between environmental stressors is not well understood. Thus, the aim of this investigation was to determine the effect of fixed-workload heat or hypoxic acclimation on cellular, physiological, and performance responses during post acclimation hypoxic exercise in humans.
Method: Twenty-one males (age 22 ± 5 years; stature 1.76 ± 0.07 m; mass 71.8 ± 7.9 kg; [Formula: see text]O2 peak 51 ± 7 mL(.)kg(-1.)min(-1)) completed a cycling hypoxic stress test (HST) and self-paced 16.1 km time trial (TT) before (HST1, TT1), and after (HST2, TT2) a series of 10 daily 60 min training sessions (50% N [Formula: see text]O2 peak) in control (CON, n = 7; 18°C, 35% RH), hypoxic (HYP, n = 7; fraction of inspired oxygen = 0.14, 18°C, 35% RH), or hot (HOT, n = 7; 40°C, 25% RH) conditions.
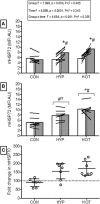
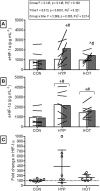
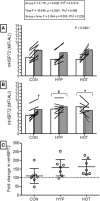
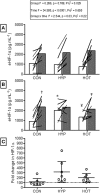
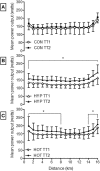
Results: TT performance in hypoxia was improved following both acclimation treatments, HYP (-3:16 ± 3:10 min:s; p = 0.0006) and HOT (-2:02 ± 1:02 min:s; p = 0.005), but unchanged after CON (+0:31 ± 1:42 min:s). Resting monocyte heat shock protein 72 (mHSP72) increased prior to HST2 in HOT (62 ± 46%) and HYP (58 ± 52%), but was unchanged after CON (9 ± 46%), leading to an attenuated mHSP72 response to hypoxic exercise in HOT and HYP HST2 compared to HST1 (p < 0.01). Changes in extracellular hypoxia-inducible factor 1-α followed a similar pattern to those of mHSP72. Physiological strain index (PSI) was attenuated in HOT (HST1 = 4.12 ± 0.58, HST2 = 3.60 ± 0.42; p = 0.007) as a result of a reduced HR (HST1 = 140 ± 14 b.min(-1); HST2 131 ± 9 b.min(-1) p = 0.0006) and Trectal (HST1 = 37.55 ± 0.18°C; HST2 37.45 ± 0.14°C; p = 0.018) during exercise. Whereas PSI did not change in HYP (HST1 = 4.82 ± 0.64, HST2 4.83 ± 0.63).
Conclusion: Heat acclimation improved cellular and systemic physiological tolerance to steady state exercise in moderate hypoxia. Additionally we show, for the first time, that heat acclimation improved cycling time trial performance to a magnitude similar to that achieved by hypoxic acclimation.
Keywords: cross-acclimation; cycling; heat; heat shock proteins; hypoxia.
Figures

Similar articles
-
Heat and Hypoxic Acclimation Increase Monocyte Heat Shock Protein 72 but Do Not Attenuate Inflammation following Hypoxic Exercise.Front Physiol. 2017 Oct 16;8:811. doi: 10.3389/fphys.2017.00811. eCollection 2017. Front Physiol. 2017. PMID: 29085305 Free PMC article.
-
Human monocyte heat shock protein 72 responses to acute hypoxic exercise after 3 days of exercise heat acclimation.Biomed Res Int. 2015;2015:849809. doi: 10.1155/2015/849809. Epub 2015 Mar 22. Biomed Res Int. 2015. PMID: 25874231 Free PMC article. Clinical Trial.
-
The impact of submaximal exercise during heat and/or hypoxia on the cardiovascular and monocyte HSP72 responses to subsequent (post 24 h) exercise in hypoxia.Extrem Physiol Med. 2014 Sep 29;3:15. doi: 10.1186/2046-7648-3-15. eCollection 2014. Extrem Physiol Med. 2014. PMID: 25343025 Free PMC article.
-
Heat acclimation and cross tolerance to hypoxia: Bridging the gap between cellular and systemic responses.Temperature (Austin). 2014 Jul 8;1(2):107-14. doi: 10.4161/temp.29800. eCollection 2014 Jul-Sep. Temperature (Austin). 2014. PMID: 27583292 Free PMC article. Review.
-
Heat acclimation and performance in hypoxic conditions.Aviat Space Environ Med. 2012 Jul;83(7):649-53. doi: 10.3357/asem.3241.2012. Aviat Space Environ Med. 2012. PMID: 22779306 Review.
Cited by
-
Non-pharmacological interventions for vascular health and the role of the endothelium.Eur J Appl Physiol. 2022 Dec;122(12):2493-2514. doi: 10.1007/s00421-022-05041-y. Epub 2022 Sep 23. Eur J Appl Physiol. 2022. PMID: 36149520 Free PMC article. Review.
-
Contemporary Periodization of Altitude Training for Elite Endurance Athletes: A Narrative Review.Sports Med. 2019 Nov;49(11):1651-1669. doi: 10.1007/s40279-019-01165-y. Sports Med. 2019. PMID: 31452130 Review.
-
Endocrine and Metabolic Responses to Endurance Exercise Under Hot and Hypoxic Conditions.Front Physiol. 2020 Aug 19;11:932. doi: 10.3389/fphys.2020.00932. eCollection 2020. Front Physiol. 2020. PMID: 32973541 Free PMC article.
-
Performance Changes Following Heat Acclimation and the Factors That Influence These Changes: Meta-Analysis and Meta-Regression.Front Physiol. 2019 Nov 27;10:1448. doi: 10.3389/fphys.2019.01448. eCollection 2019. Front Physiol. 2019. PMID: 31827444 Free PMC article.
-
Heat acclimation enhances the cold-induced vasodilation response.Eur J Appl Physiol. 2021 Nov;121(11):3005-3015. doi: 10.1007/s00421-021-04761-x. Epub 2021 Jul 10. Eur J Appl Physiol. 2021. PMID: 34245332 Free PMC article.
References
-
- Assayag M., Saada A., Gerstenblith G., Canaana H., Shlomai R., Horowitz M. (2012). Mitochondrial performance in heat acclimation—a lesson from ischemia/reperfusion and calcium overload insults in the heart. Am. J. Physiol. Regul. Integr. Comp. Physiol. 303, R870–R881. 10.1152/ajpregu.00155.2012 - DOI - PubMed
-
- Benjamini Y., Hochberg Y. (1995). Controlling the false discovery rate: a practical and powerful approach to multiple testing. J. R. Stat. Soc. 57, 289–300.
-
- Borg G. A. (1982). Psychophysical bases of perceived exertion. Med. Sci. Sports Exerc. 14, 377–381. - PubMed
LinkOut - more resources
Full Text Sources
Other Literature Sources
Medical
Miscellaneous

