. 2016 Mar 8:7:83.
doi: 10.3389/fimmu.2016.00083. eCollection 2016.

Distinct Mechanisms Regulate Lck Spatial Organization in Activated T Cells

Affiliations

Distinct Mechanisms Regulate Lck Spatial Organization in Activated T Cells

Natasha Kapoor-Kaushik et al. Front Immunol. .

Abstract

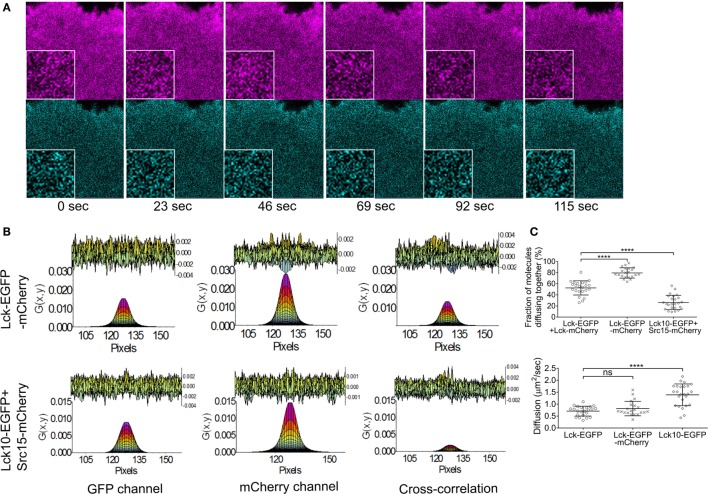
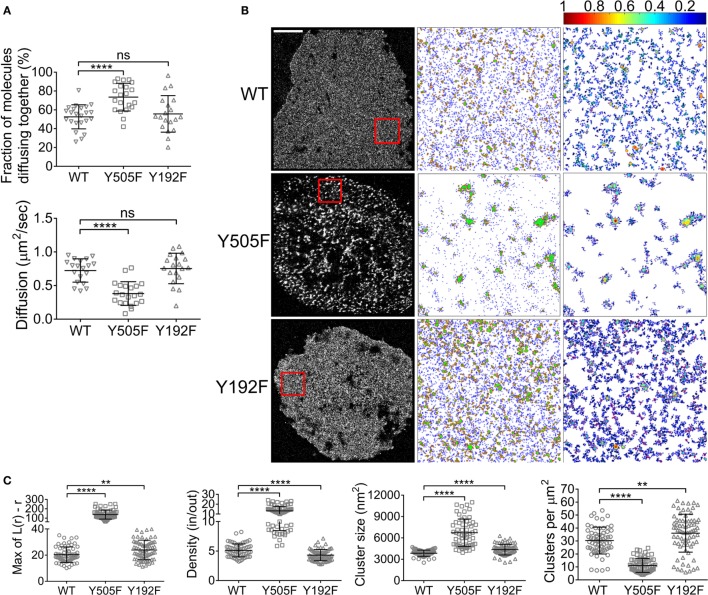
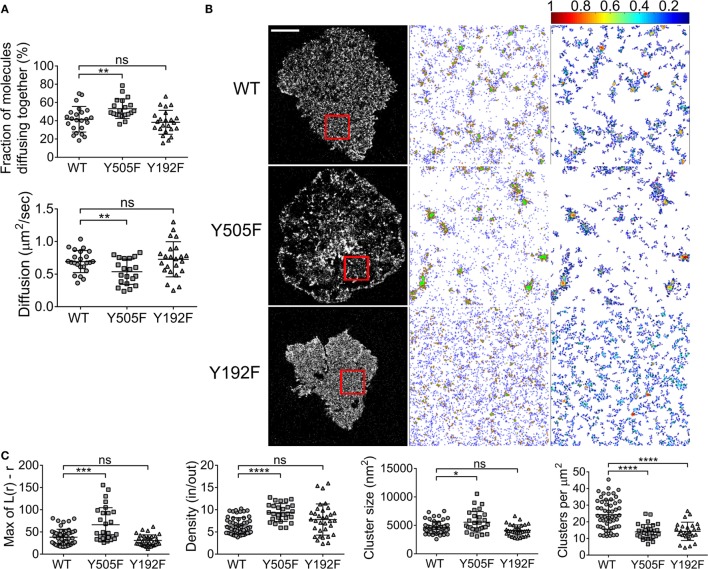
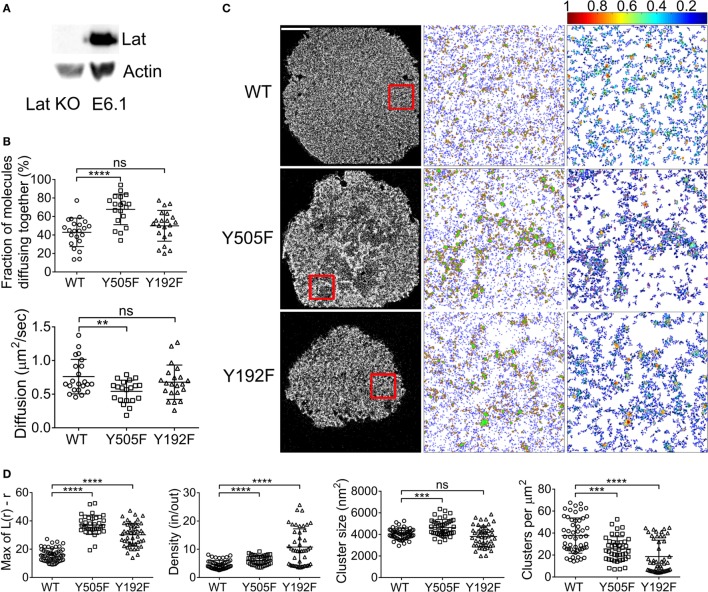
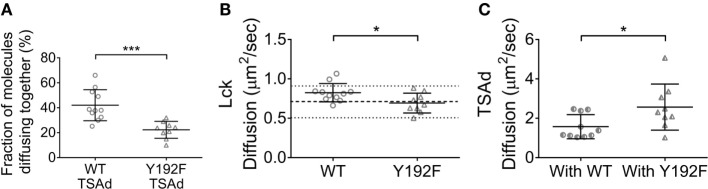
Phosphorylation of the T cell receptor (TCR) by the kinase Lck is the first detectable signaling event upon antigen engagement. The distribution of Lck within the plasma membrane, its conformational state, kinase activity, and protein-protein interactions all contribute to determine how efficiently Lck phosphorylates the engaged TCR. Here, we used cross-correlation raster image correlation spectroscopy and photoactivated localization microscopy to identify two mechanisms of Lck clustering: an intrinsic mechanism of Lck clustering induced by locking Lck in its open conformation and an extrinsic mechanism of clustering controlled by the phosphorylation of tyrosine 192, which regulates the affinity of Lck SH2 domain. Both mechanisms of clustering were differently affected by the absence of the kinase Zap70 or the adaptor Lat. We further observed that the adaptor TSAd bound to and promoted the diffusion of Lck when it is phosphorylated on tyrosine 192. Our data suggest that while Lck open conformation drives aggregation and clustering, the spatial organization of Lck is further controlled by signaling events downstream of TCR phosphorylation.

Keywords: Lck; T cell signaling; assembly of signaling complexes; image correlation spectroscopy; membrane organization; super-resolution fluorescence microscopy.


Figures

Figure 1
Figure 1
Validity of the ccRICS approach to measure the interaction of diffusing proteins in Jurkat T cells. JCaM1 cells transfected, respectively, with (1) WT Lck–EGFP and WT Lck–mCherry, (2) Lck–EGFP–mCherry (positive control), and (3) Lck10–EGFP and Src15–mCherry (negative control) were pre-activated for 10 min on glass coverslips coated with activating anti-CD3 and anti-CD28, and then imaged for approximately 3 min (100 frames) between 10 and 40 min of activation. (A) Example of images used for ccRICS – cells transfected with Lck–EGFP–mCherry. Inset: zoom of a 32 × 32 pixels region. (B) One-component fitting of the RICS function in the EGFP and mCherry channels and the ccRICS function between the two channels for the positive (upper row) and negative controls (lower row). The top of the charts shows the residual component of the fit. (C) Top: fractions of molecules diffusing together. Bottom: diffusion coefficients for WT Lck, the positive control and the negative control extracted, respectively, from the cross-correlation and EGFP autocorrelation functions. Each symbol in (B) represents one cell; small horizontal lines indicate mean (±SEM). ns, not significant; **P < 0.005 and ****P < 0.0005 (unpaired t-test). Data are from three independent experiments with at least 21 cells.
Figure 2
Figure 2
Intrinsic and SH2-mediated Lck clustering. (A) JCaM1 cells expressing (1) WT Lck–EGFP and WT Lck–mCherry, (2) constitutively open Lck(Y505F)–EGFP and Lck(Y505F)–mCherry, or (3) SH2-binding mutant Lck(Y192F)–EGFP and Lck(Y192F)–mCherry were activated and imaged as in Figure 1. Top: fractions of molecules diffusing together. Bottom: diffusion coefficients for WT Lck, open Lck, and the SH2 Lck mutant. Data for WT Lck are the same than data plotted in Figure 1. (B) First column: single-molecule PALM images of WT Lck–PS-CFP2, Lck(Y505F)–PS-CFP2, and Lck(Y192F)–PS-CFP2 in JCaM1 cells incubated on glass coverslips coated with activating anti-CD3 and anti-CD28 and fixed after 10 min. Scale bars, 5 μm. Middle column: cluster maps generated by DBSCAN analysis from the 4 μm × 4 μm regions highlighted in red. Last column: maps showing the clusters identified by DBSCAN and color-coded for relative density (0–1). (C) From left to right: maxima (Max) of Ripley’s K function curves of image regions and relative density in clusters, cluster size, and number per area obtained from DBSCAN analysis. Each symbol represents one cell (A) or one image region (C); small horizontal lines indicate mean (±SEM). ns, not significant; **P < 0.001 and ****P < 0.00005, unpaired t-test for the ccRICS data (A) and Mann–Whitney test for the PALM data (C). Data are from three to five independent experiments with a total of at least 19 cells.
Figure 3
Figure 3
Zap70 promotes intrinsic clustering of open Lck and is required for clustering of SH2 mutant Lck. (A) Zap70-deficient P116 cells expressing (1) WT Lck–EGFP and WT Lck–mCherry, (2) constitutively open Lck(Y505F)–EGFP and Lck(Y505F)–mCherry, or (3) SH2-binding mutant Lck(Y192F)–EGFP and Lck(Y192F)–mCherry were activated and imaged as in Figure 1. Top: fractions of molecules diffusing together. Bottom: diffusion coefficients for WT Lck, open Lck, and the SH2 Lck mutant. (B) First column: single-molecule PALM images of WT Lck–PS-CFP2, Lck(Y505F)–PS-CFP2, and Lck(Y192F)–PS-CFP2 in P116 cells incubated on glass coverslips coated with activating anti-CD3 and anti-CD28 and fixed after 10 min. Scale bars, 5 μm. Middle column: cluster maps generated by DBSCAN analysis from the 4 μm × 4 μm regions highlighted in red. Last column: maps showing the clusters identified by DBSCAN and color-coded for relative density (0–1). (C) From left to right: maxima (Max) of Ripley’s K function curves of image regions and relative density in clusters, cluster size, and number per area obtained from DBSCAN analysis. Each symbol represents one cell (A) or one image region (C); small horizontal lines indicate mean (±SEM). ns, not significant; *P < 0.05, ***P < 0.0005, and ****P < 0.00005, unpaired t-test for the ccRICS data (A) and Mann–Whitney test for the PALM data (C). Data are from three independent experiments with a total of at least 20 cells.
Figure 4
Figure 4
Lat contributes to the clustering of open Lck but represses the clustering of the SH2 mutant Lck. (A) Immunoblot of Lat KO cells and wild-type E6.1 Jurkat cells. (B) Lat KO cells expressing (1) WT Lck–EGFP and WT Lck–mCherry, (2) Lck(Y505F)EGFP and Lck(Y505F)–mCherry, or (3) Lck(Y192F)–EGFP and Lck(Y192F)–mCherry were activated and imaged as in Figure 1. Top: fractions of molecules diffusing together. Bottom: diffusion coefficients for WT Lck, open Lck, and the SH2 Lck mutant. (C) First column: single-molecule PALM images of WT Lck–PS-CFP2, Lck(Y505F)–PS-CFP2, and Lck(Y192F)–PS-CFP2 in Lat KO cells incubated on glass coverslips coated with activating anti-CD3 and anti-CD28 and fixed after 10 min. Scale bars, 5 μm. Middle column: cluster maps generated by DBSCAN analysis from the 4 μm × 4 μm regions highlighted in red. Last column: maps showing the clusters identified by DBSCAN and color-coded for relative density (0–1). (D) From left to right: maxima (Max) of Ripley’s K function curves of image regions and relative density in clusters, cluster size, and number per area obtained from DBSCAN analysis. Each symbol represents one cell (A) or one image region (B); small horizontal lines indicate mean (±SEM). ns, not significant; **P < 0.005, ***P < 0.0005, and ****P < 0.00005, unpaired t-test for the ccRICS data (B) and Mann–Whitney test for the PALM data (D). Data are from three to five independent experiments with a total of at least 20 cells.
Figure 5
Figure 5
TSAd binding to Lck promotes Lck diffusion. JCaM1 cells transfected, respectively, with (1) WT Lck–EGFP and TSAd–mCherry, or (2) Lck(Y192F)–EGFP and TSAd–mCherry were activated and imaged as in Figure 1. (A) Fraction of TSAd–mCherry molecules diffusing together with either WT Lck–EGFP or Lck(Y192F)–EGFP. (B) Diffusion coefficients for WT Lck–EGFP and Lck(Y192F) in cells expressing TSAd–mCherry. (C) Diffusion coefficients for TSAd–mCherry in cells expressing WT Lck–EGFP or Lck(Y192F)–EGFP. Each symbol represents one cell; small horizontal lines indicate mean (±SEM). *P < 0.05 and ***P < 0.0005, unpaired t-test. Data are from three independent experiments with at least nine cells.

Similar articles

Cited by

References

    1. Huppa JB, Davis MM. The interdisciplinary science of T-cell recognition. Adv Immunol (2013) 119:1–50.10.1016/B978-0-12-407707-2.00001-1 - DOI - PubMed
    1. Chakraborty AK, Weiss A. Insights into the initiation of TCR signaling. Nat Immunol (2014) 15:798–807.10.1038/ni.2940 - DOI - PMC - PubMed
    1. Nika K, Soldani C, Salek MM, Paster W, Gray A, Etzensperger R, et al. Constitutively active Lck kinase in T cells drives antigen receptor signal transduction. Immunity (2010) 32:766–77.10.1016/j.immuni.2010.05.011 - DOI - PMC - PubMed
    1. Stirnweiss A, Hartig R, Gieseler S, Lindquist JA, Reichardt P, Philipsen L, et al. T cell activation results in conformational changes in the SRC family kinase lck to induce its activation. Sci Signal (2013) 6:ra13.10.1126/scisignal.2003607 - DOI - PubMed
    1. Rudd CE, Trevillyan JM, Dasgupta JD, Wong LL, Schlossman SF. The CD4 receptor is complexed in detergent lysates to a protein-tyrosine kinase (pp58) from human T lymphocytes. Proc Natl Acad Sci U S A (1988) 85:5190–4.10.1073/pnas.85.14.5190 - DOI - PMC - PubMed

LinkOut - more resources