. 2016 Mar 7:7:251.
doi: 10.3389/fpls.2016.00251. eCollection 2016.

Overlapping Yet Response-Specific Transcriptome Alterations Characterize the Nature of Tobacco-Pseudomonas syringae Interactions

Affiliations

Overlapping Yet Response-Specific Transcriptome Alterations Characterize the Nature of Tobacco-Pseudomonas syringae Interactions

Zoltán Bozsó et al. Front Plant Sci. .

Abstract

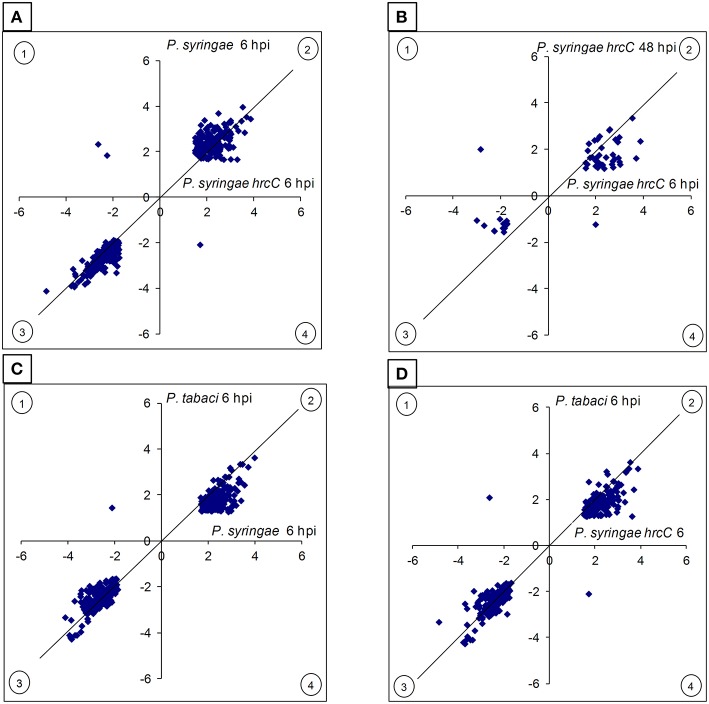
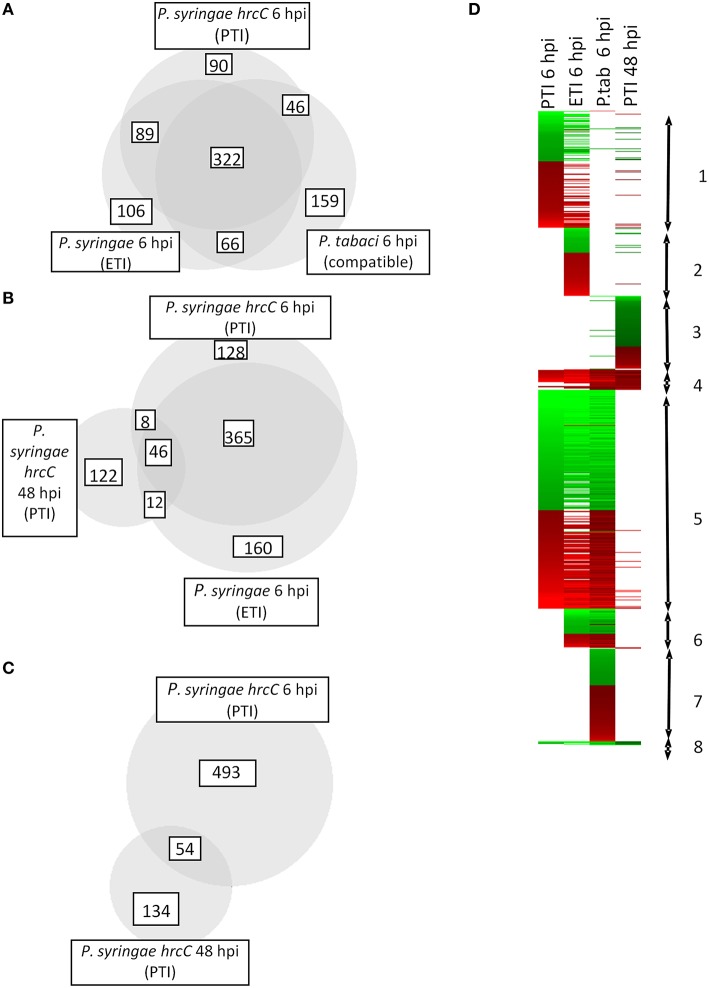
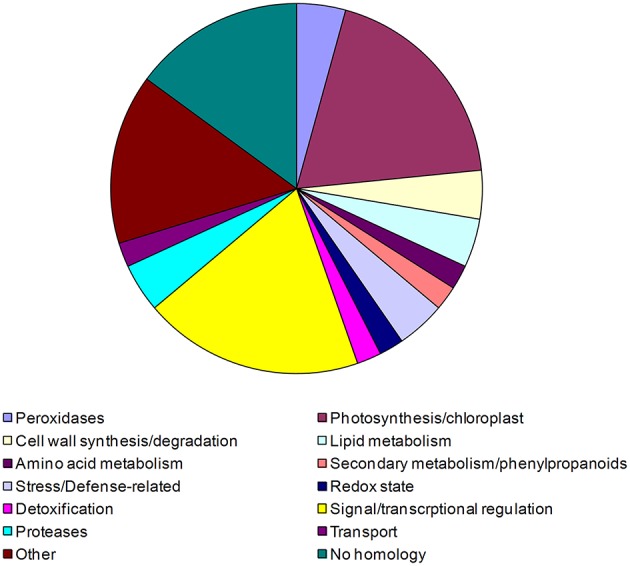
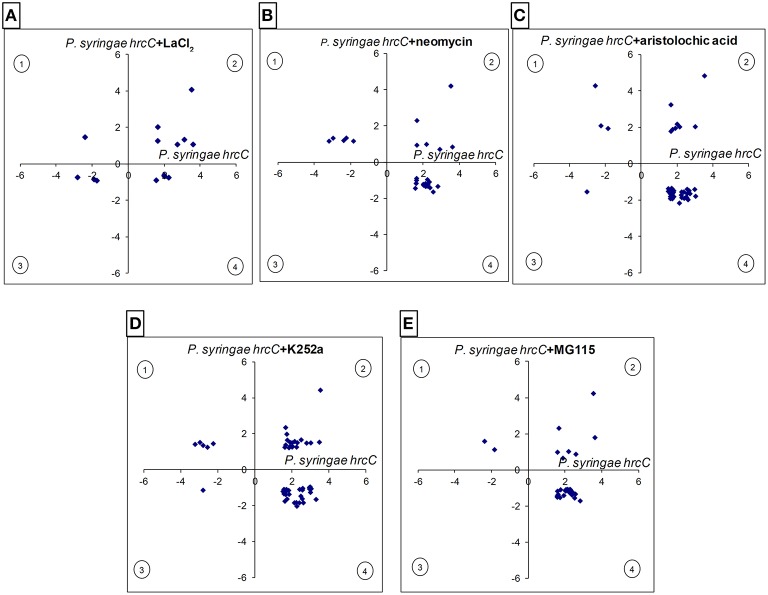
In this study transcriptomic alterations of bacterially induced pattern triggered immunity (PTI) were compared with other types of tobacco-Pseudomonas interactions. In addition, using pharmacological agents we blocked some signal transduction pathways (Ca(2+) influx, kinases, phospholipases, proteasomic protein degradation) to find out how they contribute to gene expression during PTI. PTI is the first defense response of plant cells to microbes, elicited by their widely conserved molecular patterns. Tobacco is an important model of Solanaceae to study resistance responses, including defense mechanisms against bacteria. In spite of these facts the transcription regulation of tobacco genes during different types of plant bacterial interactions is not well-described. In this paper we compared the tobacco transcriptomic alterations in microarray experiments induced by (i) PTI inducer Pseudomonas syringae pv. syringae type III secretion mutant (hrcC) at earlier (6 h post inoculation) and later (48 hpi) stages of defense, (ii) wild type P. syringae (6 hpi) that causes effector triggered immunity (ETI) and cell death (HR), and (iii) disease-causing P. syringae pv. tabaci (6 hpi). Among the different treatments the highest overlap was between the PTI and ETI at 6 hpi, however, there were groups of genes with specifically altered activity for either type of defenses. Instead of quantitative effects of the virulent P. tabaci on PTI-related genes it influenced transcription qualitatively and blocked the expression changes of a special set of genes including ones involved in signal transduction and transcription regulation. P. tabaci specifically activated or repressed other groups of genes seemingly not related to either PTI or ETI. Kinase and phospholipase A inhibitors had highest impacts on the PTI response and effects of these signal inhibitors on transcription greatly overlapped. Remarkable interactions of phospholipase C-related pathways with the proteasomal system were also observable. Genes specifically affected by virulent P. tabaci belonged to various previously identified signaling routes, suggesting that compatible pathogens may modulate diverse signaling pathways of PTI to overcome plant defense.

Keywords: Pseudomonas syringae; compatible interaction; effector triggered immunity (ETI); pattern triggered immunity (PTI); signal transduction; tobacco; transcriptome.


Figures

Figure 1
Figure 1
Comparison of the intensity and directions of gene expression changes induced by different treatments. The X- and Y axes show average log2 transcription activation or repression of those genes of the given treatments that both are differentially expressed when compared to the water-injected control. (A) P. syringae hrcC (PTI) at 6 h post-inoculation (hpi) vs. P. syringae (ETI) at 6 hpi. (B) P. syringae hrcC (PTI) at 6 hpi vs. P. syringae hrcC (PTI) at 48 hpi. (C) P. syringae (ETI) at 6 hpi vs. P. tabaci (compatible) at 6 hpi. (D) P. syringae hrcC (PTI) at 6 hpi vs. P. tabaci (compatible) at 6 hpi. Points in quadrants 2 and 3 shows those genes activated and repressed in the same direction by both treatments, respectively. Points in quadrants 1 and 4 shows those genes that were activated and repressed in the opposite direction in the two treatments. Figure shows results of the average of triplicates.
Figure 2
Figure 2
Number and direction of expression changes induced by different bacterial treatments. (A–C) Number of common and specific genes significantly up- or down-regulated after inoculations. Area-proportional Venn diagrams were produced with help of BioVenn (Hulsen et al., 2008) (D) Cluster analysis of transcriptomic alterations induced by different bacterial treatments. Genes appearing in cluster 1 are affected mostly by PTI and ETI at 6 hpi. Some of the genes here are up- or down regulated exclusively during PTI at 6 hpi. Cluster 2 contains genes that are specific mainly to ETI at 6 hpi. Group 3 includes specific genes of late (48 hpi) PTI. Most of the genes belonging to cluster 4 were activated in all samples irrespective of the type of bacterial treatment. Cluster 5 represents genes that changed their transcription at 6 hpi regardless of the type of the treatment. Group 6 contains activated or repressed genes induced by living pathogens with functional Type III secretion system (either ETI inducible P. syringae or compatible P. tabaci). In cluster 7 there are genes whose transcription was specifically modulated by compatible disease causing P. tabaci. Genes belonging to cluster 8 were repressed in all samples irrespective of the type of bacterial treatment. Red and green colors represent up- or down regulation of genes compared to water infiltrated control, respectively.
Figure 3
Figure 3
Pie chart representing percent ratios of putative function-based groups of tobacco genes up or down-regulated during PTI and blocked by compatible P. tabaci. 47 PTI activated or repressed tobacco genes were blocked by living P. tabaci at 6 hpi. Functional classification of genes was determined by the help of MAPMAN (Rotter et al., 2007). Based on the identified putative functions genes were classified into 14 groups: peroxidases, photosynthesis/chloroplast, cell wall synthesis/degradation, lipid metabolism, amino acid metabolism, secondary metabolism/phenylpropanoids, stress/defense-related, redox state, detoxification, signal/transcriptional regulation, proteases, transport, other no homology. Corresponding percentages are demonstrated in the figure.
Figure 4
Figure 4
Comparison of the intensity and directions of gene expression changes caused by various signal inhibitors on PTI-related genes at 6 hpi. X-axes show average log2 transcription activation or repression of PTI-related genes compared to water-injected control (up- or down-regulated in P. syringe hrcC infiltrated leaves). Y axes show changes caused by signal inhibitors on PTI-related genes (P. syringe hrcC+signal inhibitors) compared to P. syringe hrcC (PTI)-injected samples. (A) LaCl2, Ca2+ channel blocker (B) neomycin, phospholipase C/D inhibitor (C) aristolochic acid, phospholipase A inhibitor. (D) K252a, kinase inhibitor (E) MG115, proteasome inhibitor. Points in quadrants 2 and 3 show those genes activated and repressed in the same direction in both treatments, respectively. Points in quadrants 1 and 4 show those genes that were activated and repressed in the opposite direction in the two treatments. Figure shows results of the average of triplicates.
Figure 5
Figure 5
Effect of different signaling inhibitors on PTI-related gene expression. (A) Expression pattern of PTI-related genes after infiltration together with various signal pathway inhibitors. First column shows transcription of 99 PTI-related genes at 6 hpi in plant leaves after infiltration with P. syringe hrcC and compared to water-infiltrated control. Other columns show effects of different signaling pathway inhibitors on the expression of these PTI-related genes. Red and green colors represent up- or down regulation of genes compared to control, respectively. Genes were ranked manually and coloration was carried out by using FiRe 2.2 program. Different letters on the right side of figure mark groups of genes that show similar pattern of expression. (A) Genes whose expression was altered by all inhibitors. (B) PTI-related genes whose expression was not affected by aristolochic acid but influenced by other inhibitors to varying extent. (C) PTI-related genes whose expression was influenced mainly by neomycin and MG115. (D) PTI-related genes whose expression was affected by both aristolochic acid and K252a. (E) PTI-related genes whose expression was influenced by both K252a and MG115. (F–J) Groups represent genes whose expression is influenced by only one inhibitor. (B) Interactions between different signal inhibitors in PTI-related gene expressions. Circles represent the used signal inhibitors. Sizes of the circles are proportional to the number of the PTI-related genes influenced by the given inhibitors. Thicknesses of lines between circles are proportional to the number of commonly affected genes, which is indicated with numbers on the line as well. (C) Relationships between the effects of different inhibitors on PTI-related gene expressions. Table shows interactions of various signaling pathways during transcriptional regulation of PTI genes. Data presents the number of genes commonly affected by the inhibitors at 6 hpi after infiltration with P. syringe hrcC. Orange part of table shows the number of genes that the inhibitors transcriptionally modified to the same direction, while green part of the table shows number of genes modified in opposite directions. Inhibitors were the following: LaCl2, Ca2+ channel blocker; neomycin, phospholipase C and D inhibitor; aristolochic acid, phospholipase A inhibitor; K252a, kinase inhibitor; MG115, proteasome inhibitor.

Similar articles

Cited by

References

    1. Adam A. L., Pike S., Hoyos M. E., Stone J. M., Walker J. C., Novacky A. (1997). Rapid and transient activation of a myelin basic protein kinase in tobacco leaves treated with harpin from Erwinia amylovora. Plant Physiol. 115, 853–861. - PMC - PubMed
    1. Akashi T., Aoki T., Ayabe S. (2005). Molecular and biochemical characterization of 2-hydroxyisoflavanone dehydratase. Involvement of carboxylesterase-like proteins in leguminous isoflavone biosynthesis. Plant Physiol. 137, 882–891. 10.1104/pp.104.056747 - DOI - PMC - PubMed
    1. Albrecht C., Boutrot F., Segonzac C., Schwessinger B., Gimenez-Ibanez S., Chinchilla D., et al. (2012). Brassinosteroids inhibit pathogen-associated molecular pattern-triggered immune signaling independent of the receptor kinase BAK1. Proc. Natl. Acad. Sci. U.S.A. 109, 303–308. 10.1073/pnas.1109921108 - DOI - PMC - PubMed
    1. Andersson M. X., Kourtchenko O., Dangl J. L., Mackey D., Ellerström M. (2006). Phospholipase-dependent signalling during the AvrRpm1- and AvrRpt2-induced disease resistance responses in Arabidopsis thaliana. Plant J. 47, 947–959. 10.1111/j.1365-313X.2006.02844.x - DOI - PubMed
    1. Anthony R. G., Henriques R., Helfer A., Mészáros T., Rios G., Testerink C., et al. (2004). A protein kinase target of a PDK1 signalling pathway is involved in root hair growth in Arabidopsis. EMBO J. 23, 572–581. 10.1038/sj.emboj.7600068 - DOI - PMC - PubMed

LinkOut - more resources