. 2016 Mar 15:7:309.
doi: 10.3389/fpls.2016.00309. eCollection 2016.

The Evolutionarily Conserved E3 Ubiquitin Ligase AtCHIP Contributes to Plant Immunity

Affiliations

The Evolutionarily Conserved E3 Ubiquitin Ligase AtCHIP Contributes to Plant Immunity

Charles Copeland et al. Front Plant Sci. .

Abstract

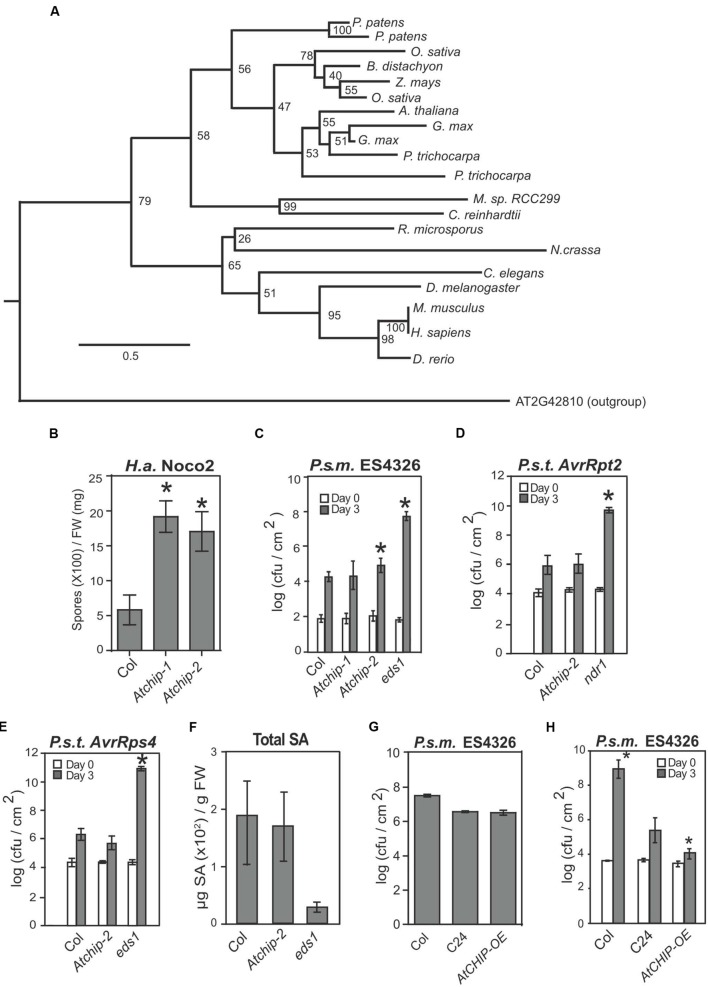
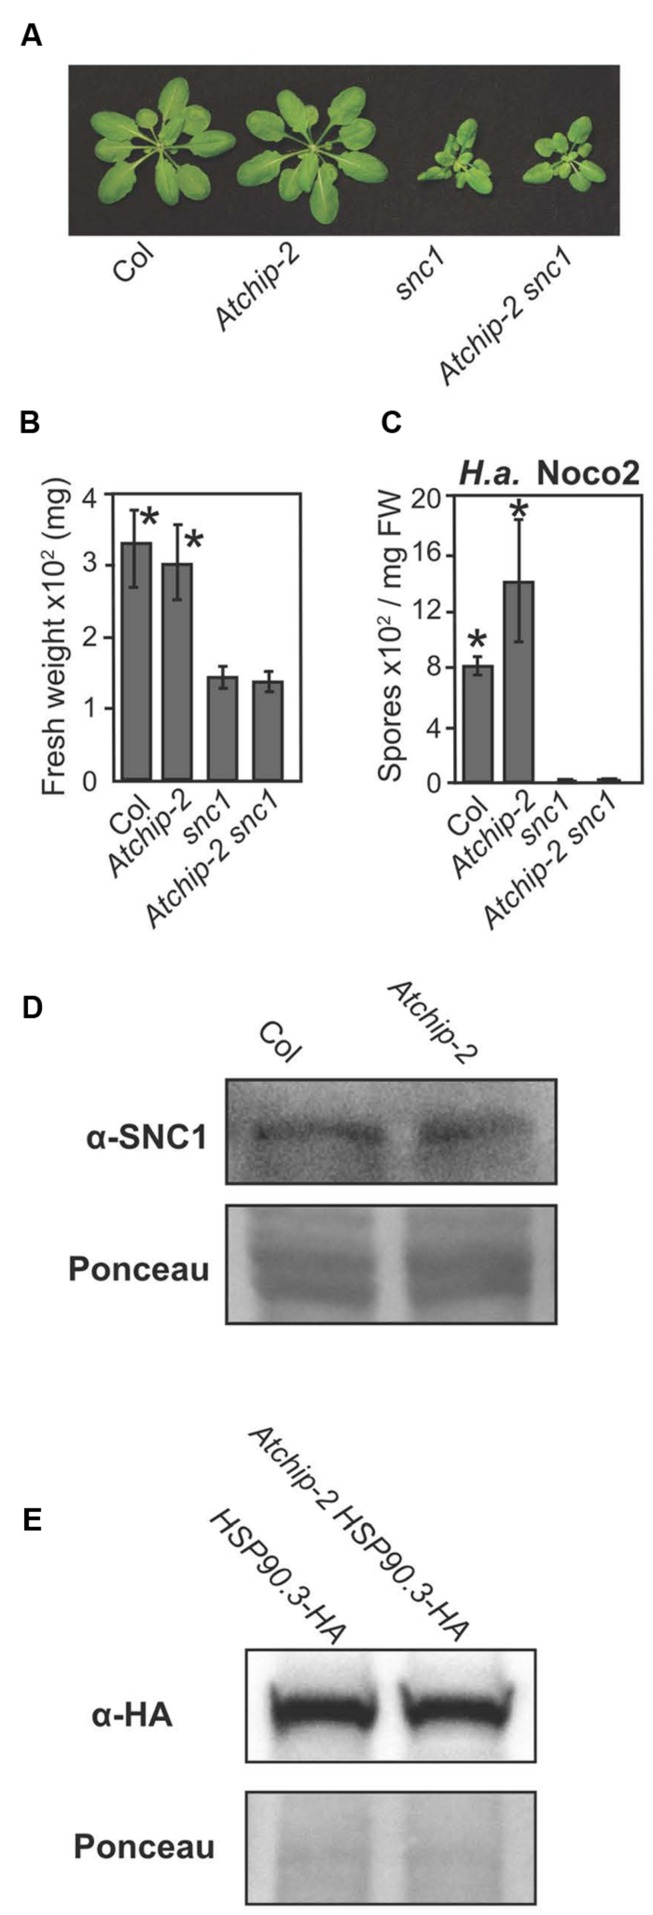
Plants possess a sophisticated immune system to recognize and respond to microbial threats in their environment. The level of immune signaling must be tightly regulated so that immune responses can be quickly activated in the presence of pathogens, while avoiding autoimmunity. HSP90s, along with their diverse array of co-chaperones, forms chaperone complexes that have been shown to play both positive and negative roles in regulating the accumulation of immune receptors and regulators. In this study, we examined the role of AtCHIP, an evolutionarily conserved E3 ligase that was known to interact with chaperones including HSP90s in multicellular organisms including fruit fly, Caenorhabditis elegans, plants and human. Atchip knockout mutants display enhanced disease susceptibility to a virulent oomycete pathogen, and overexpression of AtCHIP causes enhanced disease resistance at low temperature. Although CHIP was reported to target HSP90 for ubiquitination and degradation, accumulation of HSP90.3 was not affected in Atchip plants. In addition, protein accumulation of nucleotide-binding, leucine-rich repeat domain immune receptor (NLR) SNC1 is not altered in Atchip mutant. Thus, while AtCHIP plays a role in immunity, it does not seem to regulate the turnover of HSP90 or SNC1. Further investigation is needed in order to determine the exact mechanism behind AtCHIP's role in regulating plant immune responses.

Keywords: ChIP; E3 lligase; HSP90 heat-shock proteins; SGT1; chaperones; plant immunity.


Figures

FIGURE 1
FIGURE 1
Atchip knockout mutants exhibit enhanced susceptibility to virulent but not avirulent pathogens, while overexpression of AtCHIP leads to enhanced resistance only at lower temperature. (A) Maximum-likelihood tree of CHIP sequences from representative eukaryotes. Node labels represent bootstrap values from 1000 replicates. The scale bar represents the average number of substitutions per site in each branch. Organisms shown in the tree are Arabidopsis thaliana, Brachypodium distachyon, Caenorhabditis elegans, Chlamydomonas reinhardtii, Danio rerio, Drosophila melanogaster, Glycine max, Homo sapiens, Micromonas sp. RCC299, Mus musculus, Neurospora crassa, Oryza sativa, Physcomitrella patens, Populus trichocarpa, Rhizopus microspores, and Zea mays. (B) Growth of Hyaloperonospora arabidopsidis Noco2 on Col, Atchip-1, and Atchip-2 plants. Two-week-old seedlings were sprayed with a spore suspension at a concentration of 5 × 10⁴ spores per mL, and oomycete spores grown on leaf surface were quantified 7 days later using a hemocytometer. Asterisks indicate a significant difference from Col (p < 0.05) as determined by t-tests. The experiment was repeated more than three times with similar results. (C) Growth of Pseudomonas syringae pv maculicola ES4326 on wild type Col, Atchip-1, Atchip-2, and eds1 plants (eds1 serves as a susceptibility control). Leaves of 4-week-old plants were infiltrated with a bacterial suspension in 10 mM MgCl2 at OD600 = 0.0001. Leaf disks within the infected area were taken immediately after infiltration (Day 0) and 3 days after infiltration (Day 3) to quantify bacterial colony-forming units (cfu). Bars represent mean values of three (Day 0) or five (Day 3) replicates ± SD. Asterisks indicate a significant difference from Col (p < 0.05) as determined by t-tests. (D) and (E) Growth of P. syringae pv tomato DC3000 expressing AvrRpt2 (D) or AvrRps4 (E) on wild type Col, Atchip-2, and ndr1 or eds1 plants. Leaves of 4-week-old plants were infiltrated with a bacterial suspension in 10 mM MgCl2 at OD600 = 0.001. Leaf disks within the infected area were taken immediately after infiltration (Day 0) and 3 days after infiltration (Day 3) to quantify bacterial colony-forming units (cfu). Bars represent mean values of three (Day 0) or five (Day 3) replicates ± SE. Asterisks indicate a significant difference from Col (p < 0.05) as determined by ANOVA followed by Tukey’s HSD test. (F) Salicylic acid (SA) accumulation in Col, Atchip-2, and eds1 induced with P. syringae pv tomato DC3000 carrying AvrRps4. Plants were infiltrated with bacterial suspension in 10 mM MgCl2 at OD600 = 0.2. Tissue was harvested after 24 h for total SA extraction and quantification using an HPLC. Asterisks indicate a significant difference from Col (p < 0.05) as determined by ANOVA followed by Tukey’s HSD test. (G) Growth of P. syringae pv. maculicola ES4326 on wild type Col, C24, and AtCHIP-OE plants. Leaves of 4-week-old plants were infiltrated with a bacterial suspension in 10 mM MgCl2 at OD600 = 0.001. Leaf disks within the infected area were taken 3 days after infiltration (Day 3) to quantify bacterial colony-forming units (cfu). Bars represent mean values of five (Day 3) replicates ± SE. Asterisks indicate a significant difference from C24 as determined by ANOVA followed by Tukey’s HSD test. (H) Growth of P. syringae pv. maculicola ES4326 on wild-type Col, C24, and AtCHIP-OE plants under low temperature. Plants were transferred to 18°C for at least 1 week, and infiltrated as in (G). Asterisks indicate significant difference (p < 0.05) from C24, as determined by a one-way ANOVA followed by Tukey’s HSD test.
FIGURE 2
FIGURE 2
Atchip-2 knockout does not suppress the snc1 phenotype, and SNC1 and HSP90 levels are not altered in Atchip-2 plants. (A) Morphology of 4-week-old soil-grown plants of the indicated genotypes. (B) Fresh weights of plants of the indicated genotypes. Asterisks indicate significant differences from snc1 at p < 0.05, as determined by one-way ANOVA and Tukey’s HSD test. (C) Resistance against H.a. Noco2 in Col, Atchip, snc1, and snc1 Atchip-2 plants. Two-week-old seedlings were sprayed with a spore suspension at a concentration of 105 spores per mL, and spores were quantified 7 days later using a hemocytometer. Asterisks indicate a significant difference (p < 0.05) from snc1, as determined by t-tests. (D) SNC1 protein levels in Atchip-2 plants. Total protein from 3-week-old plants of Col and Atchip genotypes was subjected to immunoblotting with an α-SNC1 antibody (Li et al., 2010). Ponceau staining is shown as a loading control. (E) HSP90.3-HA levels in Col and Atchip-2 genotypes. Total protein was extracted from the aerial tissue of 2-week-old seedlings of the indicated genotypes. HSP90.3-HA levels were examined using immunoblotting with an α-HA antibody. Ponceau staining is shown as loading control.

Similar articles

Cited by

References

    1. Austin M. J., Muskett P., Kahn K., Feys B. J., Jones J. D., Parker J. E. (2002). Regulatory role of SGT1 in early R gene-mediated plant defenses. Science 295 2077–2080. 10.1126/science.1067747 - DOI - PubMed
    1. Cheng Y., Li Y., Huang S., Huang Y., Dong X., Zhang Y., et al. (2011). Stability of plant immune-receptor resistance proteins is controlled by SKP1-CULLIN1-F-box (SCF) -mediated protein degradation. Proc. Natl. Acad. Sci. U.S.A. 108 14694–14699. 10.1073/pnas.1105685108 - DOI - PMC - PubMed
    1. Connell P., Ballinger C., Jiang J., Wu Y., Thompson L. J., Höhfeld J., et al. (2001). The co-chaperone CHIP regulates protein triage decisions mediated by heat-shock proteins. Nat. Cell Biol. 3 93–96. 10.1038/35050618 - DOI - PubMed
    1. Dangl J. L., Horvath D. M., Staskawicz B. J. (2013). Pivoting the plant immune system from dissection to deployment. Science 80 746–751. 10.1126/science.1236011 - DOI - PMC - PubMed
    1. Deshaies R. J., Joazeiro C. P. (2009). RING domain E3 ubiquitin ligases. Ann. Rev. Biochem. 78 399–434. 10.1146/annurev.biochem.78.101807.093809 - DOI - PubMed