

Does Congenital Deafness Affect the Structural and Functional Architecture of Primary Visual Cortex?
- PMID: 27014392
- PMCID: PMC4787313
- DOI: 10.2174/1874440001610010001
Does Congenital Deafness Affect the Structural and Functional Architecture of Primary Visual Cortex?
Abstract
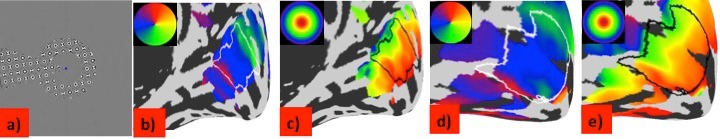
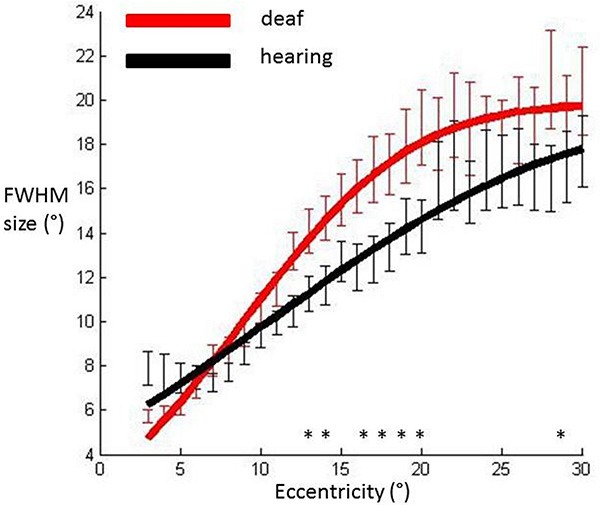
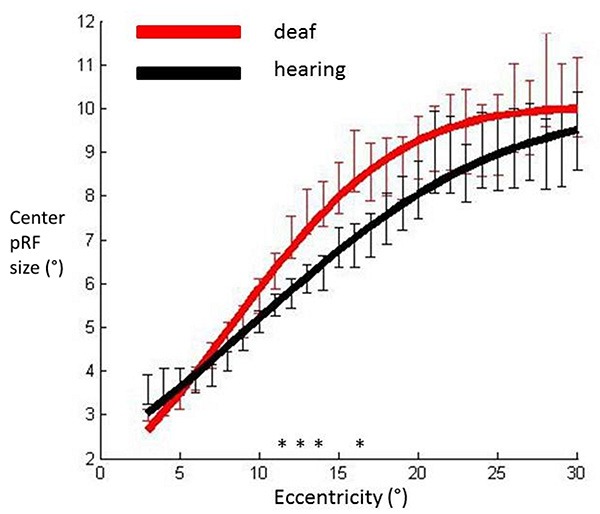
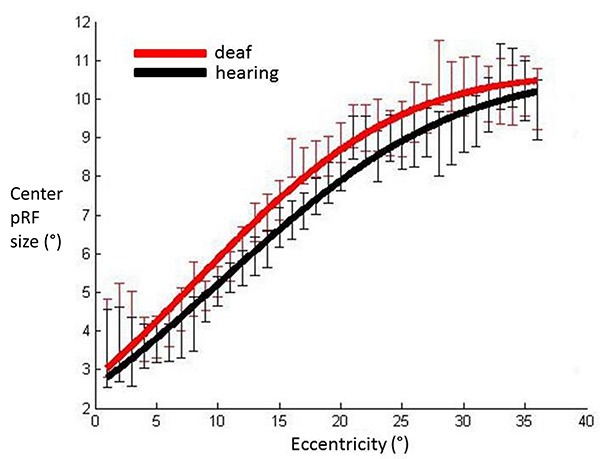
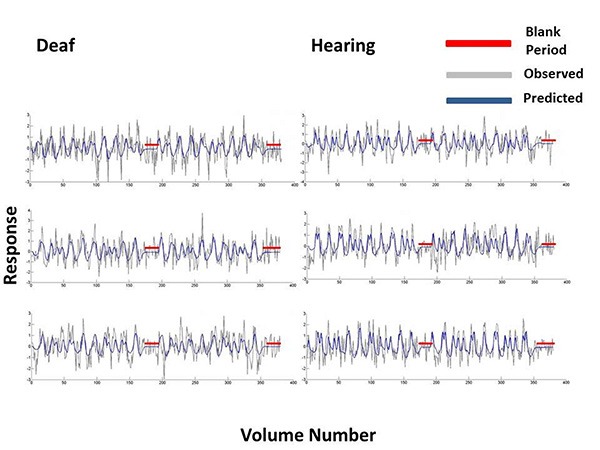
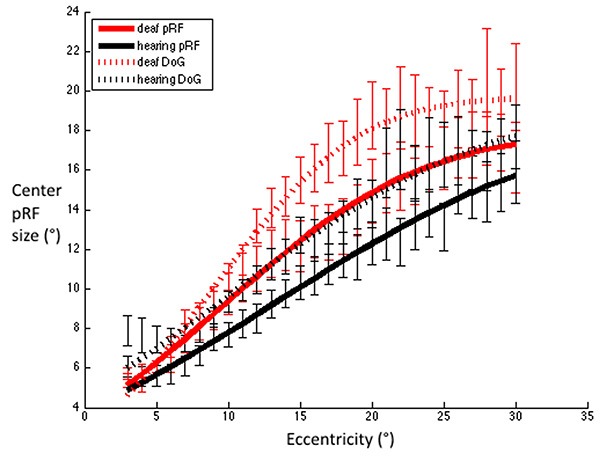
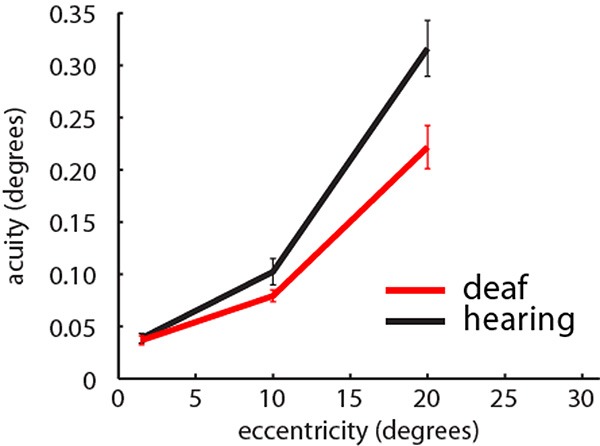
Deafness results in greater reliance on the remaining senses. It is unknown whether the cortical architecture of the intact senses is optimized to compensate for lost input. Here we performed widefield population receptive field (pRF) mapping of primary visual cortex (V1) with functional magnetic resonance imaging (fMRI) in hearing and congenitally deaf participants, all of whom had learnt sign language after the age of 10 years. We found larger pRFs encoding the peripheral visual field of deaf compared to hearing participants. This was likely driven by larger facilitatory center zones of the pRF profile concentrated in the near and far periphery in the deaf group. pRF density was comparable between groups, indicating pRFs overlapped more in the deaf group. This could suggest that a coarse coding strategy underlies enhanced peripheral visual skills in deaf people. Cortical thickness was also decreased in V1 in the deaf group. These findings suggest deafness causes structural and functional plasticity at the earliest stages of visual cortex.
Keywords: Deafness; functional magnetic resonance imaging (fMRI); peripheral visual field (PVF); primary visual cortex (V1).
Figures

Similar articles
-
Unraveling the impact of congenital deafness on individual brain organization.Elife. 2025 Mar 12;13:RP96944. doi: 10.7554/eLife.96944. Elife. 2025. PMID: 40072311 Free PMC article.
-
Neuroplastic changes in functional wiring in sensory cortices of the congenitally deaf: A network analysis.Hum Brain Mapp. 2023 Dec 15;44(18):6523-6536. doi: 10.1002/hbm.26530. Epub 2023 Nov 13. Hum Brain Mapp. 2023. PMID: 37956260 Free PMC article.
-
Decoding Visual Location From Neural Patterns in the Auditory Cortex of the Congenitally Deaf.Psychol Sci. 2015 Nov;26(11):1771-82. doi: 10.1177/0956797615598970. Epub 2015 Sep 30. Psychol Sci. 2015. PMID: 26423461 Free PMC article.
-
Visual Abilities in Individuals with Profound Deafness A Critical Review.In: Murray MM, Wallace MT, editors. The Neural Bases of Multisensory Processes. Boca Raton (FL): CRC Press/Taylor & Francis; 2012. Chapter 22. In: Murray MM, Wallace MT, editors. The Neural Bases of Multisensory Processes. Boca Raton (FL): CRC Press/Taylor & Francis; 2012. Chapter 22. PMID: 22593887 Free Books & Documents. Review.
-
Use it or lose it? Lessons learned from the developing brains of children who are deaf and use cochlear implants to hear.Brain Topogr. 2011 Oct;24(3-4):204-19. doi: 10.1007/s10548-011-0181-2. Epub 2011 Apr 11. Brain Topogr. 2011. PMID: 21479928 Review.
Cited by
-
The Impact of Early Deafness on Brain Plasticity: A Systematic Review of the White and Gray Matter Changes.Front Neurosci. 2020 Mar 30;14:206. doi: 10.3389/fnins.2020.00206. eCollection 2020. Front Neurosci. 2020. PMID: 32292323 Free PMC article.
-
Structural neuroimaging of the altered brain stemming from pediatric and adolescent hearing loss-Scientific and clinical challenges.Wiley Interdiscip Rev Syst Biol Med. 2020 Mar;12(2):e1469. doi: 10.1002/wsbm.1469. Epub 2019 Dec 4. Wiley Interdiscip Rev Syst Biol Med. 2020. PMID: 31802640 Free PMC article. Review.
-
Retinotopic connectivity maps of human visual cortex with unconstrained eye movements.Hum Brain Mapp. 2023 Nov;44(16):5221-5237. doi: 10.1002/hbm.26446. Epub 2023 Aug 9. Hum Brain Mapp. 2023. PMID: 37555758 Free PMC article.
-
Assessing the Recognition of Social Interactions Through Body Motion in the Routine Care of Patients with Post-Lingual Sensorineural Hearing Loss.J Clin Med. 2025 Feb 27;14(5):1604. doi: 10.3390/jcm14051604. J Clin Med. 2025. PMID: 40095562 Free PMC article.
-
Ear-Specific Hemispheric Asymmetry in Unilateral Deafness Revealed by Auditory Cortical Activity.Front Neurosci. 2021 Jul 30;15:698718. doi: 10.3389/fnins.2021.698718. eCollection 2021. Front Neurosci. 2021. PMID: 34393711 Free PMC article.
References
-
- Wiesel T.N., Hubel D.H. Single cell responses of striate cortex of kittens deprived of vision in one eye. J. Neurophysiol. 1963;26:1003–1017. - PubMed
-
- Raemaekers M., Bergsma D.P., van Wezel R.J., van der Wildt G.J., van den Berg A.V. Effects of vision restoration training on early visual cortex in patients with cerebral blindness investigated with functional magnetic resonance imaging. J. Neurophysiol. 2011;105(2):872–882. doi: 10.1152/jn.00308.2010. - DOI - PubMed
Grants and funding
LinkOut - more resources
Full Text Sources
Other Literature Sources