. 2016 Nov;10(11):2744-2754.
doi: 10.1038/ismej.2016.47. Epub 2016 Mar 25.

Genetic and life-history traits associated with the distribution of prophages in bacteria

Affiliations

Genetic and life-history traits associated with the distribution of prophages in bacteria

Marie Touchon et al. ISME J. 2016 Nov.

Abstract

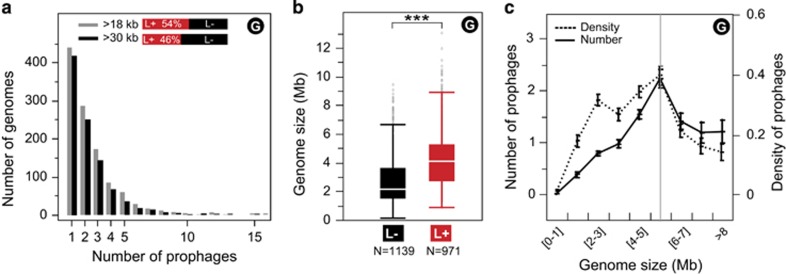
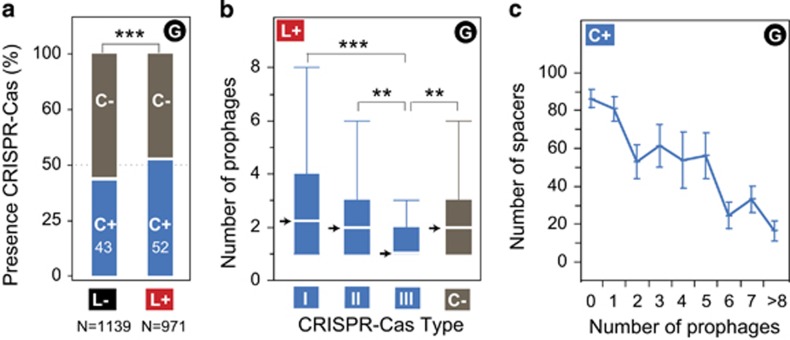
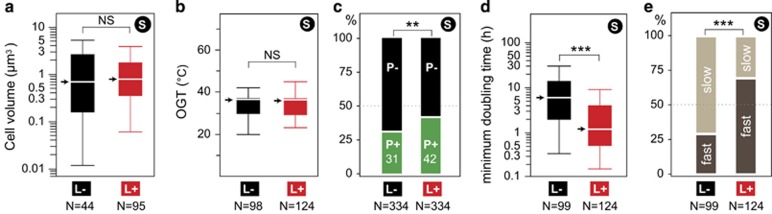
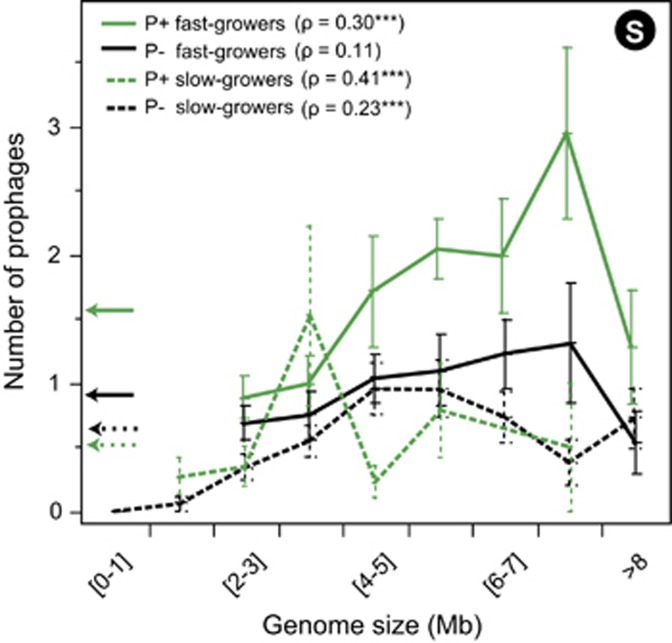
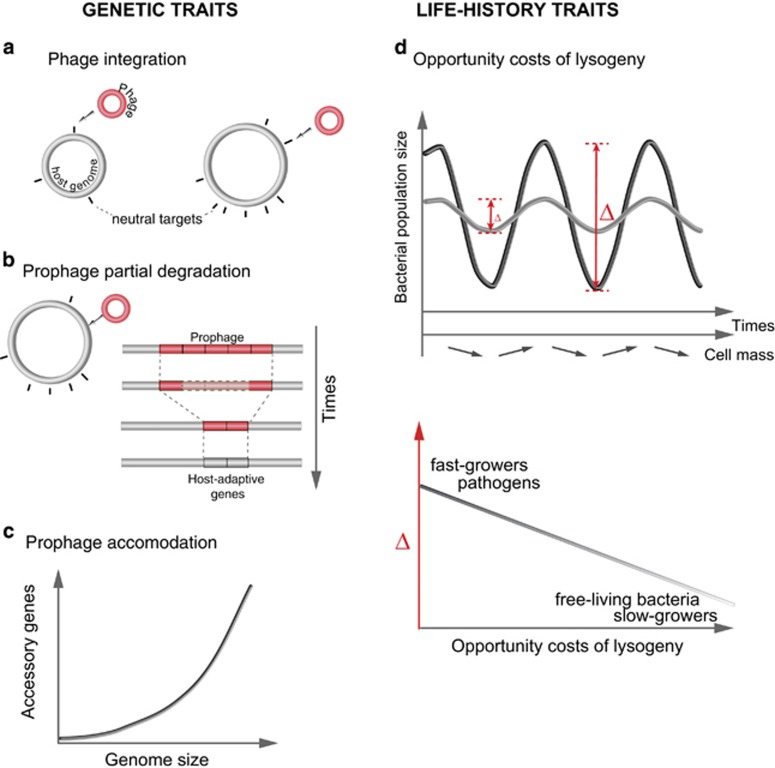
Nearly half of the sequenced bacteria are lysogens and many of their prophages encode adaptive traits. Yet, the variables driving prophage distribution remain undetermined. We identified 2246 prophages in complete bacterial genomes to study the genetic and life-history traits associated with lysogeny. While optimal growth temperatures and average cell volumes were not associated with lysogeny, prophages were more frequent in pathogens and in bacteria with small minimal doubling times. Their frequency also increased with genome size, but only for genomes smaller than 6 Mb. The number of spacers in CRISPR-Cas systems and the frequency of type III systems were anticorrelated with prophage frequency, but lysogens were more likely to encode type I and type II systems. The minimal doubling time was the trait most correlated with lysogeny, followed by genome size and pathogenicity. We propose that bacteria with highly variable growth rates often encounter lower opportunity costs for lysogeny relative to lysis. These results contribute to explain the paucity of temperate phages in certain bacterial clades and of bacterial lysogens in certain environments. They suggest that genetic and life-history traits affect the contributions of temperate phages to bacterial genomes.


Figures

Figure 1
Figure 1
Distribution of prophages among all the genomes (G) used in the analysis. (a) Distribution of the number of prophages per genome in the two prophage data sets (>18 kb in gray, >30 kb in black). At the top: fraction of lysogens (L+) and non-lysogens (L−) in the two prophage data sets. (b) Box-plot of the distribution of size of the genomes (Mb) of non-lysogens (L−) and lysogens (L+) (***significant difference: P<10−4, Wilcoxon test). The horizontal white line at the center of the box plot represents the median. The bottom and top of the box represent the first and third quartiles. The external edges of the whiskers represent the inner 10th and 90th percentiles. (c) Distribution of the average number (full line) and density (dash line) of prophages per host genome in function of the size of the bacterial genome (Mb) (G). The vertical gray line separates small and average from the largest bacterial genomes. There is a significant positive association between the host genome size and the number of prophages in the former (Spearman's ρ=0.41, P<10−4) but not the latter (Spearman's ρ=−0.12, P>0.1). The association between the density of prophages and the host genome size is positive for the former (Spearman's ρ=0.35, P<10−4) and negative for the latter (Spearman's ρ=−0.21, P<10−4). Similar qualitative results were obtained in the analysis using the complementary data sets including smaller prophages and data averaged across species (Supplementary Figure S2).
Figure 2
Figure 2
Analysis of the association between CRISPR-Cas systems and lysogeny among all the bacterial genomes (G). (a) Presence of CRISPR-Cas systems among lysogens (52%, L+) and non-lysogens (43%, L−) (***significant difference: P<10−4, χ2 test). (b) Distribution of the number of prophages per bacterial genome in lysogens (L+) in function of the presence of the different CRISPR-Cas systems (I, II, III) or when they are all absent (C−). Bacterial genomes encoding type III systems have fewer prophages than the others (***P<10−4 and **P<10−3, Wilcoxon test). Arrows indicate medians. (c) Distribution of the number of spacers in CRISPR arrays of bacterial genomes encoding CRISPR-Cas systems (C+) in function of the number of prophages per bacterial genome (Spearman's ρ=−0.21, P<10−4).
Figure 3
Figure 3
Analysis of the effect of species' (S) life-history traits on the distribution of lysogens. Box-plots of the distribution of the average cell volume (a) and optimal growth temperature (OGT, b) among the species with lysogens (red, L+) or lacking them (black, L−) (NS – nonsignificant differences: P>0.1, Wilcoxon test). (c) Proportion of species including bacterial pathogens (green, P+) or lacking them (black, P−) among species with lysogens (L+) or lacking them (L−) (**significant difference: P<10−3; χ2 test). Differences remained significant when controlling for genome size (P<10−4, stepwise regression) and phylogeny (P<10−4, generalized estimation equations analysis). (d) Box-plot of the distribution of the minimal doubling time under optimal conditions (d) among species with lysogens (L+) or lacking them (L−) (***significant difference: P<10−4, Wilcoxon test). Differences remained significant when controlling for bacterial genome size and phylogeny (P<10−4, generalized estimation equations analysis). (e) Proportion of fast (dark brown) and slow growers (light brown) among non-lysogens (L−) and lysogens (L+) (***significant difference: P<10−4, χ2 test). Arrows indicate medians.
Figure 4
Figure 4
Distribution of the average number of prophages per bacterial genome in function of bacterial traits. The arrows on the left of the graph indicate the average number of prophages per genome (averaged across species) in each subset. The number of prophages per bacterial genome increases significantly with the host genome size in all cases (***P<10−4, the values of Spearman's ρ are reported for each analysis), except among non-pathogenic (P−) fast growers (Spearman's ρ=0.11, P>0.1).
Figure 5
Figure 5
Genetic and life-history traits affecting the distribution of lysogens. (a) The number of neutral targets increases with the host genome size favoring phage integration. (b) Co-option of phage-related functions in degraded genetic elements increases with the number of prophages, and thus with the host genome size. After a certain time the few genes remaining in the bacterial genome may be too few or uncharacteristic to be detected as prophages. (c) Larger genomes have more accessory traits. (d) Fluctuating environmental conditions drive rapid expansion and contraction of bacterial populations (Δ), which are more important for fast growers and pathogenic bacteria than for slow growers and free-living bacteria (relative to pathogens with similar minimal doubling times). These fluctuations are associated with variations in cell mass and thus with burst size. They may also be associated with ecological conditions that constrain the lytic–lysogeny decision (such as the availability of susceptible hosts).

Similar articles

Cited by

References

    1. Abby SS, Neron B, Menager H, Touchon M, Rocha EP. (2014). MacSyFinder: A program to Mine genomes for molecular systems with an application to CRISPR-Cas systems. PLoS One 9: e110726. - PMC - PubMed
    1. Abedon ST. (2008) Bacteriophage Ecology: Population Growth, Evolution, and Impact of Bacterial Viruses. Cambridge University Press: Cambridge, NY, USA.
    1. Abedon ST, Lejeune JT. (2005). Why bacteriophage encode exotoxins and other virulence factors. Evol Bioinform Online 1: 97–110. - PMC - PubMed
    1. Akerlund T, Nordstrom K, Bernander R. (1995). Analysis of cell size and DNA content in exponentially growing and stationary-phase batch cultures of Escherichia coli. J Bacteriol 177: 6791–6797. - PMC - PubMed
    1. Bertani G. (1954). Studies on lysogenesis. III. Superinfection of lysogenic Shigella dysenteriae with temperate mutants of the carried phage. J Bacteriol 67: 696–707. - PMC - PubMed