

Identification of Non-HLA Genes Associated with Celiac Disease and Country-Specific Differences in a Large, International Pediatric Cohort
- PMID: 27015091
- PMCID: PMC4807782
- DOI: 10.1371/journal.pone.0152476
Identification of Non-HLA Genes Associated with Celiac Disease and Country-Specific Differences in a Large, International Pediatric Cohort
Abstract
Objectives: There are significant geographical differences in the prevalence and incidence of celiac disease that cannot be explained by HLA alone. More than 40 loci outside of the HLA region have been associated with celiac disease. We investigated the roles of these non-HLA genes in the development of tissue transglutaminase autoantibodies (tTGA) and celiac disease in a large international prospective cohort study.
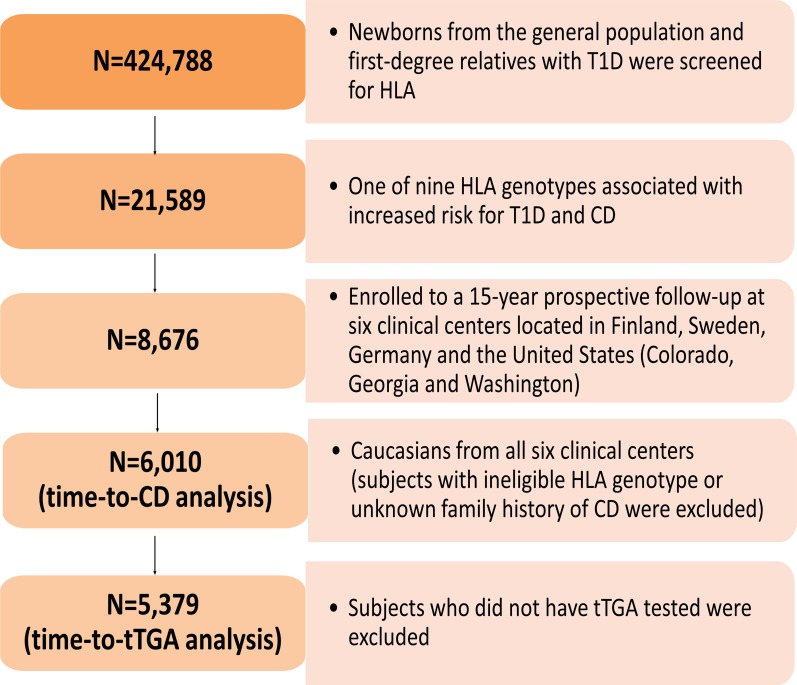
Methods: A total of 424,788 newborns from the US and European general populations and first-degree relatives with type 1 diabetes were screened for specific HLA genotypes. Of these, 21,589 carried 1 of the 9 HLA genotypes associated with increased risk for type 1 diabetes and celiac disease; we followed 8676 of the children in a 15 y prospective follow-up study. Genotype analyses were performed on 6010 children using the Illumina ImmunoChip. Levels of tTGA were measured in serum samples using radio-ligand binding assays; diagnoses of celiac disease were made based on persistent detection of tTGA and biopsy analysis. Data were analyzed using Cox proportional hazards analyses.
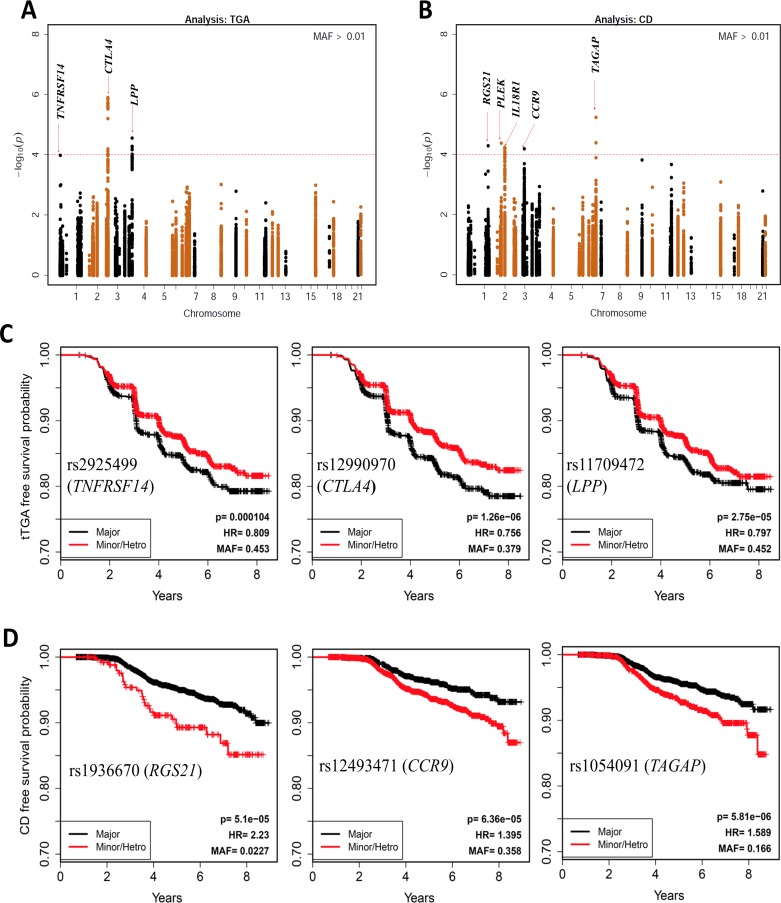
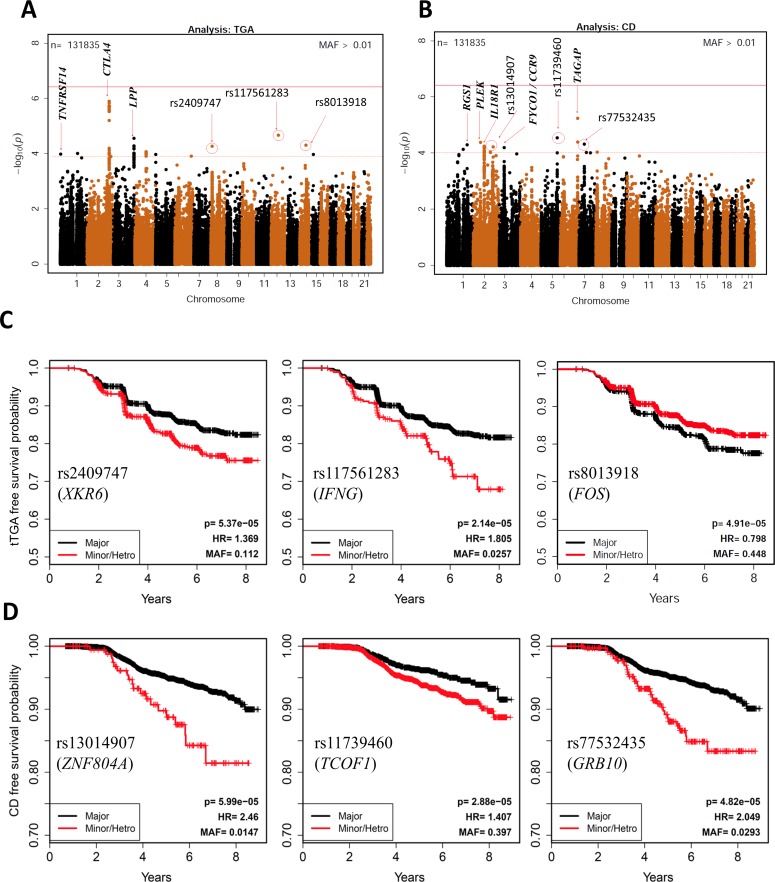
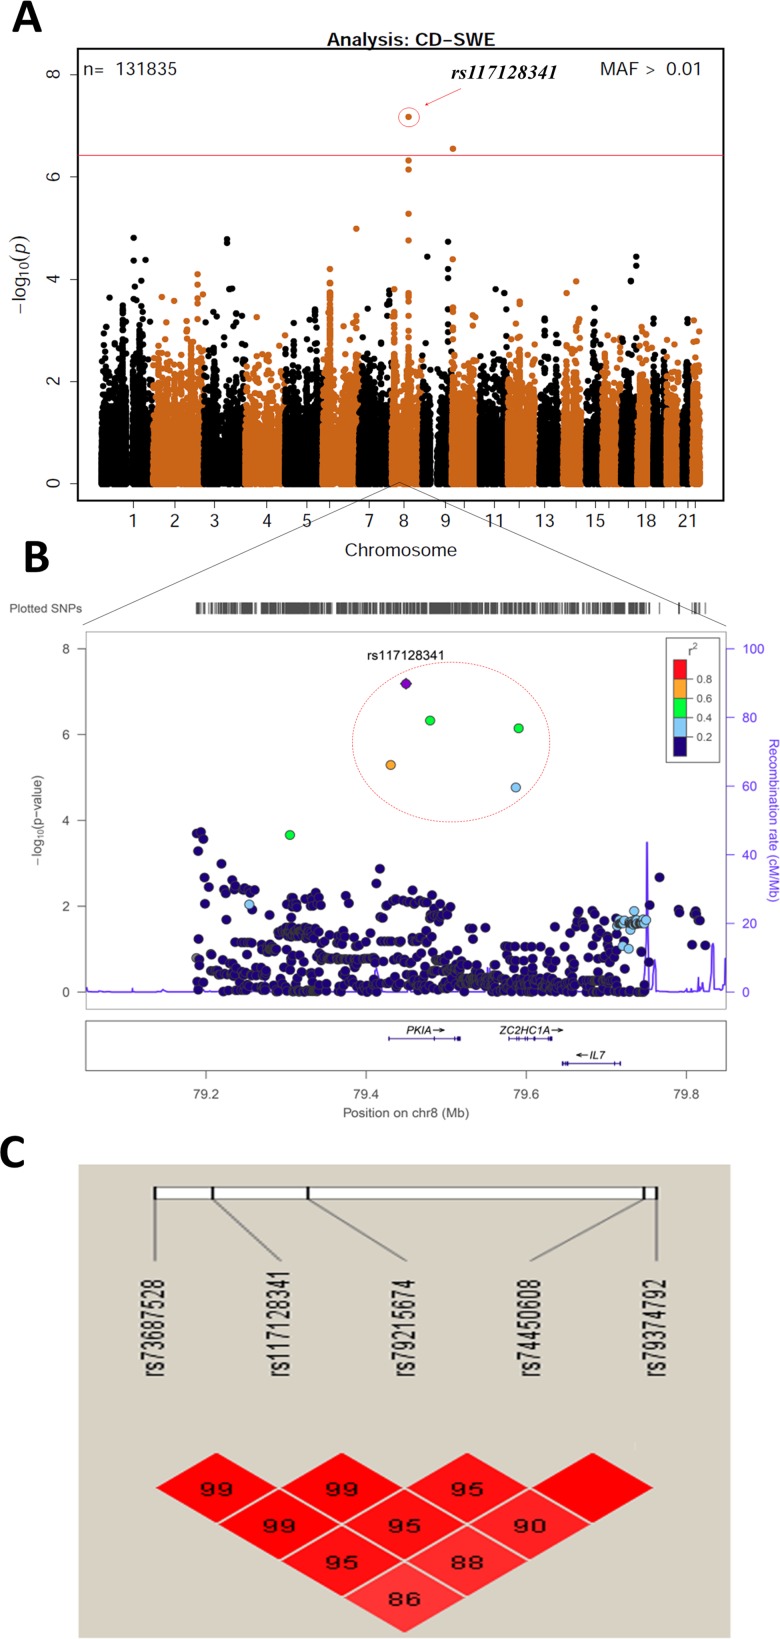
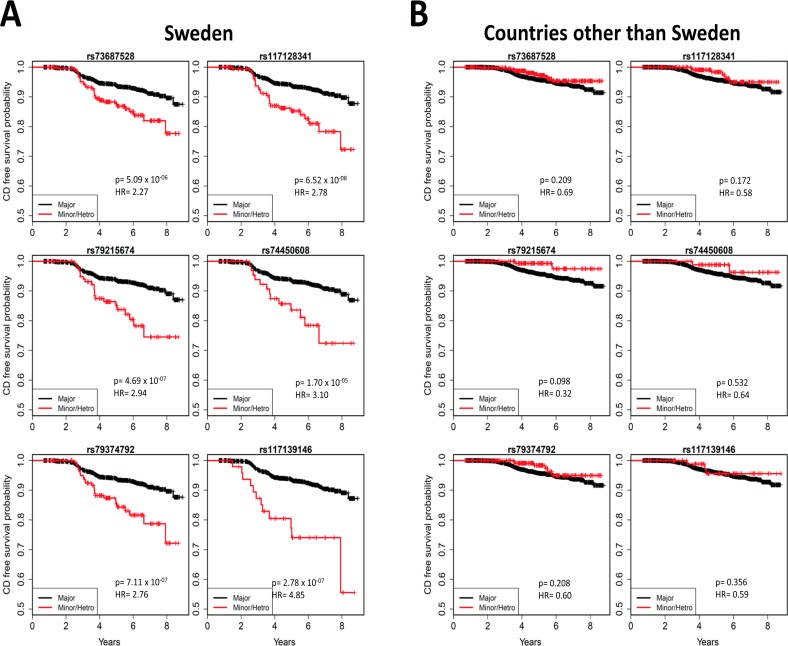
Results: We found 54 single-nucleotide polymorphisms (SNPs) in 5 genes associated with celiac disease (TAGAP, IL18R1, RGS21, PLEK, and CCR9) in time to celiac disease analyses (10-4>P>5.8x10⁻⁶). The hazard ratios (HR) for the SNPs with the smallest P values in each region were 1.59, 1.45, 2.23, 2.64, and 1.40, respectively. Outside of regions previously associated with celiac disease, we identified 10 SNPs in 8 regions that could also be associated with the disease (P<10-4). A SNP near PKIA (rs117128341, P = 6.5x10⁻⁸, HR = 2.8) and a SNP near PFKFB3 (rs117139146, P<2.8x10⁻⁷, HR = 4.9) reached the genome-wide association threshold in subjects from Sweden. Analyses of time to detection of tTGA identified 29 SNPs in 2 regions previously associated with celiac disease (CTLA4, P = 1.3x10⁻⁶, HR = 0.76 and LPP, P = 2.8x10⁻⁵, HR = .80) and 6 SNPs in 5 regions not previously associated with celiac disease (P<10-4); non-HLA genes are therefore involved in development of tTGA.
Conclusions: In conclusion, using a genetic analysis of a large international cohort of children, we associated celiac disease development with 5 non-HLA regions previously associated with the disease and 8 regions not previously associated with celiac disease. We identified 5 regions associated with development of tTGA. Two loci associated with celiac disease progression reached a genome-wide association threshold in subjects from Sweden.
Conflict of interest statement
Figures
References
-
- DeMarchi M, Borelli I, Olivetti E, Richiardi P, Wright P, Ansaldi N, et al. (1979) Two HLA-D and DR alleles are associated with coeliac disease. Tissue Antigens 14: 309–316. - PubMed
-
- Ploski R, Ek J, Thorsby E, Sollid LM (1993) On the HLA-DQ(alpha 1*0501, beta 1*0201)-associated susceptibility in celiac disease: a possible gene dosage effect of DQB1*0201. Tissue Antigens 41: 173–177. - PubMed
-
- Margaritte-Jeannin P, Babron MC, Bourgey M, Louka AS, Clot F, Percopo S, et al. (2004) HLA-DQ relative risks for coeliac disease in European populations: a study of the European Genetics Cluster on Coeliac Disease. Tissue Antigens 63: 562–567. - PubMed
-
- Kaukinen K, Partanen J, Maki M, Collin P (2002) HLA-DQ typing in the diagnosis of celiac disease. Am J Gastroenterol 97: 695–699. - PubMed
Publication types
MeSH terms
Substances
Grants and funding
- DK63865/DK/NIDDK NIH HHS/United States
- UC4 DK063863/DK/NIDDK NIH HHS/United States
- DK63790/DK/NIDDK NIH HHS/United States
- UC4 DK117483/DK/NIDDK NIH HHS/United States
- HHSN267200700014C/DK/NIDDK NIH HHS/United States
- DK63863/DK/NIDDK NIH HHS/United States
- DK63861/DK/NIDDK NIH HHS/United States
- U01 DK063829/DK/NIDDK NIH HHS/United States
- UC4 DK095300/DK/NIDDK NIH HHS/United States
- DK 63829/DK/NIDDK NIH HHS/United States
- UC4 DK063829/DK/NIDDK NIH HHS/United States
- UC4 DK112243/DK/NIDDK NIH HHS/United States
- DK63821/DK/NIDDK NIH HHS/United States
- UC4 DK106955/DK/NIDDK NIH HHS/United States
- DK63836/DK/NIDDK NIH HHS/United States
- UC4 DK100238/DK/NIDDK NIH HHS/United States
LinkOut - more resources
Full Text Sources
Other Literature Sources
Medical
Molecular Biology Databases
Research Materials
