. 2016 Mar 24;165(1):45-60.
doi: 10.1016/j.cell.2016.02.025.

Metastatic Latency and Immune Evasion through Autocrine Inhibition of WNT

Affiliations

Metastatic Latency and Immune Evasion through Autocrine Inhibition of WNT

Srinivas Malladi et al. Cell. .

Abstract

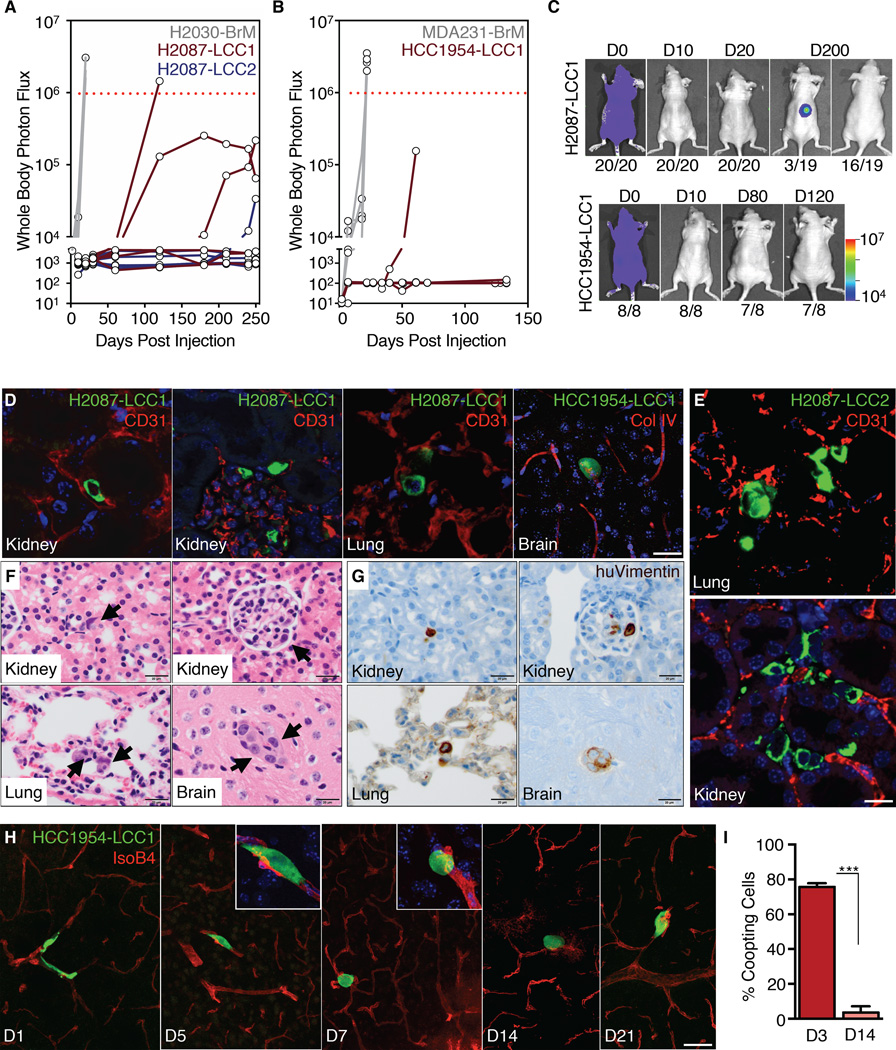
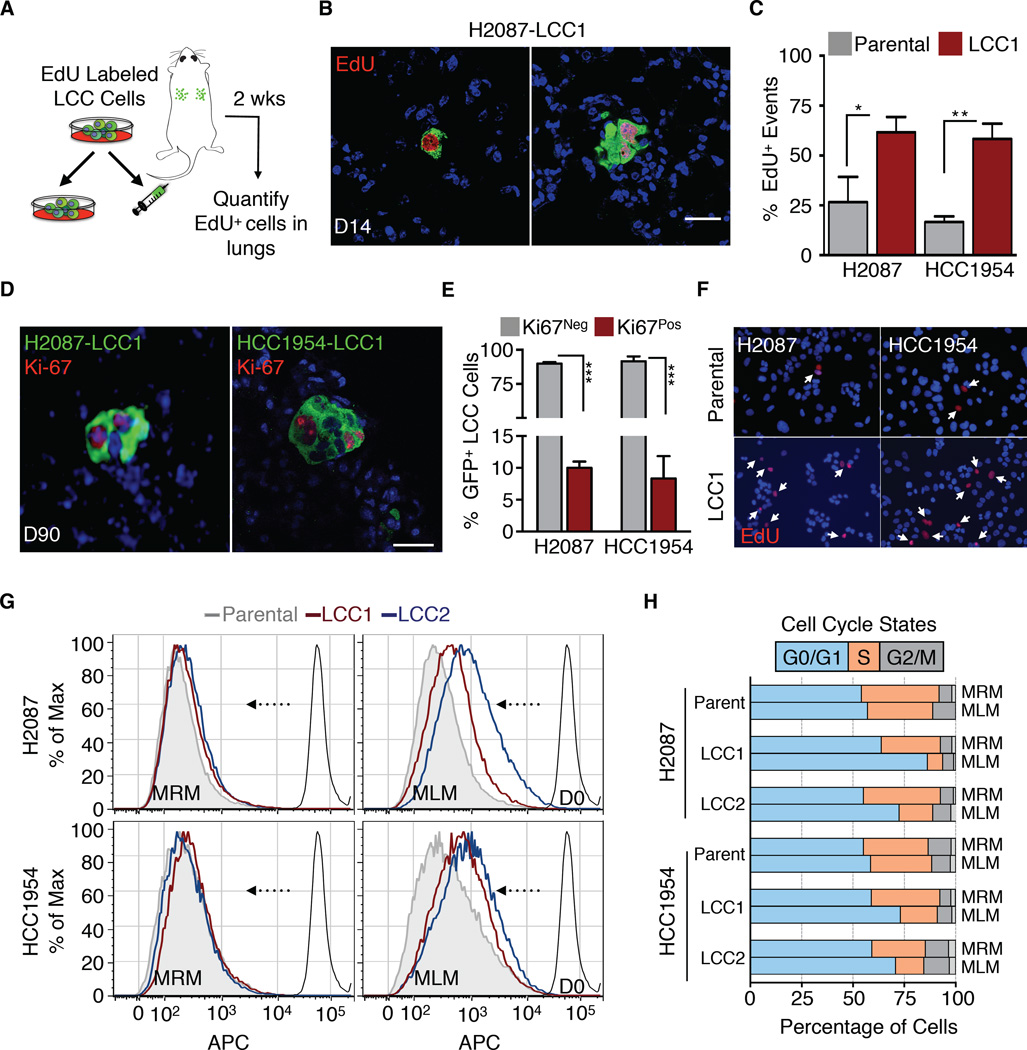
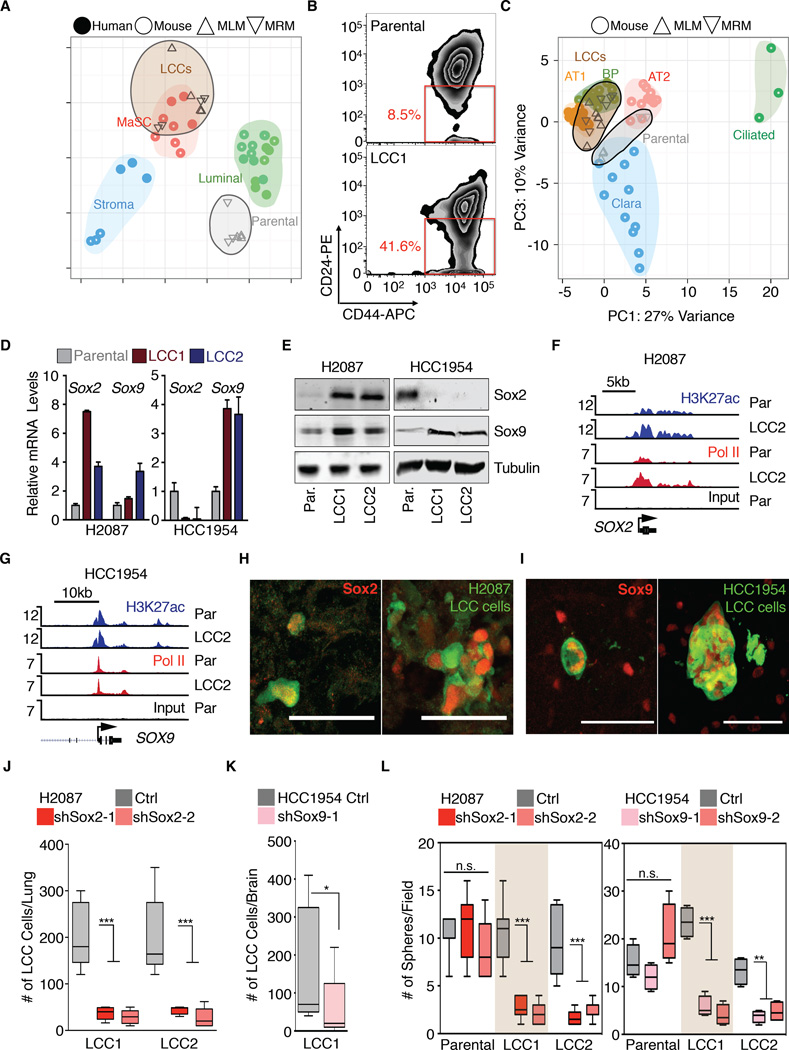
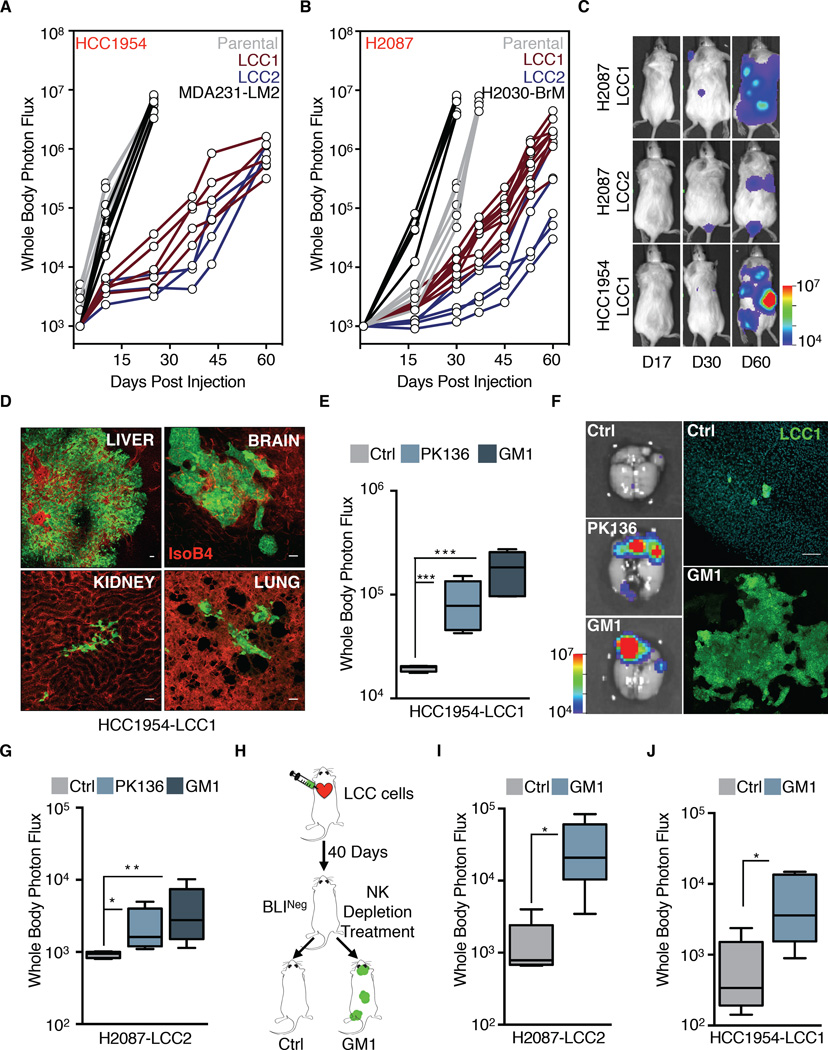
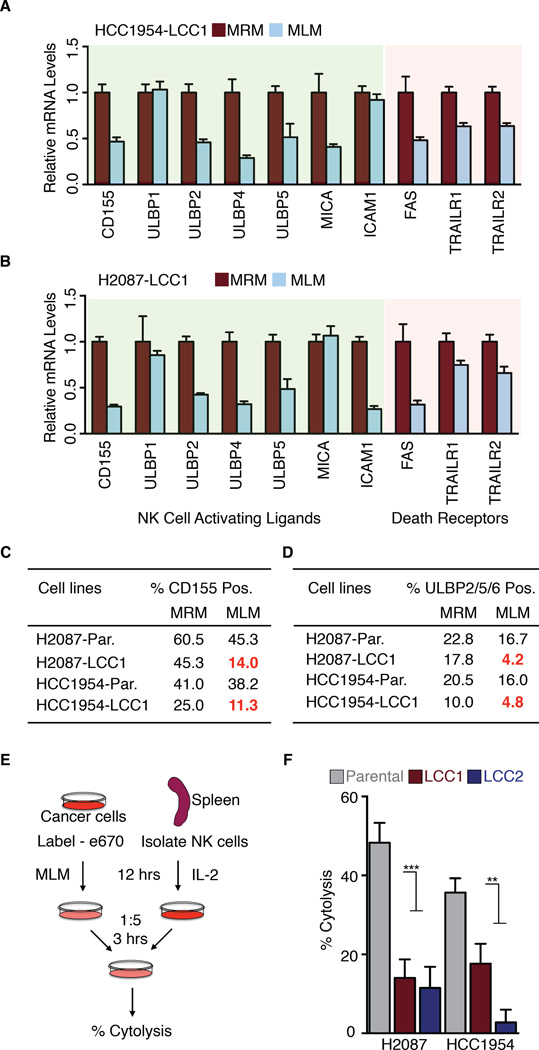
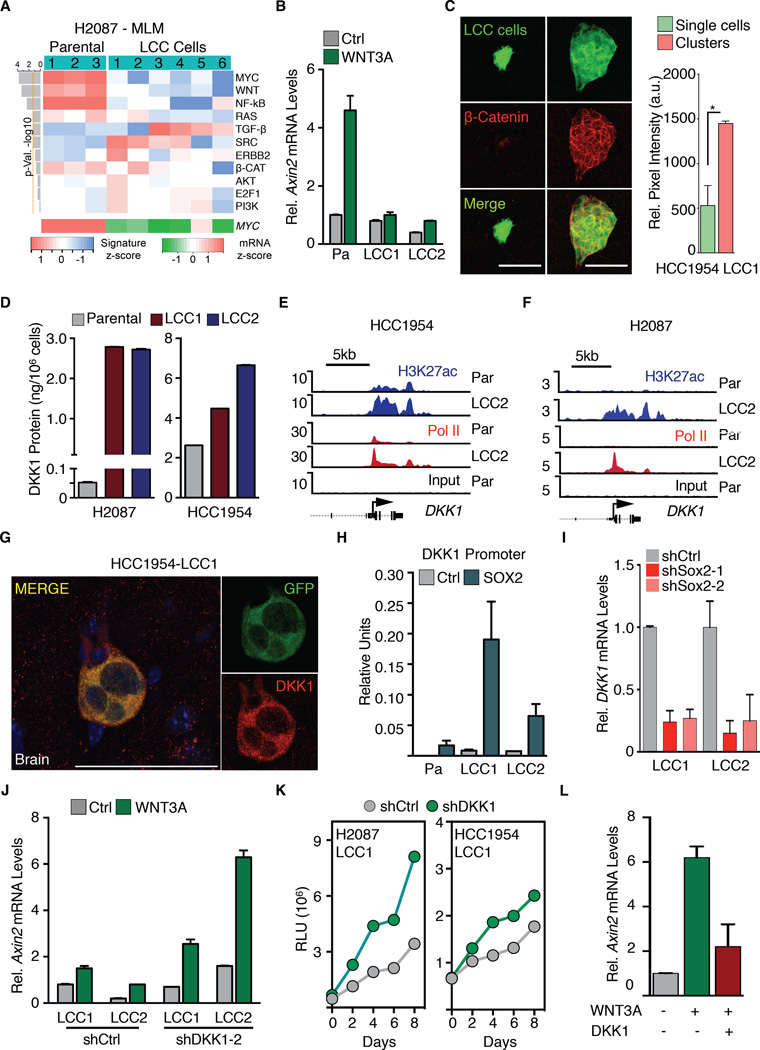
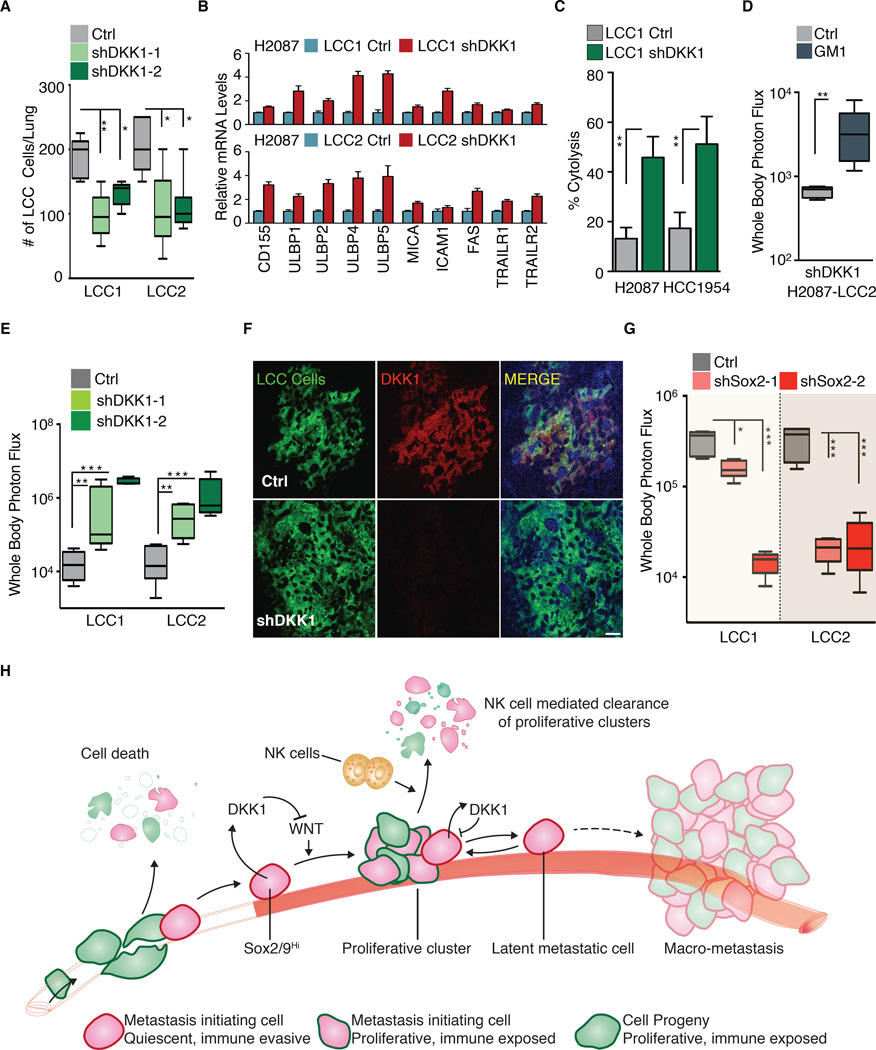
Metastasis frequently develops years after the removal of a primary tumor, from a minority of disseminated cancer cells that survived as latent entities through unknown mechanisms. We isolated latency competent cancer (LCC) cells from early stage human lung and breast carcinoma cell lines and defined the mechanisms that suppress outgrowth, support long-term survival, and maintain tumor-initiating potential in these cells during the latent metastasis stage. LCC cells show stem-cell-like characteristics and express SOX2 and SOX9 transcription factors, which are essential for their survival in host organs under immune surveillance and for metastatic outgrowth under permissive conditions. Through expression of the WNT inhibitor DKK1, LCC cells self-impose a slow-cycling state with broad downregulation of ULBP ligands for NK cells and evasion of NK-cell-mediated clearance. By expressing a Sox-dependent stem-like state and actively silencing WNT signaling, LCC cells can enter quiescence and evade innate immunity to remain latent for extended periods.


Figures

Figure 1
Figure 1. Localization and dormancy of disseminated LCC cells
(A-B) Bioluminescence Imaging (BLI) tracking of mice injected with the indicated cell lines. Each line represents an individual mouse. Mice with BLI signal above the dotted red line were euthanized. (C) Representative images of BLI signal in mice injected with the indicated LCC cell lines. The number of mice represented by each image is indicated at the bottom. (D) Immunofluorescence staining of disseminated LCC cells (green) next to capillaries (red) in the parenchyma of organ sites. (E) Infrequent H2087-LCC2 cell (green) clusters in the lung (top panel) or kidney (bottom panel); Vasculature (red). (F) Localization of H2087-LCC1 cells (arrows) in the renal tubule (top-left) or glomeruli (top-right) of the kidney, within alveolar walls of the lung (bottom-left), or capillaries in the brain (bottom-right) 3 months post-injection by H&E staining. (G) Immunohistochemical staining of disseminated H2087-LCC1 cells from panel 1F with human vimentin (brown). (H) Time-course analysis of HCC1954-LCC1 cell morphology (green) along capillaries (red) as they extravasate and colonize the brain. (I) Quantification of HCC1954-LCC1 cell morphology in the brain 3 days and 14 days post-injection. Data are mean percentage of coopting cells per brain ± S.E.M. N = 3 mice per group, scoring representative serial sections of the entire brain for each mouse. P < 0.001 (***), Student’s t-test. Scale bars, 10μm (D), 100μm (E), 20μm (F and G), and 50μm (H). See also Figure S1.
Figure 2
Figure 2. LCC cells adopt a slow-cycling state in vitro and in vivo
(A) Experimental design for EdU pulse-chase experiment. (B) Immunofluorescence images of double-positive GFP+/EdU+ LCC cells (green, red) in lungs. (C) Quantification of double-positive EdU+/GFP+ LCC cells versus parental counterparts in lungs harvested 2 weeks post-injection. Data are mean percentage of EdU+ cells per lung ± S.E.M. N = 3 mice per group, scoring representative serial sections of the entire lung for each mouse. P < 0.05 (*), P <0.01 (**), Mann-Whitney Test. (D) Representative immunofluorescence images of proliferating Ki-67+ (red) H2087-LCC1 (in lung) and HCC1954-LCC1 cells (in brain) 3 months post-injection. (E) Quantification of LCC cells from Figure 2D. Data are percentage of total cells that are Ki67+ per organ ± S.E.M. N = 5 per group, scoring representative serial sections of the entire organ of each mouse. P < 0.001 (***), Student’s t-test. (F) Micrographs of the indicated cell lines in culture 4 days post EdU labeling. White arrows point to cells retaining EdU label. (G) Retention of eFluor670 dye by indicated cell lines after 6 days in MRM or MLM culture conditions. (H) Cell cycle analysis of the indicated cell lines by BrdU/APC after 3 days in MRM or MLM culture conditions. Scale bars, 10μm (B and D), and 15μm (E). See also Figure S2.
Figure 3
Figure 3. LCC cells are enriched for stem cell-like characteristics
(A) Principal Component Analysis (PCA) of HCC1954 derivatives and normal breast cell populations of human or mouse origin. HCC1954-LCC cells resemble mammary stem cell (MaSC) gene expression profiles. (B) Flow cytometry analysis of shows marked enrichment in the CD44Hi/CD24Lo compartment, indicative of breast cancer stem cells in HCC1954 LCC1 cells. (C) PCA plot of H2087 derivatives and mouse bronchiolar and alveolar cell lineages. H2087-LCC cells cluster with the stem-like alveolar type 1 (AT) and bipotent progenitor (BP) cells. (D-E) Sox2 and Sox9 mRNA (D) and protein (E) expression in the indicated cell lines. (F-G) Gene track view for H3K27ac and Pol II ChIP-seq data at the Sox2 locus (F) and Sox9 locus (G) in the indicated cell lines. (H-I) Representative single cell and cell cluster images of Sox2 and Sox9 positive H2087-LCC1 in lung and HCC1954-LCC1 in brain. (J-K) Sox2 or Sox9 depletion attenuates survival of H2087-LCC and HCC1954-LCC cells in lungs and brain of athymic mice respectively. Data are total number of LCC cells scored in the lung 3 months post-injection or brains 2 months post injection. N = 5–6 mice per group, scoring representative serial sections of the organ. P <0.001 (***), Mann-Whitney Test. (L) Oncosphere-forming capacity upon Sox2 and Sox9 depletion in the indicated cell lines. Each panel depicts representative control or Sox2/9-depleted cell oncospheres. P < 0.01 (**), P < 0.001 (***), Student’s t-test. Scale bars, 50μm (H-I). See also Figure S3.
Figure 4
Figure 4. LCC cells are in equilibrium with the innate immune system
(A-B) BLI tracking of NSG mice injected with the indicated cell lines. Each line represents one mouse. (C) Representative images of BLI signal in NSG mice injected with the indicated LCC cell lines over the indicated time period. (D) Metastatic outgrowth of HCC1954-LCC1 (green) in the liver, brain, kidney and lungs of NSG mice 2 months post-injection. Vasculature: isolectin-B4 (red). (E-F) Depletion of NK cells by either anti-NK1.1 (PK136) or anti-asialo-GM1 antibody regimen allows outgrowth of HCC1954-LCC1 cells injected in athymic nude mice. Outgrowth quantified by whole body photon flux at 2 months post-injection, with whisker plots representing minimum and maximum values. N = 5–7 mice per group. P <0.001 (***), Mann-Whitney Test. Representative ex vivo brain BLI images of mice and brain tissue sections show massive outgrowth of HCC1954-LCC1 cells (green) upon NK depletion (F). (G) NK cell depletion regimens also allow for outgrowth of H2087-LCC2 cells in athymic nude mice. Whole body photon flux at 2 months post-injection, with whisker plots representing minimum and maximum values. N = 5–7 mice per group. P <0.05 (*), P <0.01 (**), Mann-Whitney Test. (H) NK depletion scheme in mice injected with LCC cells. (I-J) NK cell depletion regimen 40 days post extravasation allows for outgrowth of the indicated cell lines in athymic nude mice. Outgrowth quantified by whole body photon flux, with whisker plots representing minimum and maximum values. N = 5 mice per group. P <0.05 (*). Mann-Whitney Test. Scale bars, 100μm (D and F). See also Figure S4.
Figure 5
Figure 5. LCC cells evade NK cell mediated immune surveillance
(A-B) Genes important for NK cell recognition and cytotoxicity are downregulated in the indicated cell lines when grown in MLM conditions. (C-D) Cell surface expression of NK cell activating ligands CD155 and ULBP 2/5/6 in the indicated cell lines under MRM and MLM culture conditions. (E) Schematic of in vitro NK cell cytotoxicity experiment. Labeled cancer cells were incubated with activated primary NK cells at a 1:5 target:effector ratio for 3 hours, followed by quantification of remaining intact cancer cells. (F) H2087 and HCC1954-LCC cells are more resistant to NK-cell mediated cytotoxicity compared to parental counterparts. Data are mean percentage of cytolysis ± S.E.M. for three replicates. P <0.01 (**), P <0.001 (***), Student’s t-test. See also Figure S5.
Figure 6
Figure 6. Attenuated WNT signaling enforces quiescence in LCC cells
(A) Signaling pathway response signature analysis of H2087 derivatives under MLM conditions shows marked reduction in WNT and MYC pathway activity (upper panel). MYC mRNA z score of these derivatives was scored from RNA-seq data (lower panel). (B) H2087-LCC cells are less responsive to WNT pathway activation by WNT3A stimulation as measured by Axin2 expression. (C) Immunofluorescence images showing active β-Catenin expression (red) in clusters compared to single cells. Quantification of relative pixel intensity of β-Catenin is shown. N = 5 representative sections per condition. P < 0.05 (*), Student’s t-test. (D) DKK1 protein expression levels (ELISA) in H2087 and HCC1954-LCC derivatives relative to parental. Data are mean amount of secreted DKK1 protein ± S.E.M. N = 3 technical replicates per group. (E-F) Gene track view for H3K27ac and Pol II ChIP-seq data at the DKK1 locus in HCC1954 and H2087 parental and LCC cells. DKK1 gene body is represented at the bottom. (G) HCC1954-LCC1 cells (green) detected in the brain parenchyma 1 month post-injection in athymic nude mice express DKK1 (red). (H) Sox2 binding to the DKK1 promoter assayed by Sox2 ChIP followed by qRTPCR analysis of the DKK1 promoter in H2087 derivatives. Error bars ± S.D. (I) Dkk1 mRNA expression is diminished in H2087-LCC cells depleted of Sox2. (J) WNT pathway activation by WNT3a stimulation in H2087-LCC cells depleted of DKK1. Relative mRNA expression of Axin2 used as marker for WNT pathway activation. (K) Tracking of cell proliferation in the indicated cell lines cultured under MLM conditions by CellTiter-Glo assay. (L) Responsiveness of H2087 Parental cells to WNT-signaling induction by WNT3A stimulation in the presence or absence of recombinant human DKK1. Scale bars, 50μm (C and G). See also Figure S6.
Figure 7
Figure 7. DKK1 enforces a quiescent immune evasive state
(A) Growth of H2087-LCC cells depleted of DKK1 in athymic nude mice. Data are total number of LCC cells detected per lung after 3 months post-tail vein injection ± S.E.M. N = 5–6 mice per group, scoring representative serial sections of the entire lung for each mouse. (B) Relative mRNA expression of NK cell activating ligands and death receptors in H2087-LCC cells upon DKK1 depletion. Relative quantification is normalized to LCC1 or LCC2 control. (C) H2087 and HCC1954-LCC cells depleted of DKK1 are more susceptible to NK-cell mediated cytotoxicity compared to their controls. Data are mean percentage of cytolysis ± S.E.M. for three replicates. P <0.01 (**), Student’s t-test. (D) Depletion of NK cells by anti-asialo-GM1 in athymic nude mice injected with shDKK1 bearing H2087-LCC2 cells. Whole body photon flux, 2 months post-injection. N = 5–6 mice per group. P <0.01 (**), Mann-Whitney Test. (E) Growth of H2087-LCC cells depleted of DKK1 in NSG mice. Whole body photon flux, 2 months post-injection. N = 5–6 mice per group. P <0.01 (**), P <0.001 (***), Mann-Whitney Test. (F) Representative immunofluorescence images of metastatic lesions in the lungs of NSG mice in Figure 7E. (G) Growth of H2087-LCC cells depleted of Sox2 in NSG mice. Whole body photon flux, 2 months post-injection. N = 5–6 mice per group. P <0.05 (*), P <0.001 (***), Mann-Whitney Test. (H) A model summarizing the central tenets of latency recapitulated in the present latency competent cancer cell models. A majority of disseminated cancer cells including LCC cells suffer massive attrition in circulation or upon extravasation due to mechanical and metabolic stress and immune surveillance. LCC cells associate with the vasculature, are enriched for Sox2/Sox9 stem cell-like programs, stochastically enter proliferative quiescence, and are superior at seeding organs. LCC cells can proliferate in response to stimulatory microenvironmental cues after infiltrating distant organs, but NK cell dependent immune surveillance prevents accumulation of their progeny, sparing only LCC cells that entered quiescence stochastically. Cells enriched for DKK1 are able to attenuate the proliferative response to local WNT signals, enter quiescence. Quiescent cells downregulate the expression of cell surface NK sensors to evade immune surveillance. Surviving latent metastatic cells may evolve, accumulating traits for eventual outbreak to form macrometastases (refer to Discussion). Scale bars, 50μm (F). See also Figure S7.

Comment in

References

    1. Al-Hajj M, Wicha MS, Benito-Hernandez A, Morrison SJ, Clarke MF. Prospective identification of tumorigenic breast cancer cells. Proc. Natl. Acad. Sci. U.S.A. 2003;100:3983–3988. - PMC - PubMed
    1. Arnold K, Sarkar A, Yram MA, Polo JM, Bronson R, Sengupta S, Seandel M, Geijsen N, Hochedlinger K. Sox2(+) adult stem and progenitor cells are important for tissue regeneration and survival of mice. Cell Stem Cell. 2011;9:317–329. - PMC - PubMed
    1. Aslakson CJ, Miller FR. Selective events in the metastatic process defined by analysis of the sequential dissemination of subpopulations of a mouse mammary tumor. Cancer Res. 1992;52:1399–1405. - PubMed
    1. Bass AJ, Watanabe H, Mermel CH, Yu S, Perner S, Verhaak RG, Kim SY, Wardwell L, Tamayo P, Gat-Viks I, et al. SOX2 is an amplified lineage-survival oncogene in lung and esophageal squamous cell carcinomas. Nat. Genet. 2009;41:1238–1242. - PMC - PubMed
    1. Bradley M, Zeytun A, Rafi-Janajreh A, Nagarkatti PS, Nagarkatti M. Role of spontaneous and interleukin-2-induced natural killer cell activity in the cytotoxicity and rejection of Fas+ and Fas− tumor cells. Blood. 1998;92:4248–4255. - PubMed

Publication types

MeSH terms

Substances