. 2016 Mar 24;165(1):61-74.
doi: 10.1016/j.cell.2016.01.047.

Heterogeneity in Oct4 and Sox2 Targets Biases Cell Fate in 4-Cell Mouse Embryos

Affiliations

Heterogeneity in Oct4 and Sox2 Targets Biases Cell Fate in 4-Cell Mouse Embryos

Mubeen Goolam et al. Cell. .

Abstract

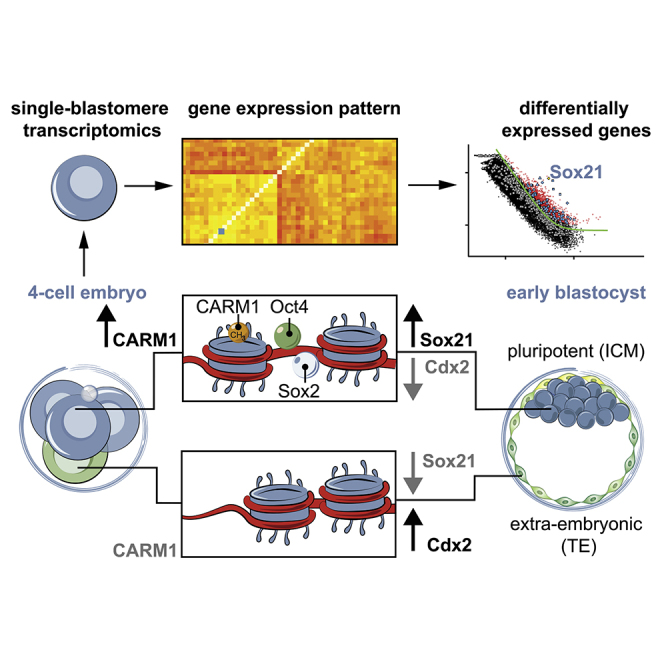
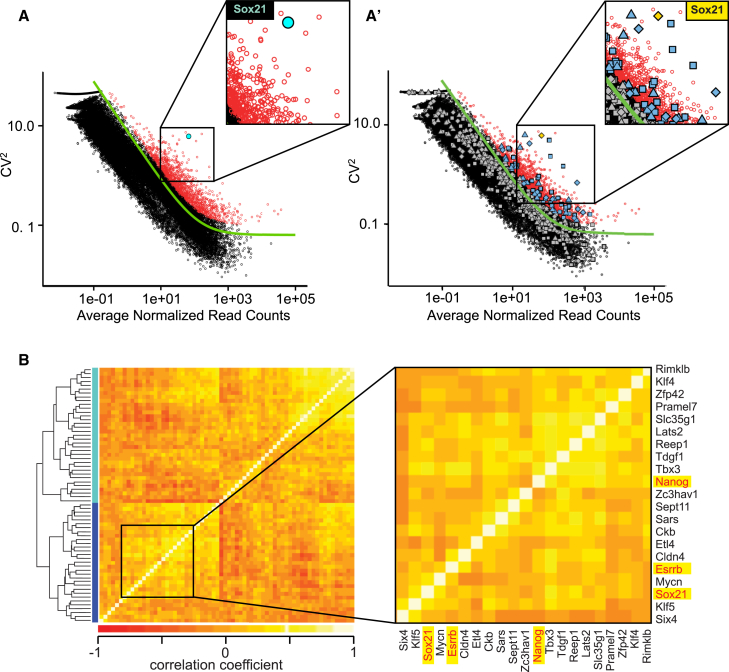
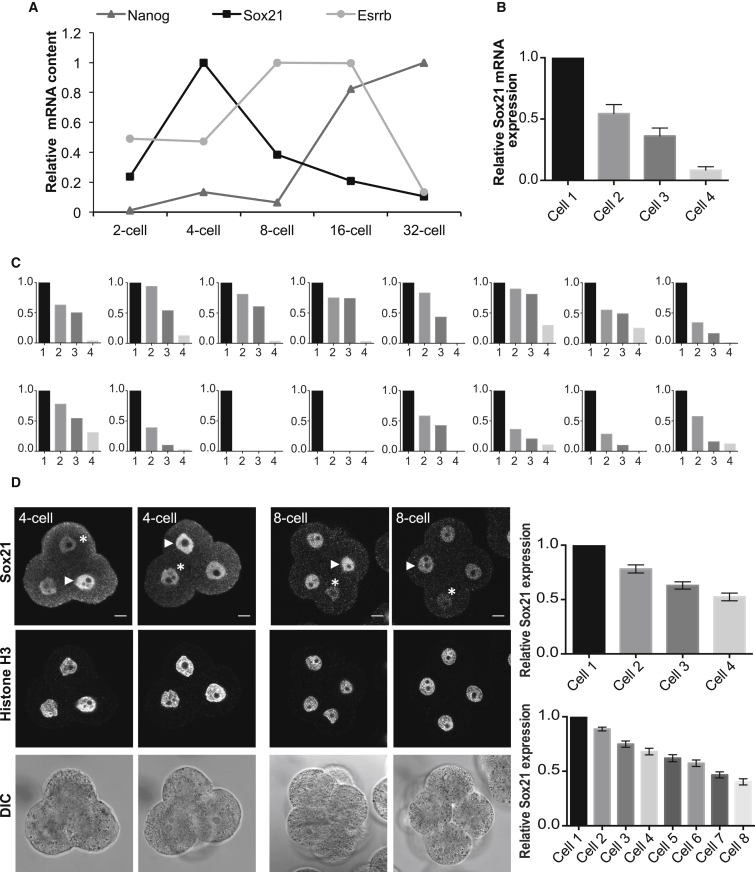
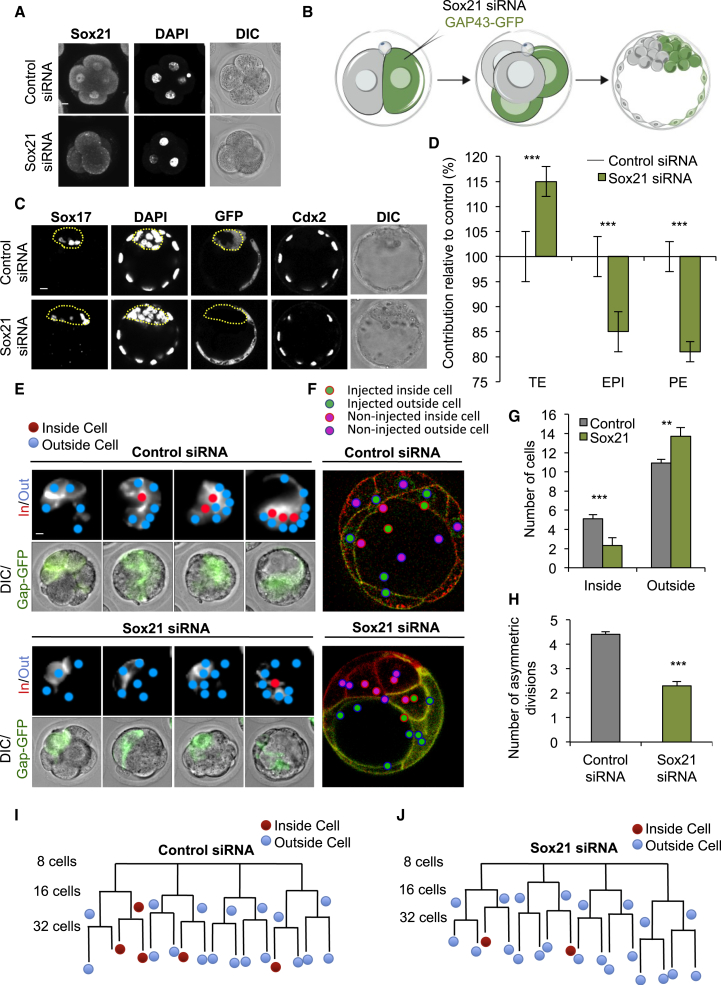
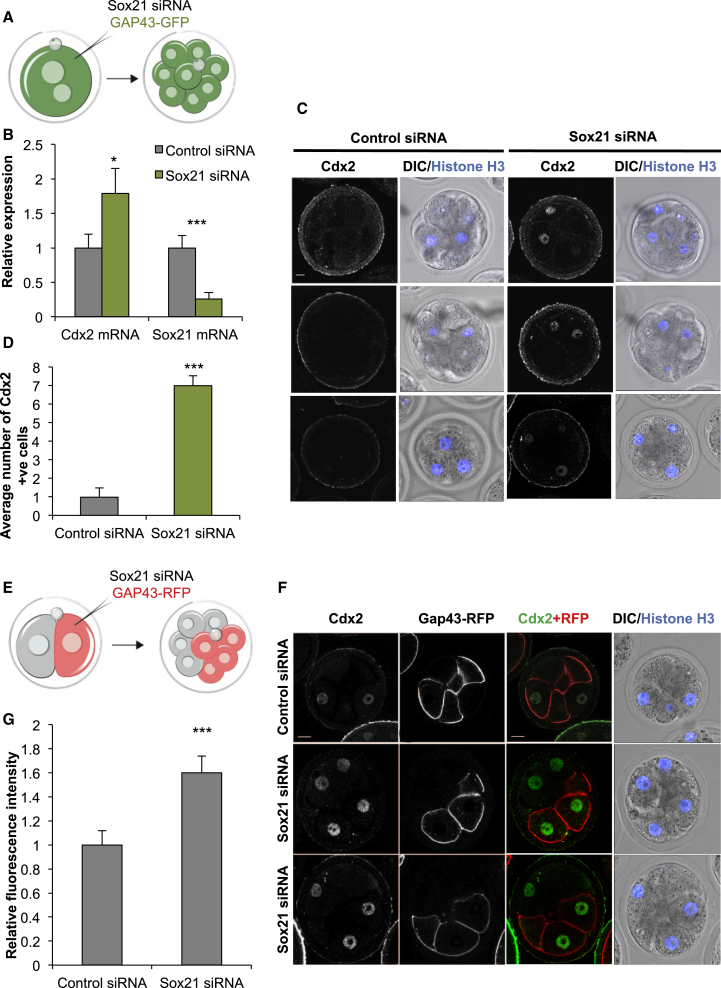
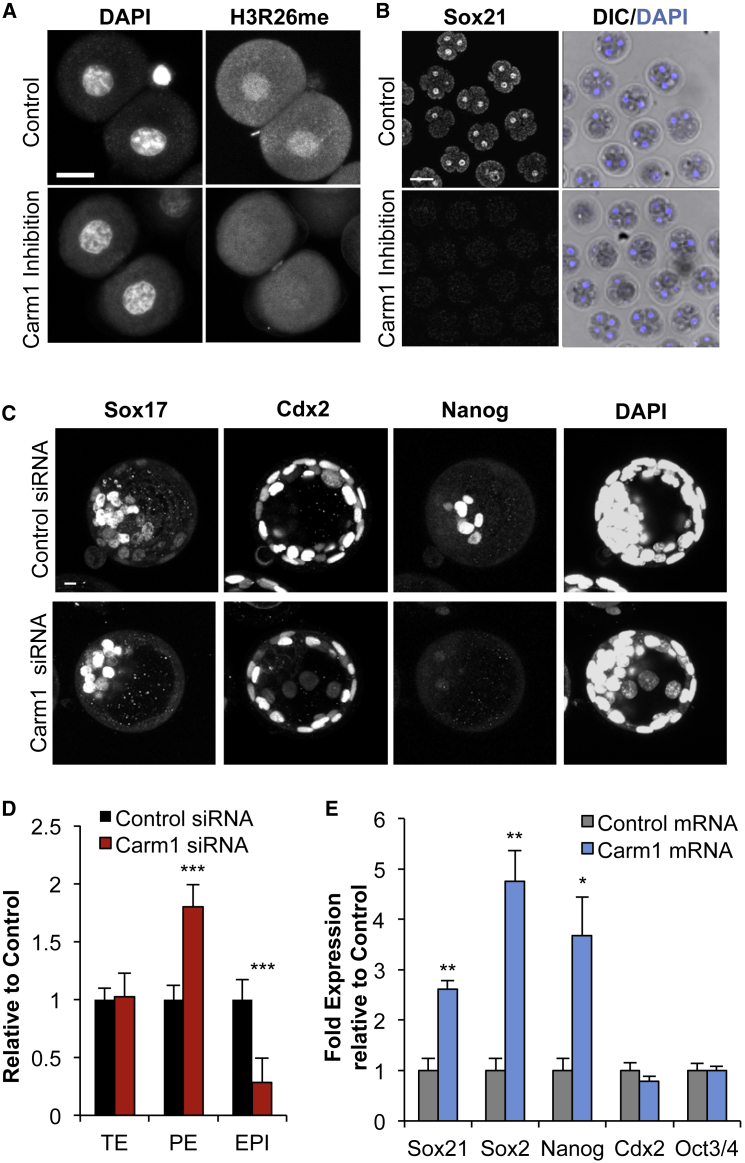
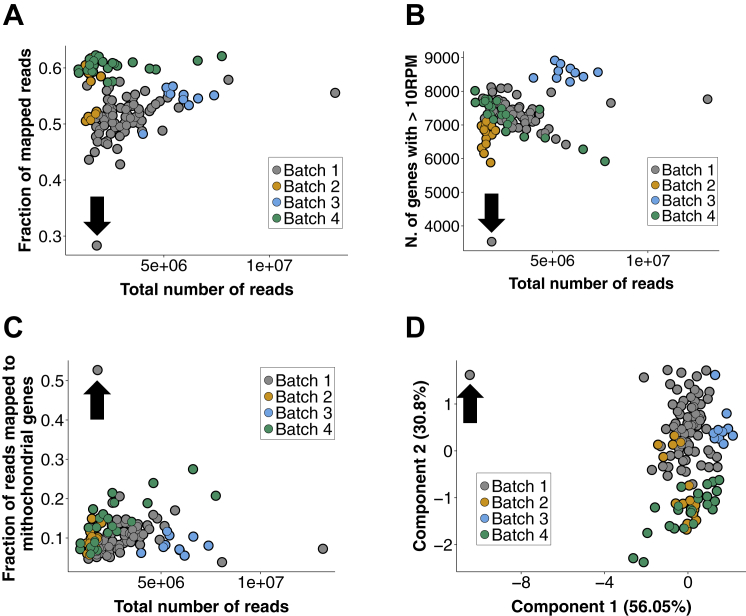
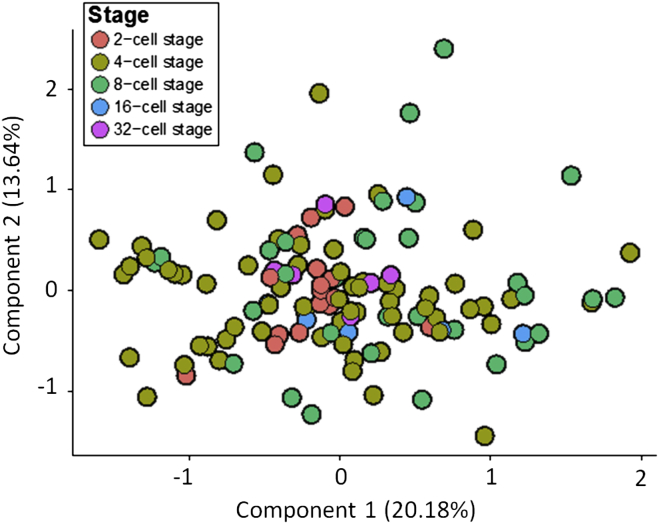
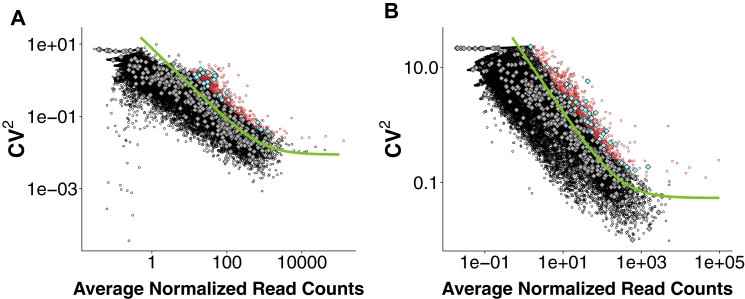
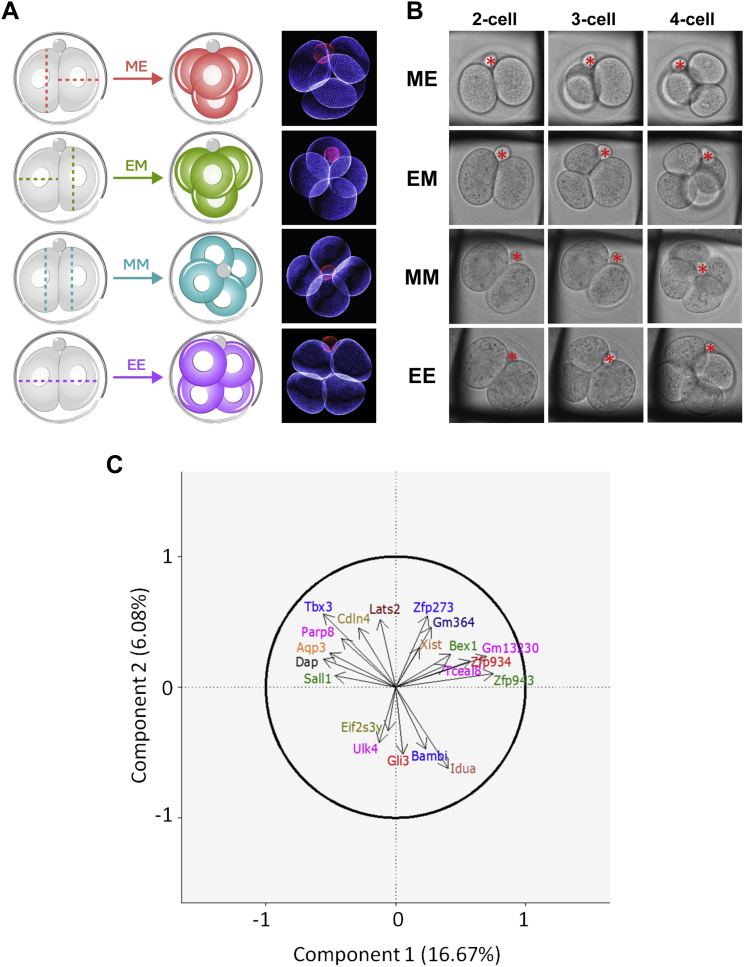
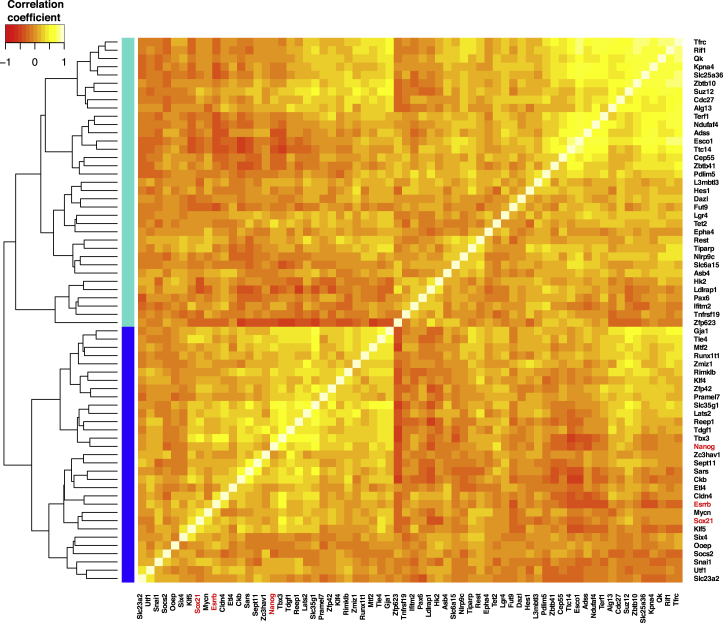
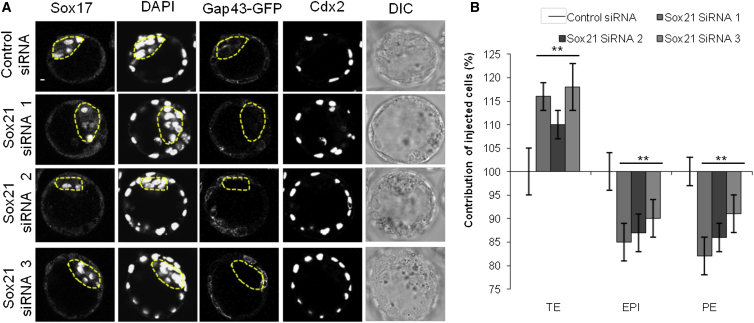
The major and essential objective of pre-implantation development is to establish embryonic and extra-embryonic cell fates. To address when and how this fundamental process is initiated in mammals, we characterize transcriptomes of all individual cells throughout mouse pre-implantation development. This identifies targets of master pluripotency regulators Oct4 and Sox2 as being highly heterogeneously expressed between blastomeres of the 4-cell embryo, with Sox21 showing one of the most heterogeneous expression profiles. Live-cell tracking demonstrates that cells with decreased Sox21 yield more extra-embryonic than pluripotent progeny. Consistently, decreasing Sox21 results in premature upregulation of the differentiation regulator Cdx2, suggesting that Sox21 helps safeguard pluripotency. Furthermore, Sox21 is elevated following increased expression of the histone H3R26-methylase CARM1 and is lowered following CARM1 inhibition, indicating the importance of epigenetic regulation. Therefore, our results indicate that heterogeneous gene expression, as early as the 4-cell stage, initiates cell-fate decisions by modulating the balance of pluripotency and differentiation.


Figures

None
Graphical abstract
Figure 1
Figure 1
Cellular Heterogeneity in Overall Gene Expression Patterns (A) Scheme of development from the fertilized egg (zygote) to the blastocyst stage with three lineages: epiblast (EPI; blue), primitive endoderm (PE, red), and trophectoderm (TE, green). The mechanism(s) initiating these cell-fate decisions remains unknown (reviewed in Zernicka-Goetz et al., 2009). (B) Principal component analysis of the gene expression patterns of single cells at different stages. The percentage of variance explained by each principal component is indicated in parentheses. (C) Spearman correlation coefficients of blastomeres within the same embryo (intra-embryonic) and in different embryos (inter-embryonic) at the 2-, 4-, and 8-cell stage. Asterisks indicate statistically significant differences (Welch’s t test). (D) Venn diagram with the number of genes having a significantly high degree of heterogeneous expression at 2-, 4-, and 8-cell stages. (E) Principal component analysis of the transcriptomes of cells from embryos at the 4-cell stage with different division patterns: ME, six embryos; EM, six embryos; MM, three embryos; EE, one embryo. M, meridional; E, equatorial cell division. See also Figures S1, S2, S3, and S4, Tables S1 and S2, and Data S1.
Figure 2
Figure 2
Heterogeneous Expression of Oct4 and Sox2 Target Genes at the 4-Cell Stage (A) To find highly variable genes, we used the parameterization CV2 = a1/μ + α0 to fit the relationship between the square of the coefficient of variation, CV2, and the average expression level μ (green continuous curve; see Experimental Procedures for further details). All highly variable genes (with an adjusted p value < 0.1) marked by red circles. Sox21, cyan circle. (A′) The same information from (A) but with Oct4 and/or Sox2 targets indicated (diamonds mark shared Sox2 and Oct4 targets, squares mark Oct4 targets, and triangles mark Sox2 targets). Gray symbols mark Oct4 and/or Sox2 targets that are not variable and blue symbols mark Oct4 and/or Sox2 targets that are highly variable at the 4-cell stage. Sox21 is marked in gold. (B) Heatmap showing the Spearman correlation coefficient among highly variable Oct4 and/or Sox2 targets. A dynamic tree cut algorithm identified two clusters of genes showing similar patterns of correlations (colored side bars; Experimental Procedures). See also Figure S5.
Figure 3
Figure 3
Sox21 mRNA and Protein Expression Is Heterogeneous and Peaks at the 4-Cell Stage (A) Relative mRNA expression of Sox21, Nanog, and Esrrb. (B) Average relative Sox21 mRNA levels in 4-cell embryos. (C) Relative Sox21 mRNA expression in all individual 4-cell embryos. (D) Immunofluorescence of Sox21 in 4-cell (n = 25) and 8-cell (n = 23) embryos. Fluorescence quantified and normalized to the nucleus with the strongest staining per individual 4-cell or 8-cell embryo. Arrowheads indicate highest expressing cell. Asterisks indicated lowest expressing cells. Error bars represent SEM. Scale bars, 10 μm.
Figure 4
Figure 4
Decreasing Sox21 Expression Leads Cells to an Extra-Embryonic Fate (A) Verification of Sox21 siRNA efficiency at the 4-cell stage (Control siRNA n = 20, Sox21 siRNA n = 21). The nuclear immunofluorescence signal is lost in embryos injected with Sox21 siRNA. (B) Scheme of clonal Sox21 siRNA. One blastomere of 2-cell stage embryos injected with Sox21 siRNA or control siRNA, and GFP mRNA. Embryos cultured to the late blastocyst stage and the contribution of the injected cells’ progeny to each lineage analyzed. (C) Confocal images of control (n = 38) and Sox21 (n = 75) siRNA embryos. Sox17 (primitive endoderm, PE) and Cdx2 (TE) used as lineage markers. Dotted lines mark the ICM. (D) Contribution of Sox21 siRNA cells to TE, PE, and EPI, relative to control siRNA cells. (E) Time-lapse study following Sox21 siRNA (n = 16 embryos, 256 cells) or control siRNA (n = 18 embryos, 288 cells). Gap43-GFP expression indicates blastomeres injected with either control or Sox21 siRNA. Fluorescence images are overlaid with cell-tracking spheres. (F) Example slice through embryos showing inside and outside cell fate of either control or Sox21 siRNA blastomeres. (G) Number of inside and outside cells contributed from injected blastomeres at the 32-cell stage. (H) Number of asymmetric divisions injected blastomeres underwent from the 8- to 32-cell stage. (I and J) Lineage trees from two representative embryos. All injected cells were traced to the 32-cell stage. A cell was defined as occupying an inside position when enclosed from the outside environment by neighboring cells. Inside or outside cell fate indicated. Error bars represent SEM. Wilcoxon rank-sum test was used to test significance ∗∗p < 0.01, ∗∗∗p < 0.001. Scale bars represent 10 μm. See also Figure S6.
Figure 5
Figure 5
Sox21 Depletion Prematurely Upregulates Cdx2 Expression (A) Scheme of Sox21 siRNA experiment. Zygotes injected with Sox21 siRNA, or control siRNA, and isolated at the 8-cell stage for immunostaining or qRT-PCR. (B) qRT-PCR of embryos injected with either control siRNA (n = 75 embryos, three biological replicates) or Sox21 siRNA (n = 85 embryos, three biological replicates) comparing mRNA expression of Cdx2 and Sox21 at the late 8-cell stage. Student’s t test was used to test significance p < 0.05, ∗∗∗p < 0.001. (C) Confocal images of Cdx2 and Histone H3 expression in control (n = 12) and Sox21 (n = 12) siRNA embryos at the early 8-cell stage. (D) Quantification of the number of Cdx2 positive cells from (C). Student’s t test was used to test significance ∗∗∗p < 0.001. (E) Scheme of Sox21 siRNA experiment. One blastomere of 2-cell stage embryos was injected with Sox21 siRNA or control siRNA and Gap43-RFP mRNA and the 8-cell embryos isolated. (F) Confocal images of Cdx2 and Histone H3 expression in late 8-cell stage embryos after injection of one blastomere at the 2-cell stage with either control siRNA (n = 11) or Sox21 siRNA (n = 13). Gap43-RFP expression on the membrane identifies injected cells. (G) Quantification of relative fluorescence intensity of Cdx2 staining from (F). Wilcoxon rank-sum test was used to test significance ∗∗∗p < 0.001. Scale bars, 10 μm. Error bars represent SEM.
Figure 6
Figure 6
Sox21 Expression Is Regulated by CARM1 Activity (A) Verification of CARM1 inhibition by staining for the presence of H3R26me (control n = 21, CARM1 inhibition n = 15). Scale bars, 20 μm. (B) Confocal images of Sox21 expression in 4-cell embryos after being treated from the 2-cell stage with either DMSO control (n = 27) or CARM1 inhibitor (n = 24). Scale bar, 50 μm. (C) Confocal images of control (n = 12) and Carm1 siRNA (n = 8) embryos. Sox17 (PE), Cdx2 (TE), and Nanog (EPI) used as lineage markers. Scale bars, 10 μm. (D) Overall number of TE, PE, and EPI cells present in Carm1 siRNA-injected embryos, relative to control siRNA cells. Student’s t test was used to test significance ∗∗∗p < 0.001. (E) qRT-PCR of embryos injected with either control mRNA (n = 66 embryos, three biological replicates) or CARM1 mRNA (n = 75 embryos, three biological replicates). Embryos injected at the zygote stage and isolated for qRT-PCR at the late 8-cell stage Student’s t test was used to test significance p < 0.05, ∗∗p < 0.01. Error bars represent SEM.
Figure 7
Figure 7
Model of How Cellular Heterogeneities at the 4-Cell Stage Regulate Cell Fate (A–C) In 4-cell embryos, CARM1, which methylates histone H3R26, is differentially expressed (Torres-Padilla et al., 2007). We hypothesize that higher levels of histone H3R26me facilitate the binding to DNA of pluripotency regulators such as Oct4 and Sox2, resulting in increased transcription of pluripotency-related target genes, such as Sox21, Nanog, and Esrrb, biasing these cells to contribute to the pluripotent lineage. Conversely, in cells with lower levels of histone H3R26me, pluripotency regulators are only able to bind to DNA for shorter periods of time, and therefore their target genes are not as highly expressed. These cells have lower levels of pluripotency and are thus more likely to initiate expression of differentiation genes, such as Cdx2, and initiate development into the extra-embryonic TE.
Figure S1
Figure S1
Quality Control Analyses of Single-Cell Transcriptomes, Related to Figure 1 (A–C) The fraction of mapped reads (panel A), the number of genes with more than 10 Reads per Million (panel B) and the fraction of mapped reads allocated to mitochondrial genes were plotted as a function of the total number of reads for all samples. Different colors mark different batches. (D) Principal Component Analysis of the three metrics plotted in panels A-C. The percentage of variance explained by each principal component is indicated in parentheses. The black arrow in all four panels marks the outlier (sample name “32cell_F”) that was removed from all downstream analysis.
Figure S2
Figure S2
Principal Component Analysis of ERCC Spike-ins from the Samples Shown in Figure 1B, Related to Figure 1 Principal Component Analysis of the log-transformed counts of ERCC spike-ins added to each cells. The numbers in parentheses indicate the percentage of total variance explained by each principal component.
Figure S3
Figure S3
Highly Variable Genes in Embryos at 2- and 8-Cell Stage, Related to Figure 1 Genes displaying a high variability in embryos at 2- (panel A) and 8-cell (panel B) stage were identified, as described in Experimental Procedures. All highly variable genes (with an adjusted p-value < 0.1) are marked by red circles or cyan diamonds. Diamonds mark Oct4/Sox2 target genes.
Figure S4
Figure S4
Gene Expression Differences of 4-Cell Stage Embryos with Different Division Patterns, Related to Figure 1 (A) The four different 4-cell stage embryos defined by division pattern. (B) Live-imaging of embryos to score 2-to 4-cell division pattern. C) 20 genes with the most positive and negative loadings on the first 2 principal components shown in Figure 1C are plotted, with the arrow indicating the correlation with each principal component.
Figure S5
Figure S5
Heatmap Showing the Spearman Correlation Coefficient among Highly Variable Oct4 and/or Sox2 Targets, Related to Figure 2 A dynamic tree cut algorithm identified two clusters of genes showing similar patterns of correlations (colored side bars; Experimental Procedures).
Figure S6
Figure S6
Sox21 Depletion with Three Individual siRNAs Biases Cells toward an Extra-Embryonic Cell Fate, Related to Figure 4 (A) Confocal images of control (n = 24) and Sox21 siRNA 1 (n = 12), Sox21 siRNA 2 (n = 14) and Sox21 siRNA 3 (n = 18) siRNA embryos. Sox17 (PE) and Cdx2 (TE) were used as cell lineage markers. Dotted lines mark the ICM. (B) Contribution of Sox21 siRNA 1,2 and 3 injected cells to TE, PE and EPI, relative to control siRNA cells.

Comment in

References

    1. Anders S., Pyl P.T., Huber W. HTSeq—a Python framework to work with high-throughput sequencing data. Bioinformatics. 2015;31:166–169. - PMC - PubMed
    1. Biase F.H., Cao X., Zhong S. Cell fate inclination within 2-cell and 4-cell mouse embryos revealed by single-cell RNA sequencing. Genome Res. 2014;24:1787–1796. - PMC - PubMed
    1. Bischoff M., Parfitt D.E., Zernicka-Goetz M. Formation of the embryonic-abembryonic axis of the mouse blastocyst: relationships between orientation of early cleavage divisions and pattern of symmetric/asymmetric divisions. Development. 2008;135:953–962. - PMC - PubMed
    1. Brennecke P., Anders S., Kim J.K., Kołodziejczyk A.A., Zhang X., Proserpio V., Baying B., Benes V., Teichmann S.A., Marioni J.C., Heisler M.G. Accounting for technical noise in single-cell RNA-seq experiments. Nat. Methods. 2013;10:1093–1095. - PubMed
    1. Buettner F., Natarajan K.N., Casale F.P., Proserpio V., Scialdone A., Theis F.J., Teichmann S.A., Marioni J.C., Stegle O. Computational analysis of cell-to-cell heterogeneity in single-cell RNA-sequencing data reveals hidden subpopulations of cells. Nat. Biotechnol. 2015;33:155–160. - PubMed

Publication types

MeSH terms