

The Relevance of Sex Differences in Performance Fatigability
- PMID: 27015385
- PMCID: PMC5349856
- DOI: 10.1249/MSS.0000000000000928
The Relevance of Sex Differences in Performance Fatigability
Abstract
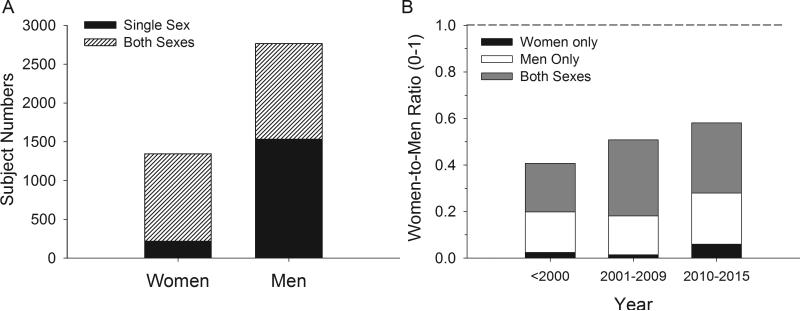
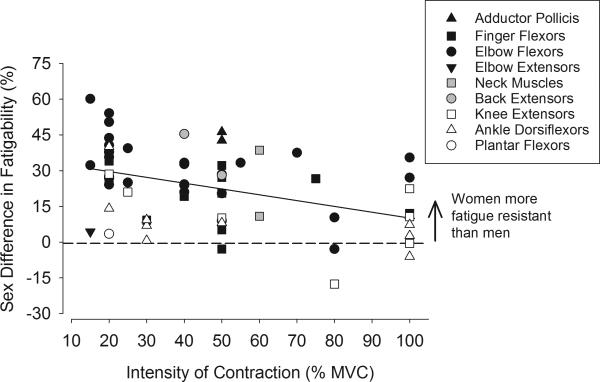
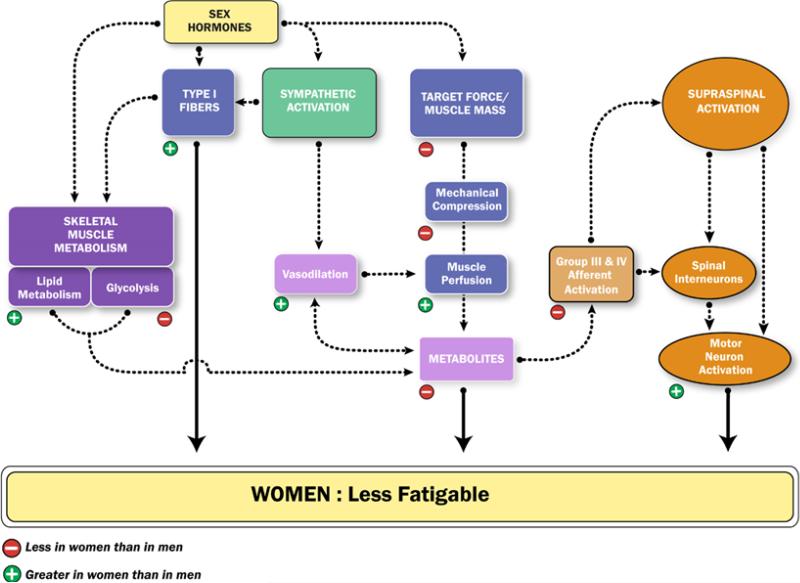
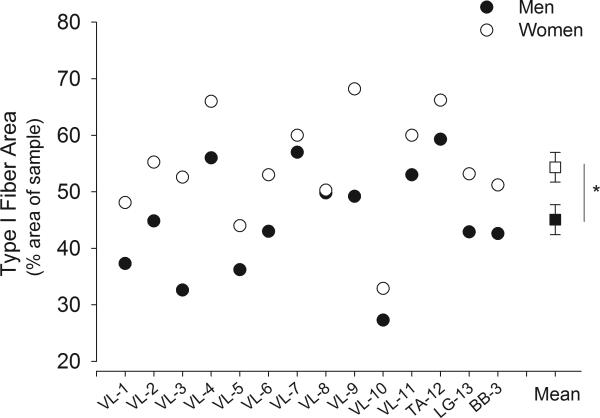
Performance fatigability differs between men and women for a range of fatiguing tasks. Women are usually less fatigable than men, and this is most widely described for isometric fatiguing contractions and some dynamic tasks. The sex difference in fatigability is specific to the task demands so that one mechanism is not universal, including any sex differences in skeletal muscle physiology, muscle perfusion, and voluntary activation. However, there are substantial knowledge gaps about the task dependency of the sex differences in fatigability, the involved mechanisms, and the relevance to clinical populations and with advanced age. The knowledge gaps are in part due to the significant deficits in the number of women included in performance fatigability studies despite a gradual increase in the inclusion of women for the last 20 yr. Therefore, this review 1) provides a rationale for the limited knowledge about sex differences in performance fatigability, 2) summarizes the current knowledge on sex differences in fatigability and the potential mechanisms across a range of tasks, 3) highlights emerging areas of opportunity in clinical populations, and 4) suggests strategies to close the knowledge gap and understanding the relevance of sex differences in performance fatigability. The limited understanding about sex differences in fatigability in healthy and clinical populations presents as a field ripe with opportunity for high-impact studies. Such studies will inform on the limitations of men and women during athletic endeavors, ergonomic tasks, and daily activities. Because fatigability is required for effective neuromuscular adaptation, sex differences in fatigability studies will also inform on optimal strategies for training and rehabilitation in both men and women.
Figures
Similar articles
-
Sex differences in fatigability of dynamic contractions.Exp Physiol. 2016 Feb;101(2):250-5. doi: 10.1113/EP085370. Epub 2015 Nov 17. Exp Physiol. 2016. PMID: 26440505 Free PMC article. Review.
-
Sex differences in human fatigability: mechanisms and insight to physiological responses.Acta Physiol (Oxf). 2014 Apr;210(4):768-89. doi: 10.1111/apha.12234. Epub 2014 Feb 25. Acta Physiol (Oxf). 2014. PMID: 24433272 Free PMC article.
-
Gender differences in skeletal muscle fatigability are related to contraction type and EMG spectral compression.J Appl Physiol (1985). 2003 Jun;94(6):2263-72. doi: 10.1152/japplphysiol.00926.2002. Epub 2003 Feb 7. J Appl Physiol (1985). 2003. PMID: 12576411
-
Sex differences with aging in the fatigability of dynamic contractions.Exp Gerontol. 2015 Oct;70:1-10. doi: 10.1016/j.exger.2015.07.001. Epub 2015 Jul 6. Exp Gerontol. 2015. PMID: 26159162 Free PMC article.
-
Performance Fatigability: Mechanisms and Task Specificity.Cold Spring Harb Perspect Med. 2018 Jul 2;8(7):a029728. doi: 10.1101/cshperspect.a029728. Cold Spring Harb Perspect Med. 2018. PMID: 28507192 Free PMC article. Review.
Cited by
-
Sportomics Analyses of the Exercise-Induced Impact on Amino Acid Metabolism and Acute-Phase Protein Kinetics in Female Olympic Athletes.Nutrients. 2024 Oct 18;16(20):3538. doi: 10.3390/nu16203538. Nutrients. 2024. PMID: 39458532 Free PMC article.
-
Influence of an Upper Limb Isometric Task in Perceived and Performance Fatigability of Elderly Subjects: A Quasi-Experimental Study.Biology (Basel). 2022 Aug 5;11(8):1175. doi: 10.3390/biology11081175. Biology (Basel). 2022. PMID: 36009802 Free PMC article.
-
Sex Differences in Mechanisms of Recovery after Isometric and Dynamic Fatiguing Tasks.Med Sci Sports Exerc. 2018 May;50(5):1070-1083. doi: 10.1249/MSS.0000000000001537. Med Sci Sports Exerc. 2018. PMID: 29298217 Free PMC article.
-
Fatigability of the knee extensor muscles during high-load fast and low-load slow resistance exercise in young and older adults.Exp Gerontol. 2021 Oct 15;154:111546. doi: 10.1016/j.exger.2021.111546. Epub 2021 Sep 5. Exp Gerontol. 2021. PMID: 34492255 Free PMC article.
-
Muscle function and fatigability of trunk flexors in males and females.Biol Sex Differ. 2017 Apr 17;8:12. doi: 10.1186/s13293-017-0133-y. eCollection 2017. Biol Sex Differ. 2017. PMID: 28428836 Free PMC article.
References
Publication types
MeSH terms
Grants and funding
LinkOut - more resources
Full Text Sources
Other Literature Sources
Medical
Miscellaneous
