. 2016 Mar 25;11(3):e0152440.
doi: 10.1371/journal.pone.0152440. eCollection 2016.

The Advantage of Playing Home in NBA: Microscopic, Team-Specific and Evolving Features

Affiliations

The Advantage of Playing Home in NBA: Microscopic, Team-Specific and Evolving Features

Haroldo V Ribeiro et al. PLoS One. .

Abstract

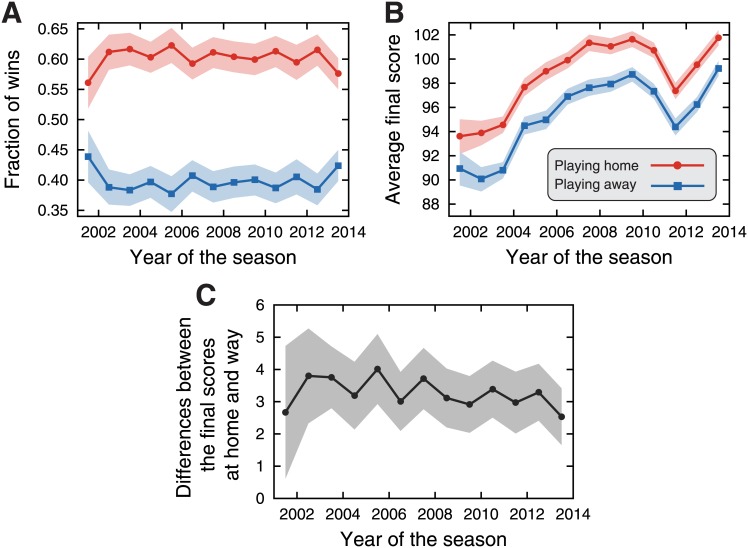
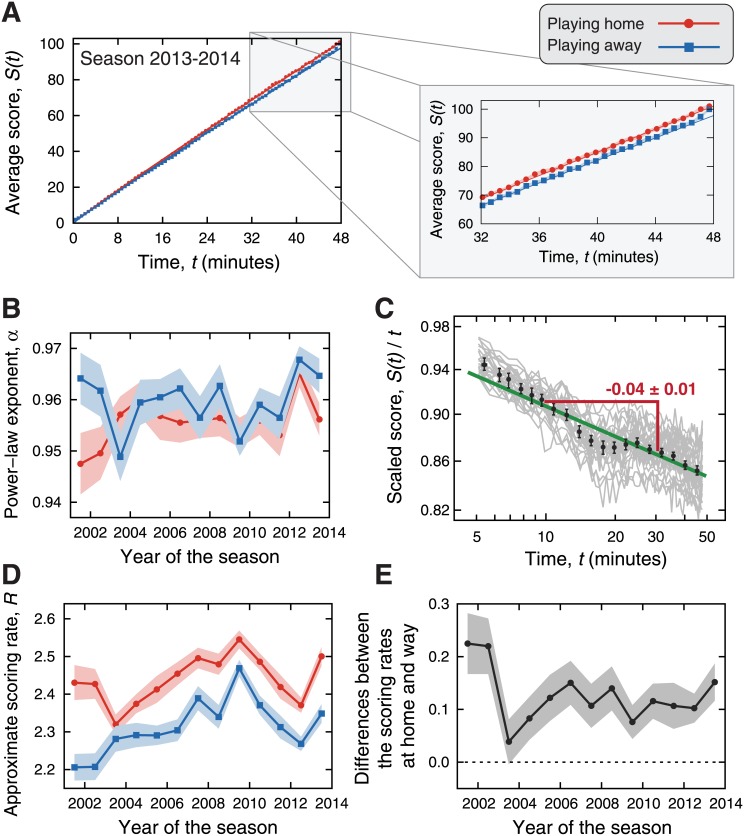
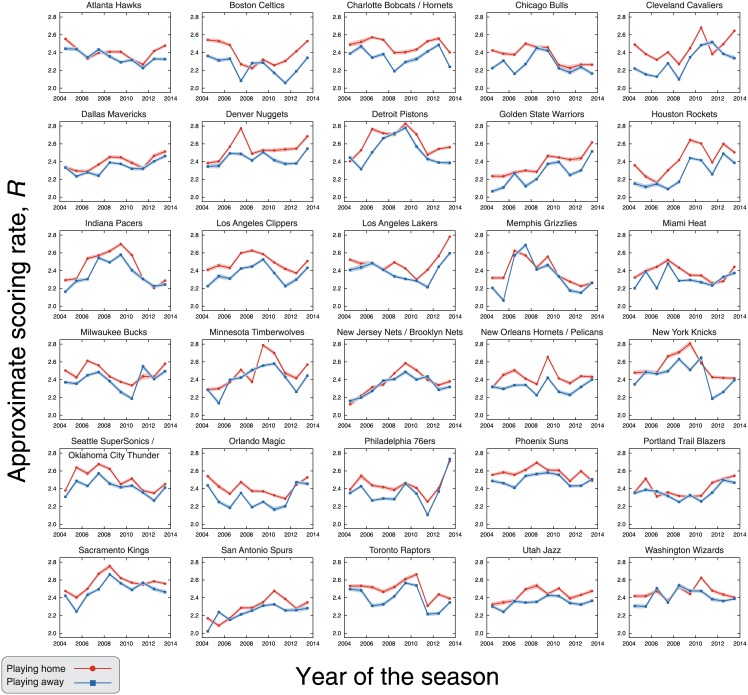
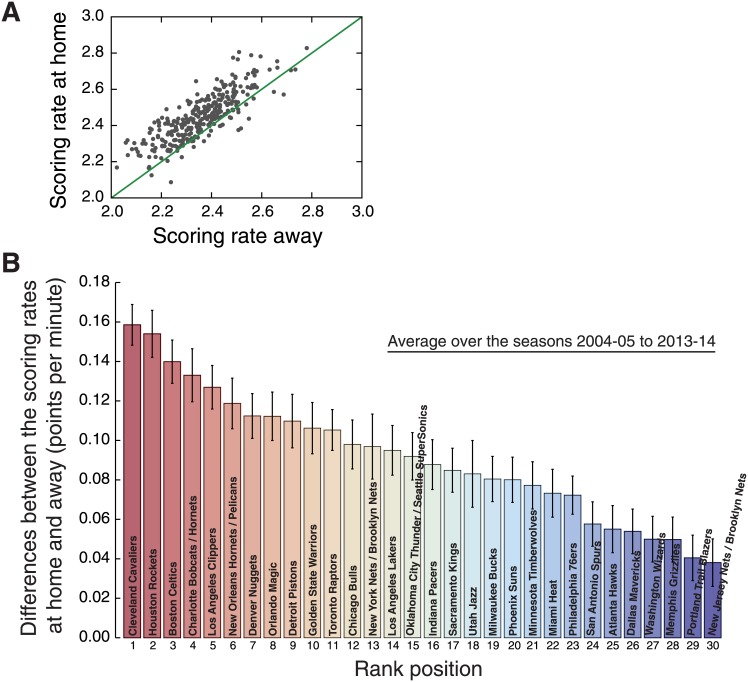
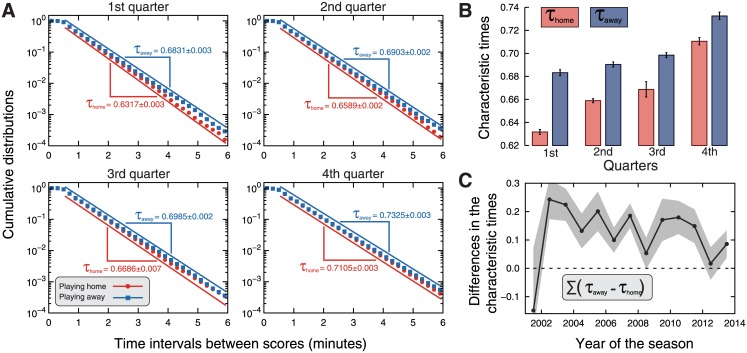
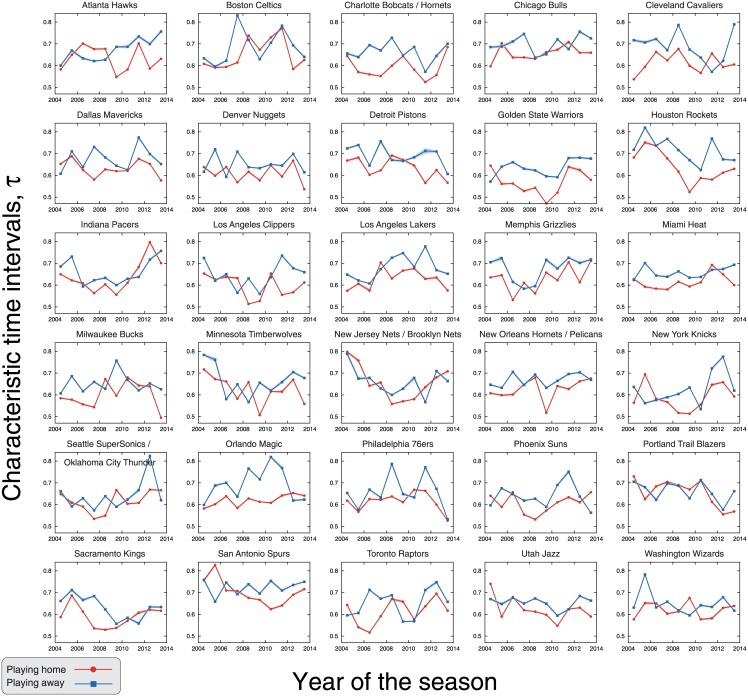
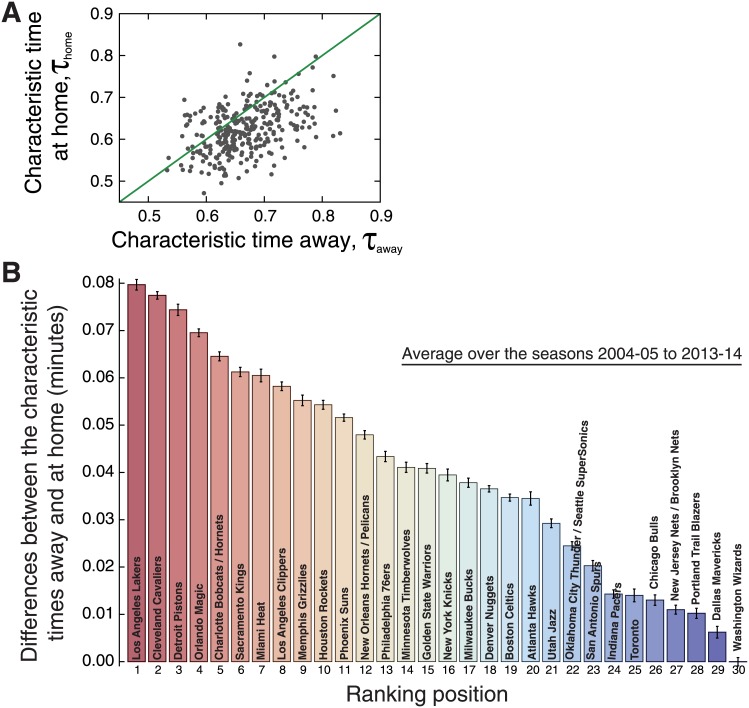
The idea that the success rate of a team increases when playing home is broadly accepted and documented for a wide variety of sports. Investigations on the so-called "home advantage phenomenon" date back to the 70's and ever since has attracted the attention of scholars and sport enthusiasts. These studies have been mainly focused on identifying the phenomenon and trying to correlate it with external factors such as crowd noise and referee bias. Much less is known about the effects of home advantage in the "microscopic" dynamics of the game (within the game) or possible team-specific and evolving features of this phenomenon. Here we present a detailed study of these previous features in the National Basketball Association (NBA). By analyzing play-by-play events of more than sixteen thousand games that span thirteen NBA seasons, we have found that home advantage affects the microscopic dynamics of the game by increasing the scoring rates and decreasing the time intervals between scores of teams playing home. We verified that these two features are different among the NBA teams, for instance, the scoring rate of the Cleveland Cavaliers team is increased ≈0.16 points per minute (on average the seasons 2004-05 to 2013-14) when playing home, whereas for the New Jersey Nets (now the Brooklyn Nets) this rate increases in only ≈0.04 points per minute. We further observed that these microscopic features have evolved over time in a non-trivial manner when analyzing the results team-by-team. However, after averaging over all teams some regularities emerge; in particular, we noticed that the average differences in the scoring rates and in the characteristic times (related to the time intervals between scores) have slightly decreased over time, suggesting a weakening of the phenomenon. This study thus adds evidence of the home advantage phenomenon and contributes to a deeper understanding of this effect over the course of games.


Conflict of interest statement

Competing Interests: The authors have the following interests: Xiao Han T. Zeng is employed by Groupon, Inc. Views discussed in the manuscript do not represent the views or positions of Groupon, Inc. There are no patents, products in development or marketed products to declare. This does not alter the authors’ adherence to all the PLOS ONE policies on sharing data and materials, as detailed online in the guide for authors.

Figures

Fig 1
Fig 1. Macroscopic manifestation of the home advantage in NBA.
(A) Average fraction of wins when playing home (red circles) and away (blue squares) along the thirteen NBA seasons studied here. (B) Average final score of the teams when playing home (red circles) and away (blue squares). (C) Evolution of the differences between the final scores and at home and away along the NBA seasons. In all plots, the shaded areas stand for 95% bootstrap confidence intervals.
Fig 2
Fig 2. Evidence for home advantage in the score evolution.
(A) Average score S(t) as a function of the game time t when playing home (red circles) and away (blue squares). These averages were calculated for the NBA season 2013–14 (see S1 Fig for all seasons). The last 16 minutes of the games are highlighted. The continuous lines (red for home and blue for away) represent the adjusted power-law models [S(t) = Rtα]. Notice that the difference between the average scores at home and away increases over time. (B) Evolution of the power-law exponent α over the NBA seasons. We observe practically no difference between playing home and away; however, the values of α are all smaller than one, indicating that the score evolution is slightly sub-linear. (C) The gray curves show the average score S(t) divided by t as a function of the game time t calculated for every NBA season and grouping the matches by field. The black dots are window average values over all curves and the error bars stand for 95% confidence intervals. The green line is a power-law fit to average tendency whose slope (power-law exponent) is 0.04±0.01. (D) Evolution of the approximate scoring rates R over the NBA seasons. The teams playing home display significantly larger rates (average over all seasons of 2.44±0.02 points per minute) than when playing away (2.31±0.02 points per minute). (E) Evolution of the differences between the scoring rates at home and away along the NBA seasons. Notice that these values display a decreasing tendency over the years. The shaded areas in the plots stand for 95% bootstrap confidence intervals.
Fig 3
Fig 3. Evolution of the scoring rate when playing home and away for each NBA team.
The panels show the approximate scoring rates R when playing home (red circles) and away (blue squares) for every team and season from 2004–05 to 2013–14, period in which the teams were the same. The shaded areas are 95% bootstrap confidence intervals. Notice that the scoring rates are systematically larger when the team plays home; however, we do observe some inversions and that values of R vary among teams and seasons.
Fig 4
Fig 4. Ranking NBA teams according to the difference between the scoring rate at home and away.
(A) Scoring rate at home versus scoring rate away (that is, the values of R). The dots represent the scoring rates (at home and away) for every team and NBA season, and the green line is a linear function (with a unitary linear coefficient and a zero intercept). Notice that there are only a few cases in which the scoring rate is larger when playing away than when playing home. (B) Average of the difference between the scoring rates at home and away for each NBA team (in descending order). These averages were calculated over the seasons 2004–05 to 2013–14 (during this period the teams were the same; see and S6 Fig for all scoring rates) and the error bars are 95% bootstrap confidence intervals.
Fig 5
Fig 5. Evidence for home advantage in the time intervals between scores.
(A) Cumulative distributions of the time intervals between stores when the teams play home (red dots) and away (blue squares). The panels show the distributions for the four quarters (period of 12 minutes in which the games are played). Here we have aggregated data from all seasons (see S3, S4, S5 and S6 Figs for individual results). All distributions are well approximated by exponential distributions, that is, Pt)∼e−Δt/τ, where τ = τhome is the characteristic time interval when playing home and τ = τaway is the analogous when playing away. Notice that the plots are in log-lin scale and thus the exponential decay is linearized. The values of τhome and τaway were estimated via maximum likelihood method and are shown in the plots. The straight lines are guides for the eyes indicating the adjusted behavior of Pt). We observe that these distributions decay faster for teams playing home than playing away. (B) Bar plots of the characteristic times τhome and τaway for each quarter. The error bars stand for 95% bootstrap confidence intervals. The characteristic times are systematically smaller when the teams play home than when playing way; we further observe that the difference τawayτhome decreases with the passing of the quarters. (C) Evolution of the sum of the differences between the characteristic times at home and away [∑(τawayτhome), over all quarters] along the NBA seasons. The shaded areas stand for 95% bootstrap confidence intervals.
Fig 6
Fig 6. Evolution of the characteristic time intervals when playing home and away for each NBA team.
The panels show the characteristic time intervals between scores when playing home (τhome, red circles) and away (τaway, blue squares) for every team and season from 2004–05 to 2013–14, period in which the teams were the same. Here we have aggregated data from all quarters and estimated the characteristic times via maximum likelihood method. The shaded areas are 95% bootstrap confidence intervals. Notice that the characteristic times are systematically larger when the team plays away; still, we note some inversions and that the values vary among teams and seasons.
Fig 7
Fig 7. Ranking NBA teams according to the difference between the characteristic time intervals at home and away.
(A) Characteristic time intervals between scores at home (τhome) versus away (τaway). The dots represent the values of the characteristic times (at home and away) for every team and season from 2004–05 to 2013–14 (during this period the teams were the same), and the green line is a linear function (τhome = τaway). Here we have aggregated data from all quarters and estimated the characteristic times via maximum likelihood method. Notice that there are only a few cases in which the characteristic time is larger when playing home than when playing away. (B) Average of the difference between τaway and τhome for each NBA team (in descending order). These averages were calculated over the seasons 2004–05 to 2013–14 (see S7 Fig for the cumulative distributions) and the error bars are 95% bootstrap confidence intervals.

References

    1. Kahn L (2000) The sports business as a labor market laboratory. Journal of Economic Perspectives 14: 75–94. 10.1257/jep.14.3.75 - DOI
    1. Ben-Naim E, Hengartner NW, Redner S, Vazquez F (2013) Randomness in Competitions. Journal of Statistical Physics 151: 458–474. 10.1007/s10955-012-0648-x - DOI
    1. Ben-Naim E, Redner S, Vazquez F (2007) Scaling in tournaments. Europhysics Letters 77: 30005 10.1209/0295-5075/77/30005 - DOI
    1. Ben-Naim E, Hengartner NW (2007) Efficiency of competitions. Physical Review E 76: 026106 10.1103/PhysRevE.76.026106 - DOI - PubMed
    1. Sire C (2007) Universal statistical properties of poker tournaments. Journal of Statistical Mechanics: Theory and Experiment 2007: P08013.

Publication types

LinkOut - more resources