. 2016 Jul;37(7):2587-601.
doi: 10.1002/hbm.23198. Epub 2016 Mar 26.

Structural connectome disruption at baseline predicts 6-months post-stroke outcome

Affiliations

Structural connectome disruption at baseline predicts 6-months post-stroke outcome

Amy Kuceyeski et al. Hum Brain Mapp. 2016 Jul.

Abstract

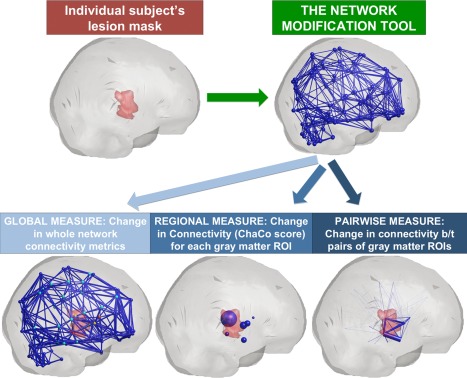
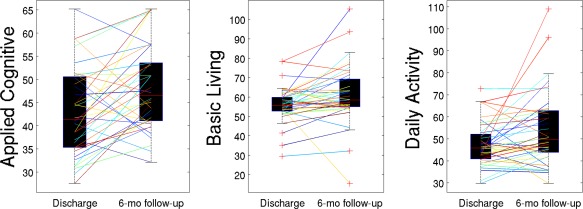
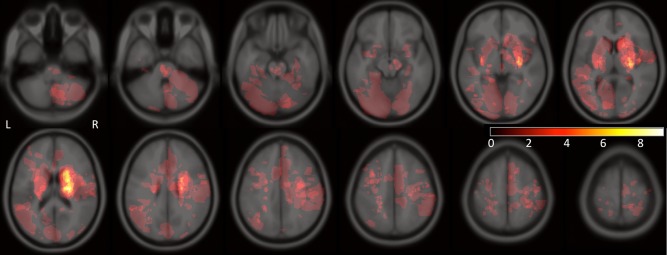
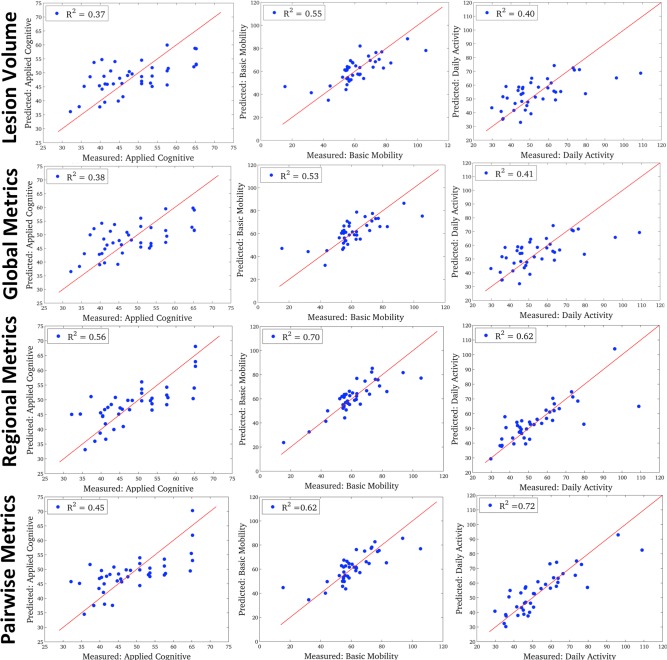
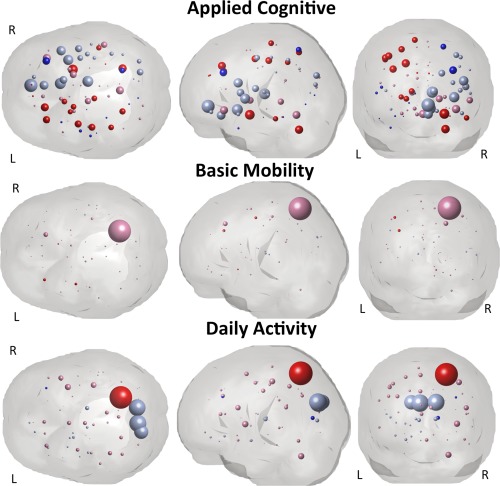
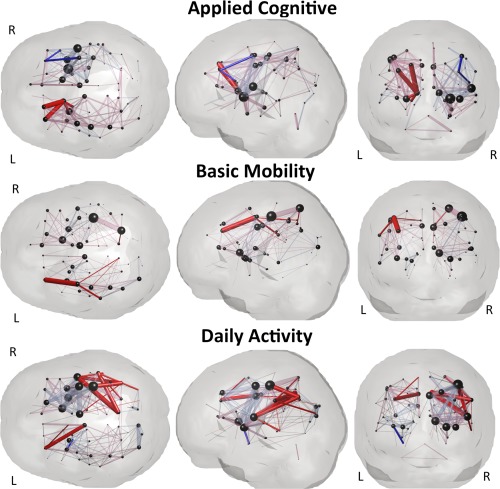
In this study, models based on quantitative imaging biomarkers of post-stroke structural connectome disruption were used to predict six-month outcomes in various domains. Demographic information and clinical MRIs were collected from 40 ischemic stroke subjects (age: 68.1 ± 13.2 years, 17 female, NIHSS: 6.8 ± 5.6). Diffusion-weighted images were used to create lesion masks, which were uploaded to the Network Modification (NeMo) Tool. The NeMo Tool, using only clinical MRIs, allows estimation of connectome disruption at three levels: whole brain, individual gray matter regions and between pairs of gray matter regions. Partial Least Squares Regression models were constructed for each level of connectome disruption and for each of the three six-month outcomes: applied cognitive, basic mobility and daily activity. Models based on lesion volume were created for comparison. Cross-validation, bootstrapping and multiple comparisons corrections were implemented to minimize over-fitting and Type I errors. The regional disconnection model best predicted applied cognitive (R(2) = 0.56) and basic mobility outcomes (R(2) = 0.70), while the pairwise disconnection model best predicted the daily activity measure (R(2) = 0.72). These results demonstrate that models based on connectome disruption metrics were more accurate than ones based on lesion volume and that increasing anatomical specificity of disconnection metrics does not always increase model accuracy, likely due to statistical adjustments for concomitant increases in data dimensionality. This work establishes that the NeMo Tool's measures of baseline connectome disruption, acquired using only routinely collected MRI scans, can predict 6-month post-stroke outcomes in various functional domains including cognition, motor function and daily activities. Hum Brain Mapp, 2016. © 2016 Wiley Periodicals, Inc.

Keywords: connectome; imaging biomarkers; magnetic resonance imaging; outcome assessment; statistical modeling; stroke.


Figures

Figure 1
Figure 1
A schematic of the Network Modification Tool and how it is used to estimate the three levels of structural connectome disruption (global, regional and pairwise) due to a given individual's stroke lesion. [Color figure can be viewed in the online issue, which is available at http://wileyonlinelibrary.com.]
Figure 2
Figure 2
Change in each of the AMPAC scores from discharge to 6‐months follow‐up: boxplots represent the distributions over all subjects while lines represent each individual. [Color figure can be viewed in the online issue, which is available at http://wileyonlinelibrary.com.]
Figure 3
Figure 3
A heat map of the lesion areas for all 40 subjects included in the study. Color indicates the number of subjects that have the particular voxel included in their lesion masks (colorbar: no color = 0, white = 9).
Figure 4
Figure 4
The predicted versus true AMPAC scores for the four levels of fixed‐effects PLSR models: lesion volume model (top row), global model (second row), regional level (third row) and pairwise level (bottom row). The three AMPAC subscores are arranged in columns: applied cognitive (left column), basic mobility (middle column) and daily activity (right column). [Color figure can be viewed in the online issue, which is available at http://wileyonlinelibrary.com.]
Figure 5
Figure 5
Visualization of the PLSR regression coefficients for the regional model that had disconnection measures for each gray matter region (ChaCo scores) as input variables. Spheres represent each of the 93 gray matter atlas regions. The radius of the sphere is proportional to the size of the median of the PLSR coefficient (over the bootstrapped samples) while color denotes significance and directionality: bright red and pale red indicate negative coefficients (more disconnection = worse f/u) and bright blue and pale blue indicate positive coefficients (more disconnection = better f/u). Bright colors denote significant coefficients while the pale colors denote non‐significant coefficients. The three AMPAC subscores are arranged in rows: applied cognitive (top row), basic mobility (middle row) and daily activity (bottom row). Note: The scale of the spheres is identical for the basic mobility and daily activity while the applied cognitive is twice the scale of the others (for visualization purposes).
Figure 6
Figure 6
Visualization of the PLSR regression coefficients for the pairwise model that had disruptions of white matter connections between pairs of gray matter regions as input variables. Spheres represent the 93 gray matter regions while pipes between them represent the regression coefficients for the pairwise disconnection between the two gray matter regions. Pipe size is proportional to the value of the median of the PLSR coefficient (over the bootstrapped samples), while color denotes significance and directionality: bright red and pale red indicate negative coefficients (more disconnection = worse f/u) and bright blue and pale blue indicate positive coefficients (more disconnection = better f/u). Bright colors denote significant coefficients while the pale colors denote non‐significant coefficients. The size of the spheres is proportional to the outgoing degree in the coefficient network—the larger the sphere the larger the sum of the magnitude of the pairwise coefficients involving that gray matter region. Note: the pipes do NOT represent the spatial location or geometry of the white matter fibers connecting the two gray matter regions, they are drawn as straight lines between the spheres.

References

    1. Andres PL, Black‐Schaffer RM, Ni P, Haley SM (2004): Computer adaptive testing: A strategy for monitoring stroke rehabilitation across settings. Top Stroke Rehabil 11:33–39. - PubMed
    1. Auriat AM, Borich MR, Snow NJ, Wadden KP, Boyd LA (2015): Comparing a diffusion tensor and non‐tensor approach to white matter fiber tractography in chronic stroke. NeuroImage Clin 7:771–781. - PMC - PubMed
    1. Balleine BW, Delgado MR, Hikosaka O (2007): The role of the dorsal striatum in reward and decision‐making. J Neurosci 27:8161–8165. - PMC - PubMed
    1. Belmonte MK, Allen G, Beckel‐Mitchener A, Boulanger LM, Carper RA, Webb SJ (2004): Autism and abnormal development of brain connectivity. J Neurosci 24:9228–9231. - PMC - PubMed
    1. Berryhill ME, Olson IR (2008): The right parietal lobe is critical for visual working memory. Neuropsychologia 46:1767–1774. - PMC - PubMed