

How to Diagnose Solutions to a Quality of Care Problem
- PMID: 27016495
- PMCID: PMC4858489
- DOI: 10.2215/CJN.11481015
How to Diagnose Solutions to a Quality of Care Problem
Abstract
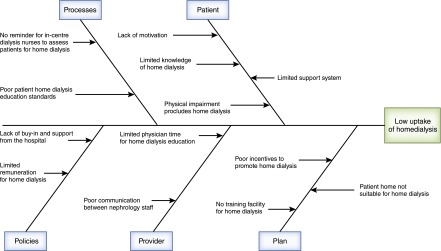
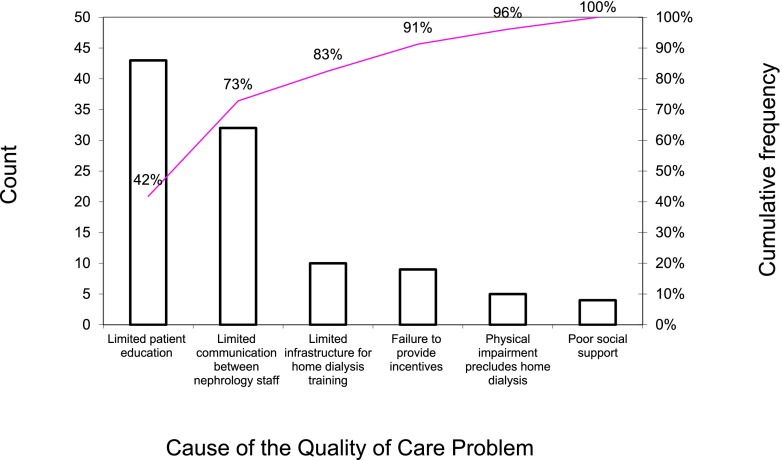
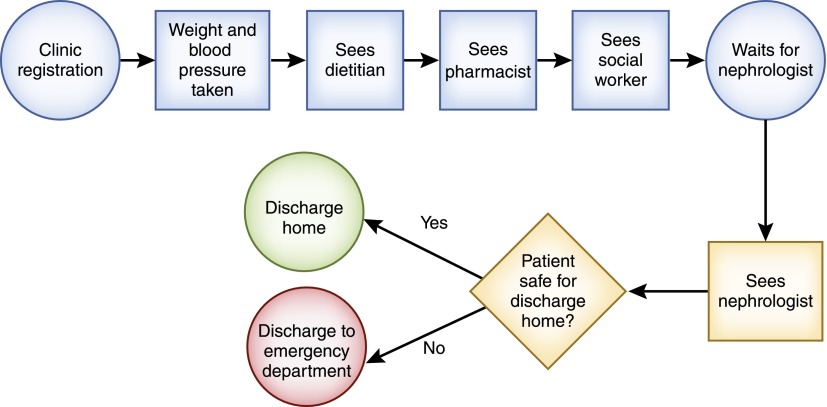
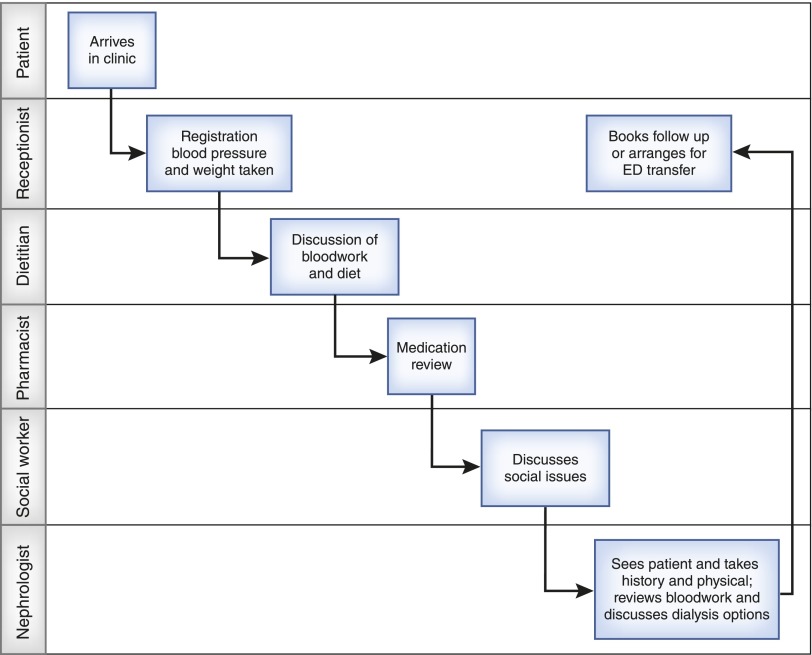
To change a particular quality of care outcome within a system, quality improvement initiatives must first understand the causes contributing to the outcome. After the causes of a particular outcome are known, changes can be made to address these causes and change the outcome. Using the example of home dialysis (home hemodialysis and peritoneal dialysis), this article within this Moving Points feature on quality improvement will provide health care professionals with the tools necessary to analyze the steps contributing to certain outcomes in health care quality and develop ideas that will ultimately lead to their resolution. The tools used to identify the main contributors to a quality of care outcome will be described, including cause and effect diagrams, Pareto analysis, and process mapping. We will also review common change concepts and brainstorming activities to identify effective change ideas. These methods will be applied to our home dialysis quality improvement project, providing a practical example that other kidney health care professionals can replicate at their local centers.
Keywords: Change ideas; Health Personnel; Home dialysis; Humans; Quality improvement; Quality of Health Care; Root cause analysis; kidney; peritoneal dialysis; renal dialysis.
Copyright © 2016 by the American Society of Nephrology.
Figures
References
-
- Langley GL, Moen RD, Nolan KM, Nolan TW, Norman CL, Provost LP: The Improvement Guide: A Practical Approach to Enhancing Organizational Performance, 2nd Ed., San Francisco, CA, Jossey Bass, 2009
-
- Wu AW, Lipshutz AK, Pronovost PJ: Effectiveness and efficiency of root cause analysis in medicine. JAMA 299: 685–687, 2008 - PubMed
-
- Ziegenfuss JT Jr., McKenna CK: Ten tools of continuous quality improvement: A review and case example of hospital discharge. Am J Med Qual 10: 213–220, 1995 - PubMed
-
- Ogrinc GS, Headrick LA, Moore SM, Barton AJ, Dolansky MA, Madigosky WS: Fundamentals of Health Care Improvement: A Guide to Improving Your Patient's Care, 2nd Ed., Oakbrook Terrace, IL, Joint Commission Resources, 2012
Publication types
MeSH terms
LinkOut - more resources
Full Text Sources
Other Literature Sources
