

Deep brain stimulation modulates synchrony within spatially and spectrally distinct resting state networks in Parkinson's disease
- PMID: 27017189
- PMCID: PMC4845255
- DOI: 10.1093/brain/aww048
Deep brain stimulation modulates synchrony within spatially and spectrally distinct resting state networks in Parkinson's disease
Abstract
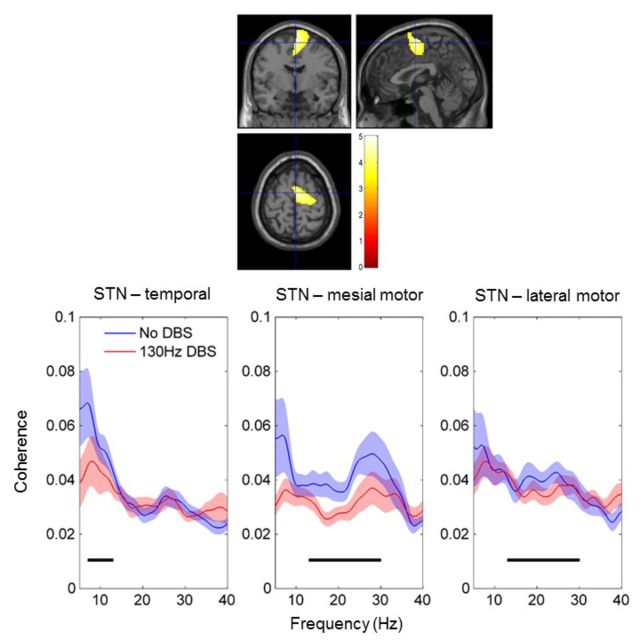
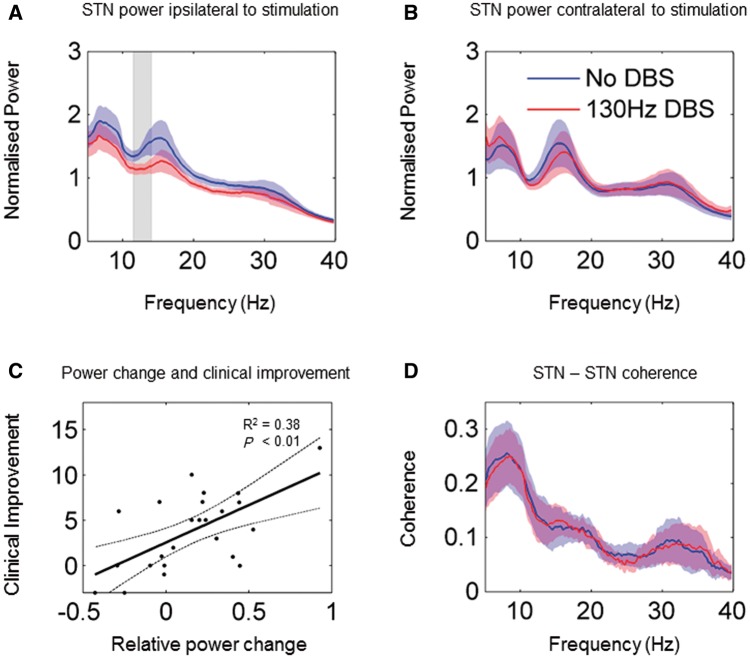
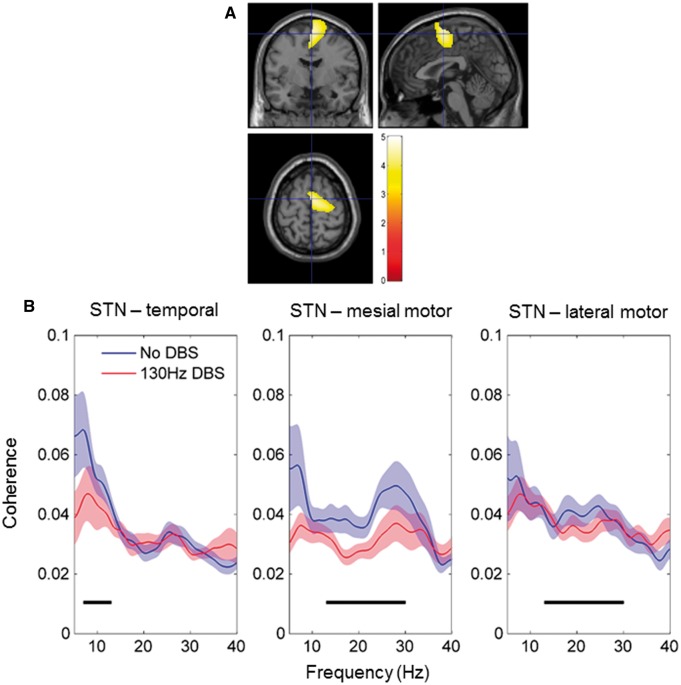
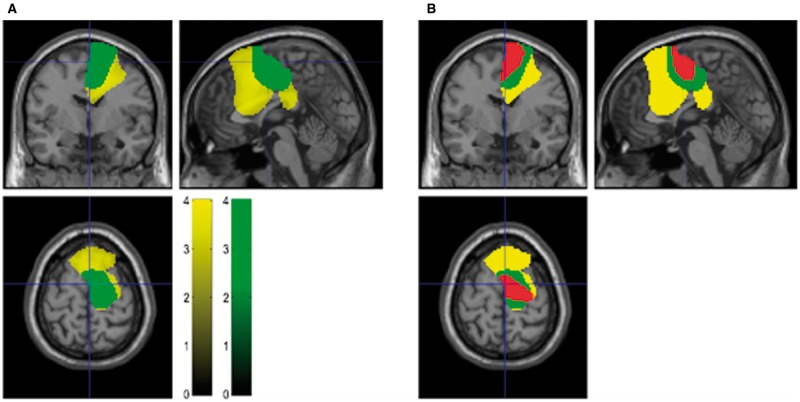
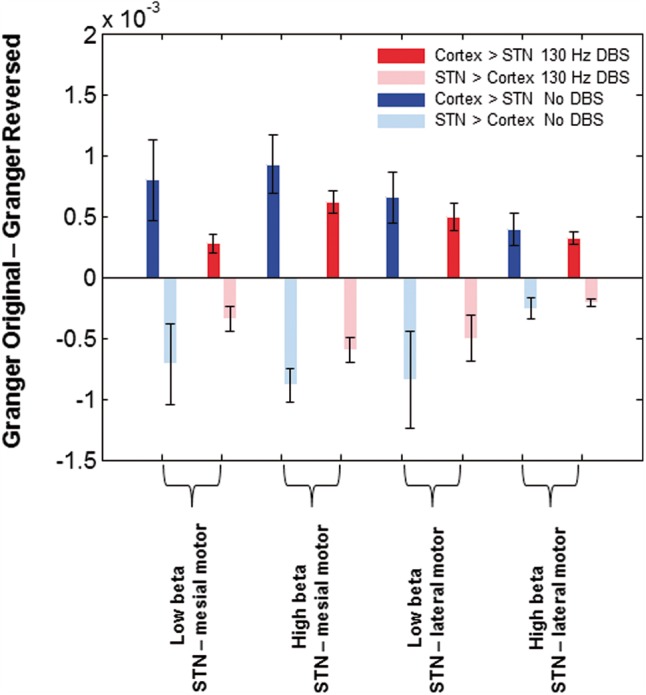
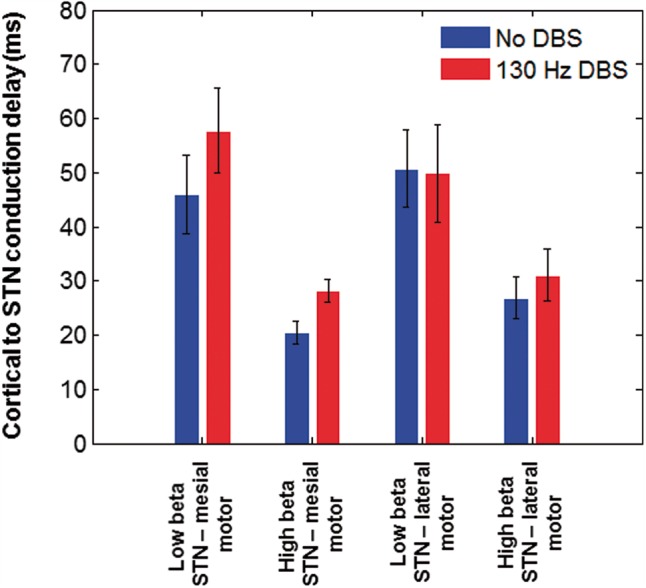
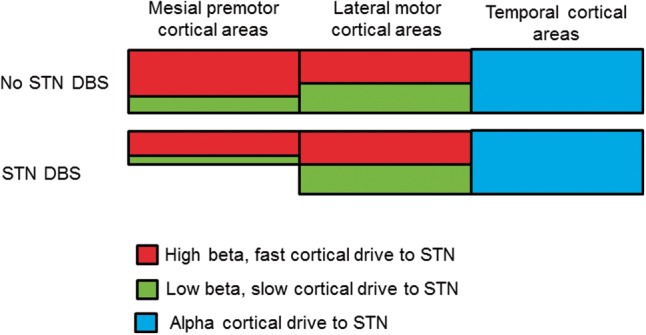
Chronic dopamine depletion in Parkinson's disease leads to progressive motor and cognitive impairment, which is associated with the emergence of characteristic patterns of synchronous oscillatory activity within cortico-basal-ganglia circuits. Deep brain stimulation of the subthalamic nucleus is an effective treatment for Parkinson's disease, but its influence on synchronous activity in cortico-basal-ganglia loops remains to be fully characterized. Here, we demonstrate that deep brain stimulation selectively suppresses certain spatially and spectrally segregated resting state subthalamic nucleus-cortical networks. To this end we used a validated and novel approach for performing simultaneous recordings of the subthalamic nucleus and cortex using magnetoencephalography (during concurrent subthalamic nucleus deep brain stimulation). Our results highlight that clinically effective subthalamic nucleus deep brain stimulation suppresses synchrony locally within the subthalamic nucleus in the low beta oscillatory range and furthermore that the degree of this suppression correlates with clinical motor improvement. Moreover, deep brain stimulation relatively selectively suppressed synchronization of activity between the subthalamic nucleus and mesial premotor regions, including the supplementary motor areas. These mesial premotor regions were predominantly coupled to the subthalamic nucleus in the high beta frequency range, but the degree of deep brain stimulation-associated suppression in their coupling to the subthalamic nucleus was not found to correlate with motor improvement. Beta band coupling between the subthalamic nucleus and lateral motor areas was not influenced by deep brain stimulation. Motor cortical coupling with subthalamic nucleus predominantly involved driving of the subthalamic nucleus, with those drives in the higher beta frequency band having much shorter net delays to subthalamic nucleus than those in the lower beta band. These observations raise the possibility that cortical connectivity with the subthalamic nucleus in the high and low beta bands may reflect coupling mediated predominantly by the hyperdirect and indirect pathways to subthalamic nucleus, respectively, and that subthalamic nucleus deep brain stimulation predominantly suppresses the former. Yet only the change in strength of local subthalamic nucleus oscillations correlates with the degree of improvement during deep brain stimulation, compatible with the current view that a strengthened hyperdirect pathway is a prerequisite for locally generated beta activity but that it is the severity of the latter that may determine or index motor impairment.
Keywords: Parkinson’s disease; deep brain stimulation; local field potential; magnetoencephalography; resting state networks.
© The Author (2016). Published by Oxford University Press on behalf of the Guarantors of Brain.
Figures
Similar articles
-
Subthalamic stimulation modulates cortical motor network activity and synchronization in Parkinson's disease.Brain. 2015 Mar;138(Pt 3):679-93. doi: 10.1093/brain/awu380. Epub 2015 Jan 2. Brain. 2015. PMID: 25558877 Free PMC article.
-
Suppression of beta oscillations in the subthalamic nucleus following cortical stimulation in humans.Eur J Neurosci. 2008 Oct;28(8):1686-95. doi: 10.1111/j.1460-9568.2008.06363.x. Epub 2008 Jul 24. Eur J Neurosci. 2008. PMID: 18657185 Free PMC article.
-
Subthalamic nucleus phase-amplitude coupling correlates with motor impairment in Parkinson's disease.Clin Neurophysiol. 2016 Apr;127(4):2010-9. doi: 10.1016/j.clinph.2016.01.015. Epub 2016 Feb 1. Clin Neurophysiol. 2016. PMID: 26971483 Free PMC article.
-
[Emotion and basal ganglia (II): what can we learn from subthalamic nucleus deep brain stimulation in Parkinson's disease?].Rev Neurol (Paris). 2012 Aug-Sep;168(8-9):642-8. doi: 10.1016/j.neurol.2012.06.012. Epub 2012 Aug 17. Rev Neurol (Paris). 2012. PMID: 22901366 Review. French.
-
Subthalamic control of impulsive actions: insights from deep brain stimulation in Parkinson's disease.Brain. 2024 Nov 4;147(11):3651-3664. doi: 10.1093/brain/awae184. Brain. 2024. PMID: 38869168 Free PMC article. Review.
Cited by
-
Multistage classification identifies altered cortical phase- and amplitude-coupling in Multiple Sclerosis.Neuroimage. 2022 Dec 1;264:119752. doi: 10.1016/j.neuroimage.2022.119752. Epub 2022 Nov 15. Neuroimage. 2022. PMID: 36400377 Free PMC article.
-
Reduced subthalamic and subthalamic-cortical coherences associated with the therapeutic carryover effect of coordinated reset deep brain stimulation.NPJ Parkinsons Dis. 2024 Sep 28;10(1):180. doi: 10.1038/s41531-024-00797-w. NPJ Parkinsons Dis. 2024. PMID: 39341818 Free PMC article.
-
A biophysical model of striatal microcircuits suggests gamma and beta oscillations interleaved at delta/theta frequencies mediate periodicity in motor control.PLoS Comput Biol. 2020 Feb 25;16(2):e1007300. doi: 10.1371/journal.pcbi.1007300. eCollection 2020 Feb. PLoS Comput Biol. 2020. PMID: 32097404 Free PMC article.
-
Movement-related beta oscillations show high intra-individual reliability.Neuroimage. 2017 Feb 15;147:175-185. doi: 10.1016/j.neuroimage.2016.12.025. Epub 2016 Dec 10. Neuroimage. 2017. PMID: 27965146 Free PMC article.
-
Beta bursts during continuous movements accompany the velocity decrement in Parkinson's disease patients.Neurobiol Dis. 2019 Jul;127:462-471. doi: 10.1016/j.nbd.2019.03.013. Epub 2019 Mar 18. Neurobiol Dis. 2019. PMID: 30898668 Free PMC article.
References
-
- Alexander GE Crutcher MD . . Functional architecture of basal ganglia circuits: neural substrates of parallel processing . Trends Neurosci 1990. ; 13 : 266 – 71 . - PubMed
-
- Ashby P, Paradiso G, Saint-Cyr JA, Chen R, Lang AE, Lozano AM . Potentials recorded at the scalp by stimulation near the human subthalamic nucleus . Clin Neurophysiol 2001. ; 112 : 431 – 7 . - PubMed
-
- Baudrexel S, Witte T, Seifried C, von Wegner F, Beissner F, Klein JC , et al. . Resting state fMRI reveals increased subthalamic nucleus-motor cortex connectivity in Parkinson’s disease . Neuroimage 2011. ; 55 : 1728 – 38 . - PubMed
-
- Benabid AL, Chabardes S, Mitrofanis J, Pollak P . Deep brain stimulation of the subthalamic nucleus for the treatment of Parkinson’s disease . Lancet Neurol 2009. ; 8 : 67 – 81 . - PubMed
Publication types
MeSH terms
Grants and funding
LinkOut - more resources
Full Text Sources
Other Literature Sources
Medical
