. 2016 Jun;64(6):1034-49.
doi: 10.1002/glia.22981. Epub 2016 Mar 28.

Adrenergic activation attenuates astrocyte swelling induced by hypotonicity and neurotrauma

Affiliations

Adrenergic activation attenuates astrocyte swelling induced by hypotonicity and neurotrauma

Nina Vardjan et al. Glia. 2016 Jun.

Abstract

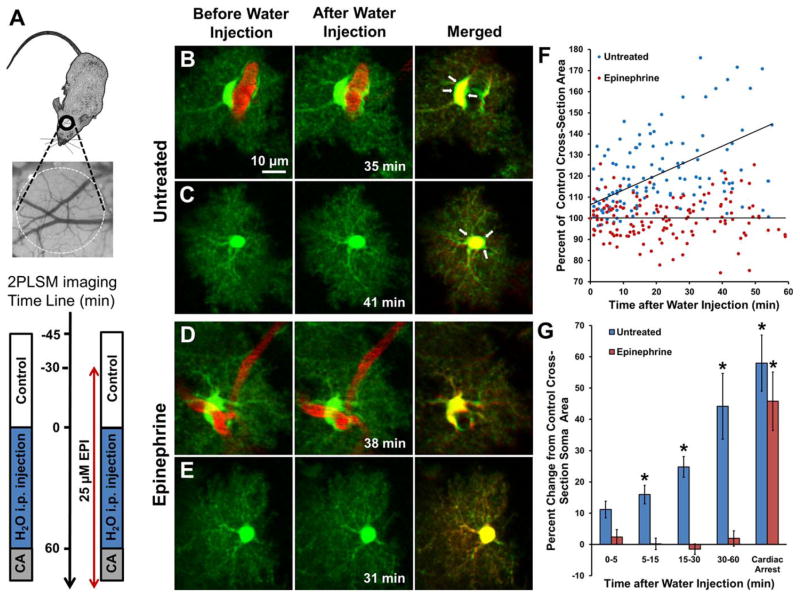
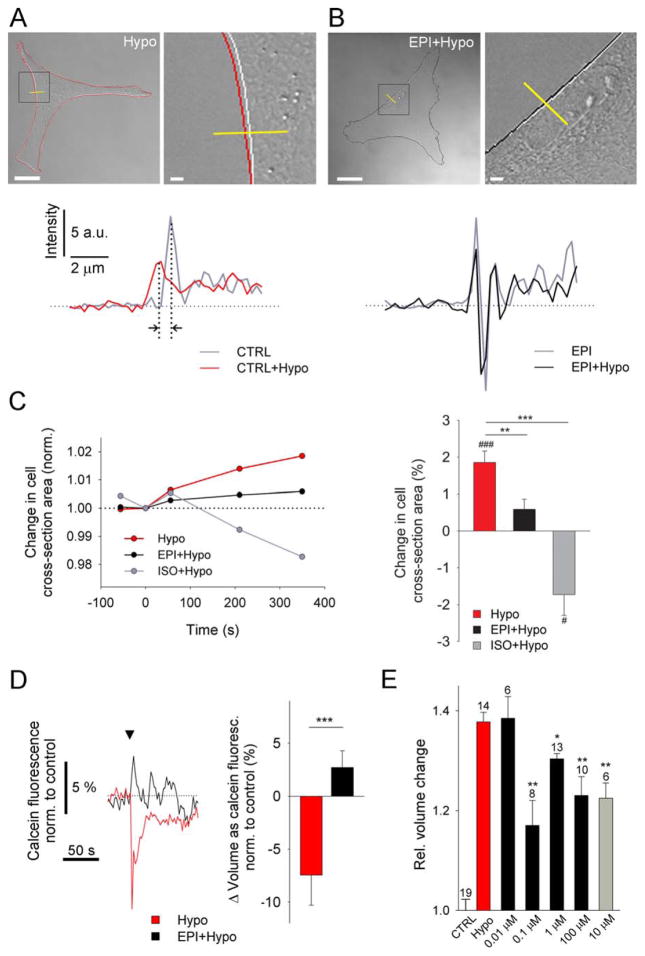
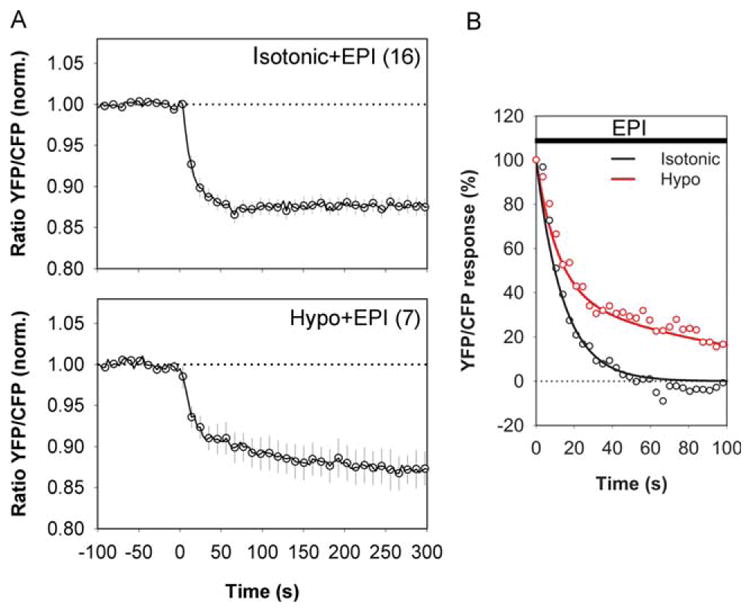
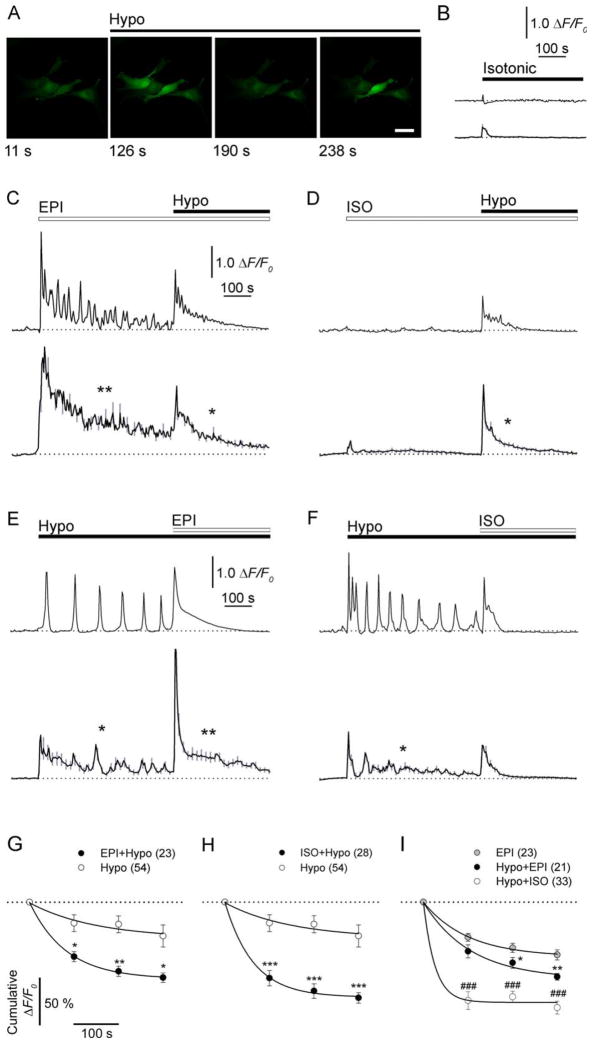
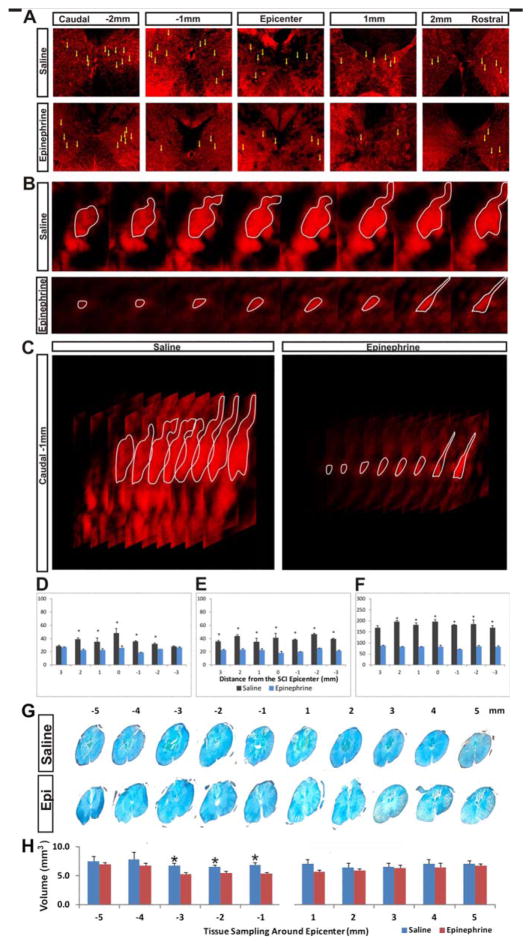
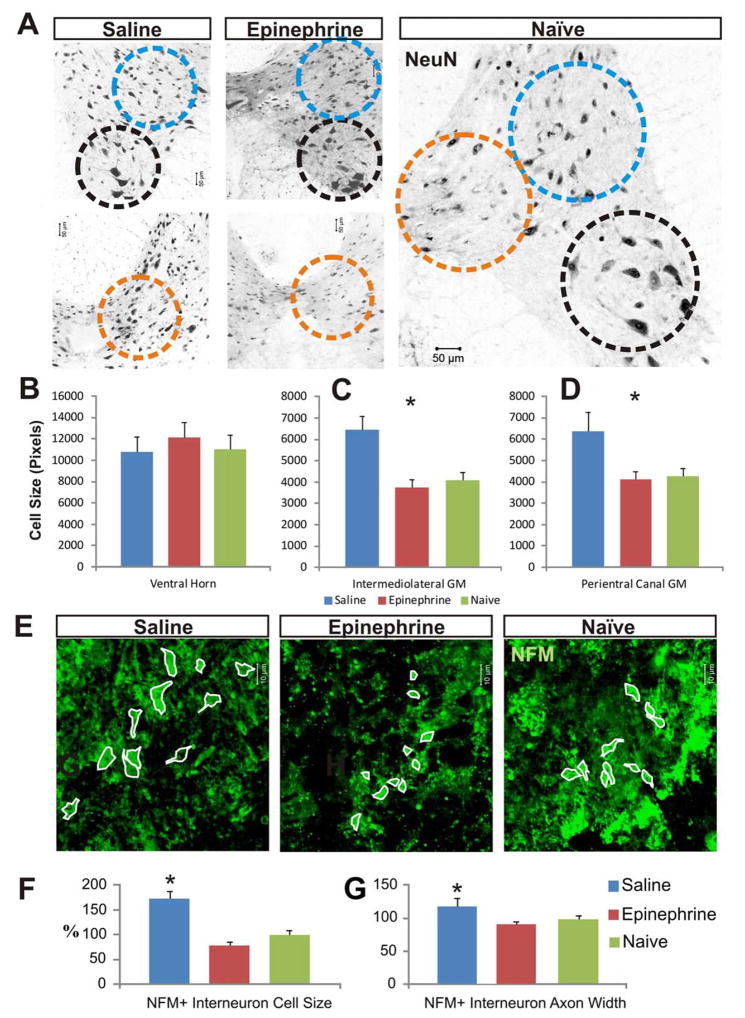
Edema in the central nervous system can rapidly result in life-threatening complications. Vasogenic edema is clinically manageable, but there is no established medical treatment for cytotoxic edema, which affects astrocytes and is a primary trigger of acute post-traumatic neuronal death. To test the hypothesis that adrenergic receptor agonists, including the stress stimulus epinephrine protects neural parenchyma from damage, we characterized its effects on hypotonicity-induced cellular edema in cortical astrocytes by in vivo and in vitro imaging. After epinephrine administration, hypotonicity-induced swelling of astrocytes was markedly reduced and cytosolic 3'-5'-cyclic adenosine monophosphate (cAMP) was increased, as shown by a fluorescence resonance energy transfer nanosensor. Although, the kinetics of epinephrine-induced cAMP signaling was slowed in primary cortical astrocytes exposed to hypotonicity, the swelling reduction by epinephrine was associated with an attenuated hypotonicity-induced cytosolic Ca(2+) excitability, which may be the key to prevent astrocyte swelling. Furthermore, in a rat model of spinal cord injury, epinephrine applied locally markedly reduced neural edema around the contusion epicenter. These findings reveal new targets for the treatment of cellular edema in the central nervous system.

Keywords: astrocytes; cerebral cortex; contusion trauma; cytotoxic edema; epinephrine; spinal cord.


Conflict of interest statement

Disclosure

The authors declare no competing financial interests.

Figures

FIGURE 1
FIGURE 1
EPI treatment attenuates swelling of cortical astrocytes in vivo after intraperitoneal injection of water. (A) General experimental schematics and time line. CCD camera image reveals cortical vasculature directly below craniotomy over mouse somatosensory cortex where 2PLSM imaging of astrocytes was performed according to the experimental time line. In mice untreated with EPI (left time line) 2PLSM images were acquired before and during 1 h after i.p. distilled water injection (150mL/kg) and then during cardiac arrest (CA). EPI (25 μM) was directly applied for 30 min to the open craniotomy and then replaced with agarose containing EPI for the duration of the experiment (right time line). 2PLSM imaging was performed before, during i.p. water injection, and after CA. (B) Paired maximal intensity projection two-photon laser scanning microscopy images showing an astrocyte (green) with the soma in contact with a blood vessel (red) before (left) and 35 min after (center) injection of water. (right) Merged images; arrows point to green areas illustrating swelling. (C) An astrocyte whose soma is not directly in contact with a blood vessel is swollen 41 min after i.p. injection of water, as revealed by the overlay image. (D,E) Similar images of astrocytes after local application of EPI to the open craniotomy (25 μM preincubation for 30 min and then 25 μM in agarose). A perivascular astrocyte with soma surrounding a blood vessel (D) and an astrocyte whose soma is distant from the blood vessel (E) do not appear swollen at 38 min and 31 min after i.p. injection of water, respectively. (F) Data from 15 astrocytes from 6 control mice (blue dots) showing continuous increase in soma size after i.p. injection of water. Values are percentages of cross-sectional soma area of each astrocyte before the injection. Regression line of the control data is in the form: y [%]=(106.53±2.46)+(0.693±0.101) × x [min] (n=144; r=0.5, P < 0.001). Data from 20 astrocytes from 6 EPI-treated mice (red dots) showing no significant relationship (r=0.0015, P=0.98) between soma size and time after i.p. injection of water. Regression line is in the form: y [%]=(100.23±1.10) − (0.001±0.042) × x [min] (n=162). The slopes of the regression lines differ significantly (P< 0.001, one-way analysis of covariance for two independent samples). (G) Same data as in (F) presented as a bar graph showing a long-lasting swelling of astrocytes in control mice after injection of water (*P< 0.5 vs. before injection of water) and a lack of astroglial swelling in the EPI-treated mice. All astrocytes in the EPI-treated mice swelled after global ischemia induced by cardiac arrest (*P < 0.002 relative to 30–60 min).
FIGURE 2
FIGURE 2
AR activation reduces hypotonicity-induced swelling of cultured cortical astrocytes. (A, B) Representative transmitted light images of control (A; Hypo) and EPI-pretreated astrocytes (B; EPI+Hypo) after addition of hypo-osmotic medium 350 s after hypotonic stimulation. Black boxes (left) denote the positions of the enlarged images (right). White lines outline the cell perimeter before stimulation (−50 s). Red (Hypo) and black (EPI+hypo) lines outline the cell perimeter after hypotonic stimulation (350 s). Intensity profiles of transmitted light images (yellow lines) for nontreated (CTRL) and EPI-pretreated cells before and after hypotonic stimulation are shown below the images. a.u., arbitrary units. Vertical dotted lines (a) show a shift in intensity profile lines induced by hypotonic stimulation (black arrows), indicating swelling. Scale bars: 20 μm, 2 μm (enlarged images). (C) (left) Time course of changes in cell cross-sectional area induced by hypotonic medium in control cells (Hypo, n = 13 from six experimental replicates) and cells pretreated with EPI (EPI− + Hypo; n = 8 from four experimental replicates) and ISO (ISO+Hypo; n = 5 from three experimental replicates). n, total number of independent experiments. (right) Bar chart shows average hypotonicity-induced changes in cell cross-sectional area 350 s after stimulation in control cells and pretreated cells. Hypotonic stimulation increased cell cross-sectional area, suggesting cell swelling, which was reduced in EPI- and ISO-pretreated cells. (D) (left) Time course of calcein fluorescence intensity changes (normalized to controls), reporting changes in cell volume, upon hypotonic medium stimulation in controls (Hypo, n = 15 from three experimental replicates) and in cells pretreated with EPI (EPI+Hypo; n = 11 from two experimental replicates). Arrowhead indicates stimulus onset. (right) Bar chart shows the percentage of cell volume change, expressed as the average hypotonicity-induced changes in calcein fluorescence intensity within the first 10 s after stimulation in control cells and EPI-pretreated cells. Hypotonic stimulation decreased the calcein fluorescence intensity, suggesting cell swelling, which was reduced in EPI-pretreated cells. Values in bar charts are mean±SEM (***P < 0.001, **P < 0.01; ###P < 0.001, #P < 0.05; paired t test). (E) EPI- and ISO-mediated attenuation of hypotonicity-induced astrocyte swelling at different doses, determined by the Coulter principle (Scepter cell counter). Bar chart shows average changes in cell volume (Rel. Volume change) normalized to the controls (isotonic stimulation, CTRL). Average control cell volume was 1.75±0.04 pL (n=19 runs; a run represents a cell suspension (50 μL) used in the measurements, containing 80,000 to 150,000 cells/mL). Bar chart colours indicate the same stimuli as in (C). We used six different cell preparations from three different animals. Hypo (n=14; red bar), cells pretreated with different concentrations of EPI [black bars; EPI (0.01 μM)+Hypo, n=6; EPI (0.1 μM)+Hypo, n=8; EPI (1 μM)+Hypo, n=13; EPI (100 μM)+Hypo, n=10] and simultaneous stimulation with ISO [gray bar; ISO (10 μM)+Hypo (simult.), n=6]. n, total number of independent experiments—runs. Values in bar chart are means±SEM. *P ≤ 0.05, **P ≤ 0.001 one-way ANOVA (Holm–Sidak method) vs. Hypo.
FIGURE 3
FIGURE 3
Hypotonic medium slows the EPI-induced increase in [cAMP]i in cortical astrocytes. (A) Time course of changes in Epac1-camps emission ratio after addition of 1 μM EPI in isotonic medium (top; Isotonic+EPI) and hypotonic medium (bottom; Hypo+EPI). The medium osmolality was reduced by adding distilled water to the bathing chamber. Values are mean±SEM. Numbers in parentheses are numbers of cells analyzed. EPI increased the FRET signal to the same extent (P > 0.995) under hypotonic conditions (14.99±2.39%; P < 0.05 vs. time 0, n=7 from four experimental replicates) and isotonic conditions (14.23±1.17%, P < 0.05 vs. time 0, n=16 from four experimental replicates). n, total number of independent experiments. (B) FRET response induced by EPI had slower decay kinetics in cells in hypotonic medium. EPI in isotonic medium triggered a single-exponential decay in FRET response with τ of 15.2±2.4 s. EPI in hypotonic medium triggered a double-exponential decay in FRET response with a fast component (τ1) of 12.8±2.2 s and a slow component (τ2) of 226.2±56.8 s.
FIGURE 4
FIGURE 4
AR activation in swelling cortical astrocytes reduces increases in [Ca2+]i. (A) Representative fluorescence images of astrocytes labeled with Ca2+ indicator (Fluo-4/AM ester) and stimulated with hypotonic medium (Hypo). Scale bar: 40 μm. (B–F) Representative (upper panel) and mean (lower panel) fluorescence intensity changes in [Ca2+]iF/F0) in astrocytes stimulated first with (B) isotonic medium (n=36; four experimental replicates), (C) 1 μM EPI (n=23; three experimental replicates), or (D) 10 μM ISO and then with hypotonic medium (n=28; four experimental replicates). In panels E and F, cells were exposed to hypotonic medium and then to (E) 1 μMEPI (n=21; three experimental replicates) or (F) 10 μM ISO (n=33; four experimental replicates). Note that hypotonic medium-induced changes in [Ca2+]i are shorter in (C) EPI− or (D) ISO-pretreated astrocytes than in untreated cells (compare traces marked with one asterisk, E, F). Values are mean±SEM (gray lines). n, total number of independent experiments. Times of stimulation are indicated with black lines (hypotonic and isotonic) and white lines (EPI or ISO). Dotted lines indicate the prestimulus ΔF/F0. (G–I) Cumulative ΔF/F0 changes normalized to the maxima over a 100-s interval after hypotonic stimulation in untreated (Hypo) and EPI-pretreated (G; EPI+Hypo) or ISO-pretreated cells (H; ISO+Hypo) and (I) after stimulation with EPI in untreated cells (EPI) and in cells pretreated with hypotonic medium and then treated with EPI (Hypo+EPI) or ISO (Hypo+ISO). Note that AR activation speeds the decline of hypotonicity-induced changes in [Ca2+]i. Numbers in parentheses are the numbers of cells analyzed. Values are mean±SEM. In panels G and H, *P < 0.05, **P < 0.01, ***P < 0.001 vs. Hypo. In panel I, *P < 0.05, EPI vs. Hypo+EPI; ###P < 0.0001, EPI vs. Hypo+ISO. Single-exponential decay functions were fitted to data points (black lines) with forms: F=F0 + c × exp(−t × k), with rate constants (k) of k(Hypo)=0.007, k(EPI+Hypo)=0.012, k(ISO+Hypo)=0.016, k(EPI)=0.01, k(Hypo+EPI)=0.009, k(Hypo + ISO)=0.039. Dotted lines indicate the maximum change in ΔF/F0.
FIGURE 5
FIGURE 5
EPI treatment reduces astrocyte swelling after spinal cord injury. (A) In gray matter sampled in each millimeter of tissue around the SCI epicenter, cell bodies (yellow arrows) are larger in saline-treated than in EPI-treated spinal cords. (B) Z-stack serial confocal images of representative cells stained with SR101 and TRH (white outlines), which were used to calculate the cell body volume in the two study groups. (C) A representative three-dimensional reconstruction of the confocal z-series shows the difference in cell body volume between the two groups. The size of the largest cross-sectional area of the glial cell body correlates positively with the volume of the same cell. (D–F). Semiquantitative analyses show that the two study groups differed in (D) the percentage of each standardized imaging field occupied by positive fluorescence signals (n=3/treatment), (E) the mean size of the widest/largest cross-sectional area measured per astrocyte (n=15/group), and (F) the mean volume of the astrocyte cell body (n=15/group), sampled from each millimeter of tissue adjacent to the injury epicenter (i.e., 0 mm, not included). (G) Histochemical staining images of spinal cord coronal sections sampled at 1-mm intervals rostral and caudal to the injury epicenter (total length: 10 mm). (H) The average tissue volume differed significantly between the EPI-treated and saline control groups in loci 1–3 mm caudal to the epicenter (i.e., −1 to −3 mm; n=30 cells from three rats in each group; P < 0.05, repeated-measures ANOVA with post hoc t test).
FIGURE 6
FIGURE 6
EPI treatment reduces neuronal swelling after spinal cord injury. (A) Immunocytochemical imaging of NeuN-positive neurons in gray matter sampled 2 mm caudal to the injury epicenter shows strongly labeled nuclei and more faintly labeled cell body outlines. Neuron cell body sizes were compared in (1) ventral horn (black dashed circles), (2) intermedial gray matter (blue dashed circles), and (3) expanded pericentral canal gray matter (orange dashed circles). (B) The average size of ventral horn motor neurons between the groups. (C, D) After SCI, the mean body size of interneurons in the intermedial gray matter (C) and in the expanded pericentral canal gray matter (D) was significantly larger in saline controls. Immunocytochemical staining for NFM confirmed that the neurons (green cells with white outlines, panel E) in saline controls had significantly larger cell bodies (F) and significantly thicker axon hillocks (G), than EPI-treated spinal cords in the impacted pericentral canal regions that were indiscernible from those in an uninjured naive spinal cord (n=30 cells from three rats in each group).

References

    1. Andrew RD, Labron MW, Boehnke SE, Carnduff L, Kirov SA. Physiological evidence that pyramidal neurons lack functional water channels. Cereb Cortex. 2007;17:787–802. - PubMed
    1. Appaix F, Girod S, Boisseau S, Römer J, Vial JC, Albrieux M, Maurin M, Depaulis A, Guillemain I, van der Sanden B. Specific in vivo staining of astrocytes in the whole brain after intravenous injection of sulforhodamine dyes. PLoS One. 2012;7:e35169. - PMC - PubMed
    1. Azevedo FA, Carvalho LR, Grinberg LT, Farfel JM, Ferretti RE, Leite RE, Jacob Filho W, Lent R, Herculano-Houzel S. Equal numbers of neuronal and nonneuronal cells make the human brain an isometrically scaled-up primate brain. J Comp Neurol. 2009;513:532–541. - PubMed
    1. Bender AS, Neary JT, Norenberg MD. Involvement of second messengers and protein phosphorylation in astrocyte swelling. Can J Physiol Pharmacol. 1992;70(Suppl):S362–S366. - PubMed
    1. Betzenhauser MJ, Fike JL, Wagner LE, Yule DI. Protein kinase A increases type-2 inositol 1,4,5-trisphosphate receptor activity by phosphorylation of serine 937. J Biol Chem. 2009;284:25116–25125. - PMC - PubMed

Publication types

Substances