. 2016 Sep;117(9):2158-69.
doi: 10.1002/jcb.25556. Epub 2016 May 11.

Biotechnological Chondroitin a Novel Glycosamminoglycan With Remarkable Biological Function on Human Primary Chondrocytes

Affiliations

Biotechnological Chondroitin a Novel Glycosamminoglycan With Remarkable Biological Function on Human Primary Chondrocytes

Antonietta Stellavato et al. J Cell Biochem. 2016 Sep.

Abstract

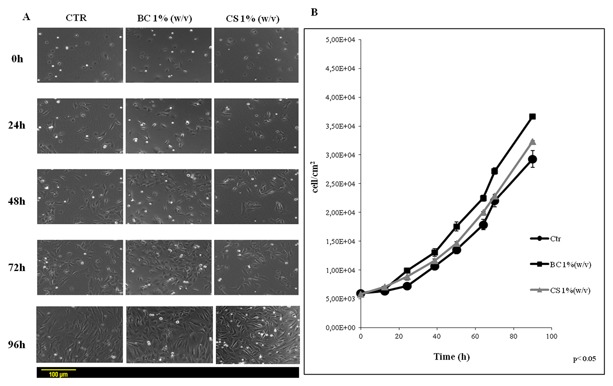
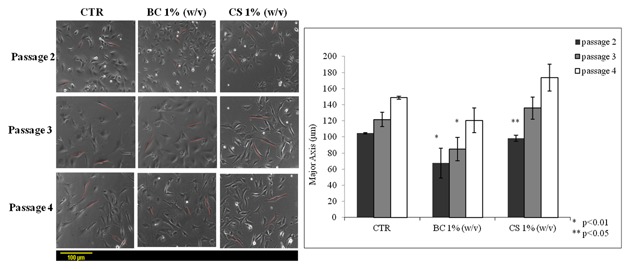
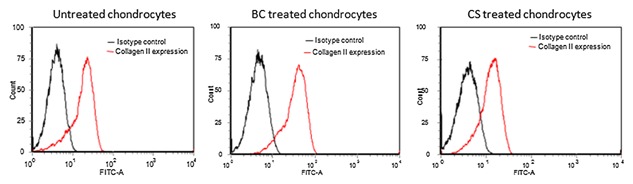
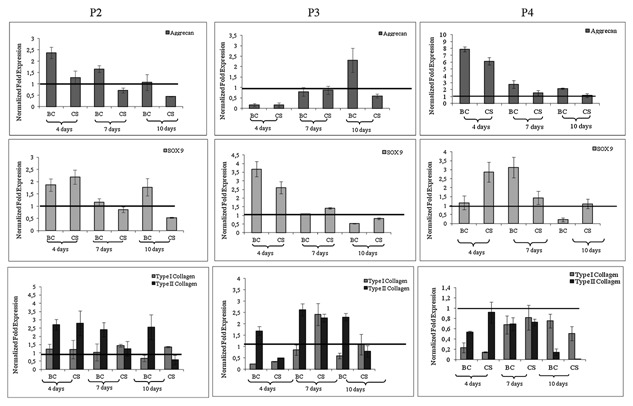
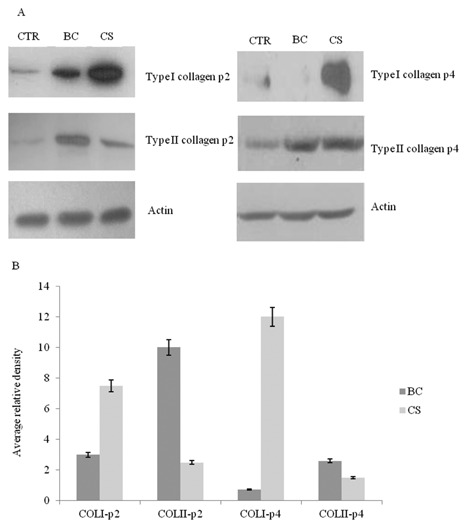
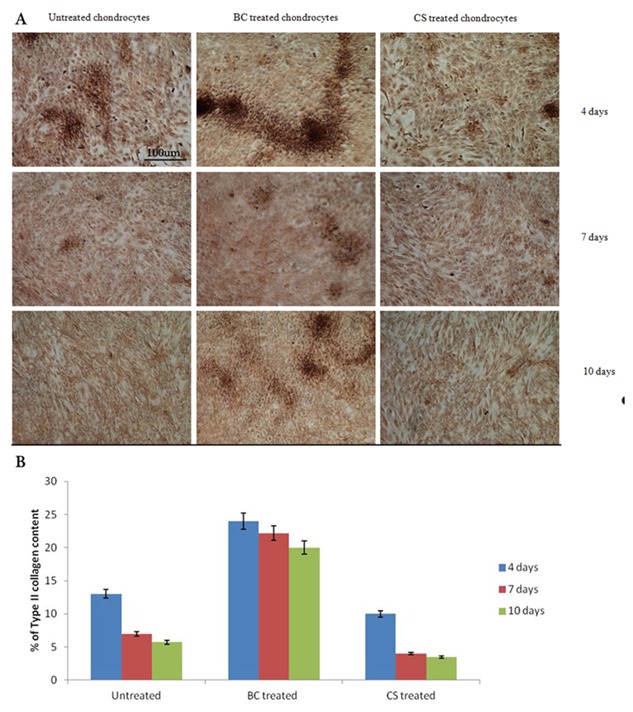
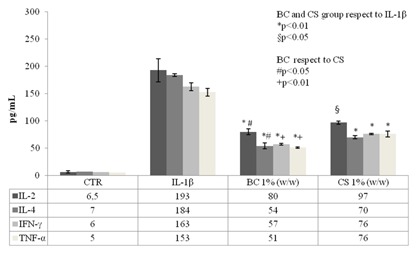
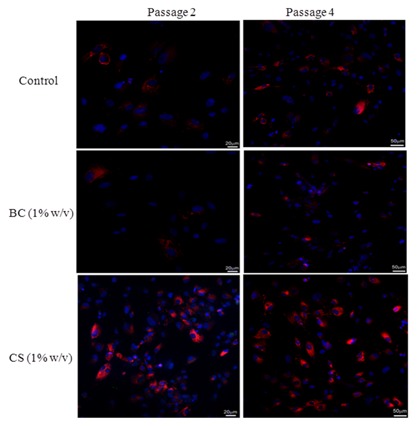
Cartilage tissue engineering, with in vitro expansion of autologus chondrocytes, is a promising technique for tissue regeneration and is a new potential strategy to prevent and/or treat cartilage damage (e.g., osteoarthritis). The aim of this study was (i) to investigate and compare the effects of new biotechnological chondroitin (BC) and a commercial extractive chondroitin sulfate (CS) on human chondrocytes in vitro culture; (ii) to evaluate the anti-inflammatory effects of the innovative BC compared to extractive CS. A chondrogenic cell population was isolated from human nasoseptal cartilage and in vitro cultures were studied through time-lapse video microscopy (TLVM), immunohistochemical staining and cytometry. In order to investigate the effect of BC and CS on phenotype maintainance, chondrogenic gene expression of aggrecan (AGN), of the transcriptor factor SOX9, of the types I and II collagen (COL1A1 and COL1A2), were quantified through transcriptional and protein evaluation at increasing cultivation time and passages. In addition to resemble the osteoarthritis-like in vitro model, chondrocytes were treated with IL-1β and the anti-inflammatory activity of BC and CS was assessed using cytokines quantification by multiplex array. BC significantly enhances cell proliferation also preserving chondrocyte phenotype increasing type II collagen expression up to 10 days of treatment and reduces inflammatory response in IL-1β treated chondrocytes respect to CS treated cells. Our results, taken together, suggest that this new BC is of foremost importance in translational medicine because it can be applied in novel scaffolds and pharmaceutical preparations aiming at cartilage pathology treatments such as the osteoarthritis. J. Cell. Biochem. 117: 2158-2169, 2016. © 2016 The Authors. Journal of Cellular Biochemistry Published by Wiley Periodicals, Inc.

Keywords: BIOTECHNOLOGICAL CHONDROITIN; CHONDROITIN SULFATE; ECM BIOMARKERS; INFLAMMATION IN VITRO MODEL; NASAL CHONDROCYTES; TIME-LAPSE VIDEOMICROSCOPY.


Figures

Figure 1
Figure 1
A: Representative micrographs pictures relative to cell growth in time lapse experiments at 0, 24, 48, and 72 of treatment with biotechnological chondroitin (BC 1% w/v) and chondroitin sulfate (CS 1% w/v). B: Proliferation curves for nasoseptal chondrocytes. The cells growth was obtained analyzing, by counting, three different wells for each treatment (Untreated‐cells = CTR), biotechnological chondroitin (BC 1% w/v) and chondroitin sulfate (CS 1% w/v) of the five different experiments. Data shown are means ± SD (P < 0.05).
Figure 2
Figure 2
Comparative cell dimensions analysis relative to major axis between chondrocytes cultured a three different passages (p2, p3, p4) in presence of biotechnological chondroitin (BC 1% w/v) and chondroitin sulfate (CS 1% w/v) after 7 days of treatment. The data represent mean ± SD of three independent experiments. The groups (BC at passage 2 and 3 respect to control) are significantly different according to Student's t‐test (*P < 0.01) and (CS passage 2 respect to control) (**P < 0.05).
Figure 3
Figure 3
Flow cytometry. Type II collagen expression on untreated, BC‐treated and CS‐treated chondrocytes at 2° passage by flow cytometry. BC‐treated chondrocytes express type II collagen levels greater than both untreated and CS‐treated chondrocytes.
Figure 4
Figure 4
Quantitative RT‐PCR analysis of the expression levels respectively of Aggrecan (AGN), type I collagen (COL1A1), type II collagen (COL2A1), and SOX‐9 mRNA in the chondrocytes monolayer at passages 2 (p2), 3 (p3), and 4 (p4). The histogram reported the mean of six different experiments performed in triplicate. The groups (BC respect to IL‐1β and BC respect to CS) are significantly different according to Student's t‐test (# P < 0.01 and *P < 0.05).
Figure 5
Figure 5
A: Representative western blot analysis of COL2A1, COL1A1 and actin housekeeping protein levels in chondrocytes (BC 1% w/v) and (CS 1% w/v) treated samples, after 10 days of treatment, compared to the control at passages 2 and 4. B: In order to measure protein expression levels (types I and II collagen), intensities of specific bands, corresponding to the proteins of interest are measured using commercially available software (Image J software). The histogram reported the mean of three different experiments performed in duplicate.
Figure 6
Figure 6
A: Immunohistochemical analysis, figure of Histology. Immunohistochemistry for type II collagen expression on untreated, BC‐treated and CS‐treated chondrocytes at 2° passage at 4, 7, and 10 days. BC treated chondrocytes express type II collagen levels greater than both untreated and CS treated chondrocytes with formation of ECM. Untreated and CS‐treated chondrocytes show a type II collagen distribution especially on surface of cell membrane and the shape of these cells results to be more fibroblast than polygonal. B: Quantification of type II collagen by Image J software, the graph showed the mean of two different experiments.
Figure 7
Figure 7
Cytokines production assay in chondrocytes cell supernatants. We reported the significant molecule levels in the control (untreated cells), in IL‐1β and in BC (1% w/w) and in CS (1% w/w) treatments. The graph showed the mean of two experiments performed in triplicate. The groups (BC and CS respect to IL‐1β) are significantly different (*P < 0.01 and § P < 0.05) and BC groups respect to CS in according to Student's t‐test (# P < 0.05 and + P < 0.01).
Figure 8
Figure 8
Confocal microscopy images. Type I collagen expression (red) in human primary nasal chondrocytes (untreated cells = control) treated with biotechnological chondroitin (BC 1% w/v) and chondroitin sulfate (CS 1% w/v). Cytoplasmatic distribution of type I collagen in chondrocytes at different passages of culture (p2–p4), after 10 days of treatment, was determined by immunofluorescnce as described above.

References

    1. Altman RD. 2010. Pharmacological therapies for osteoarthritis of the hand: A review of the evidence. Drugs Aging 27(9):729–745. - PubMed
    1. Bell DM, Leung KKH, Wheatly SC, Ng LJ, Zhou S. 1997. SOX9 directly regulates the type‐II collagen gene. Nat Genet 16:174–178. - PubMed
    1. Benya PD, Padilla SR, Nimni ME. 1978. Independent regulation of collagen types by chondrocytes during the loss of differentiated function in culture. Cell 15:1313–1321. - PubMed
    1. Bradford MM. 1976. A rapid and sensitive method for the quantitation of microgram quantities of protein utilizing the principle of protein‐dye binding. Anal Biochem 7(72):248–254. - PubMed
    1. Calamia V, Ruiz‐Romero C, Rocha B, Fernández‐Puente P, Mateos J. 2010. Pharmacoproteomic study of the effects of chondroitin and glucosamine sulfate on human articular chondrocytes. Arthritis Res Ther 12(4):R138. - PMC - PubMed

Publication types