. 2016 Apr 21;532(7599):370-4.
doi: 10.1038/nature17192. Epub 2016 Mar 28.

Anatomy and function of an excitatory network in the visual cortex

Affiliations

Anatomy and function of an excitatory network in the visual cortex

Wei-Chung Allen Lee et al. Nature. .

Abstract

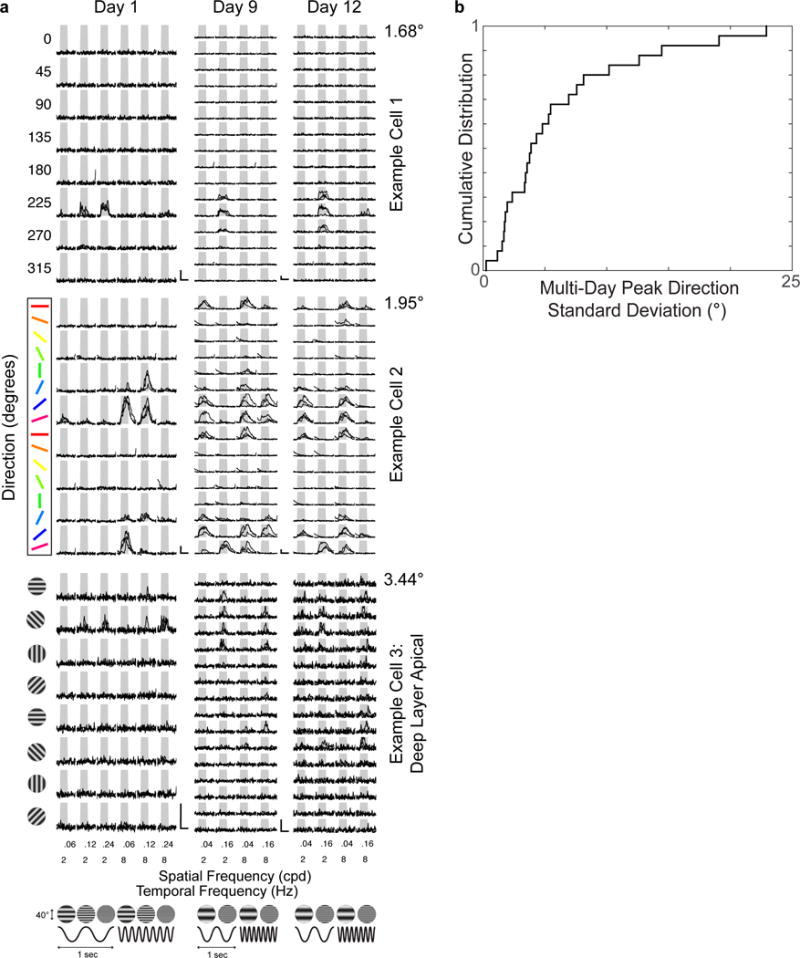
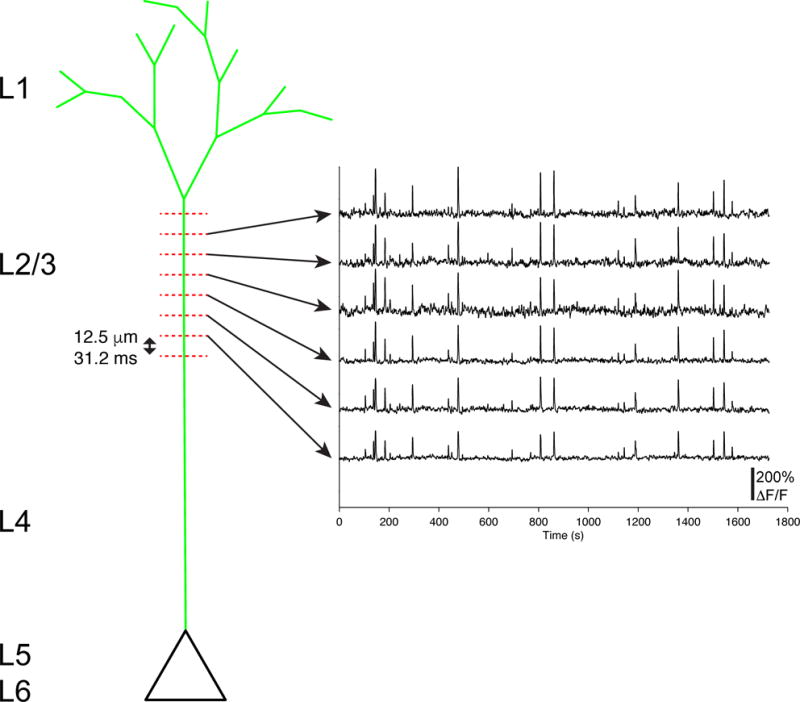
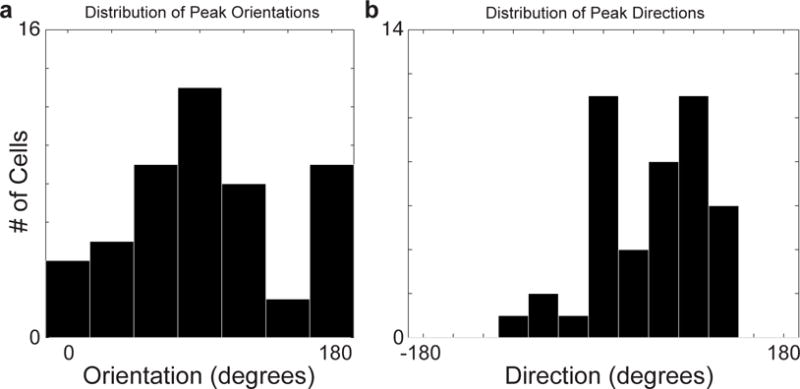
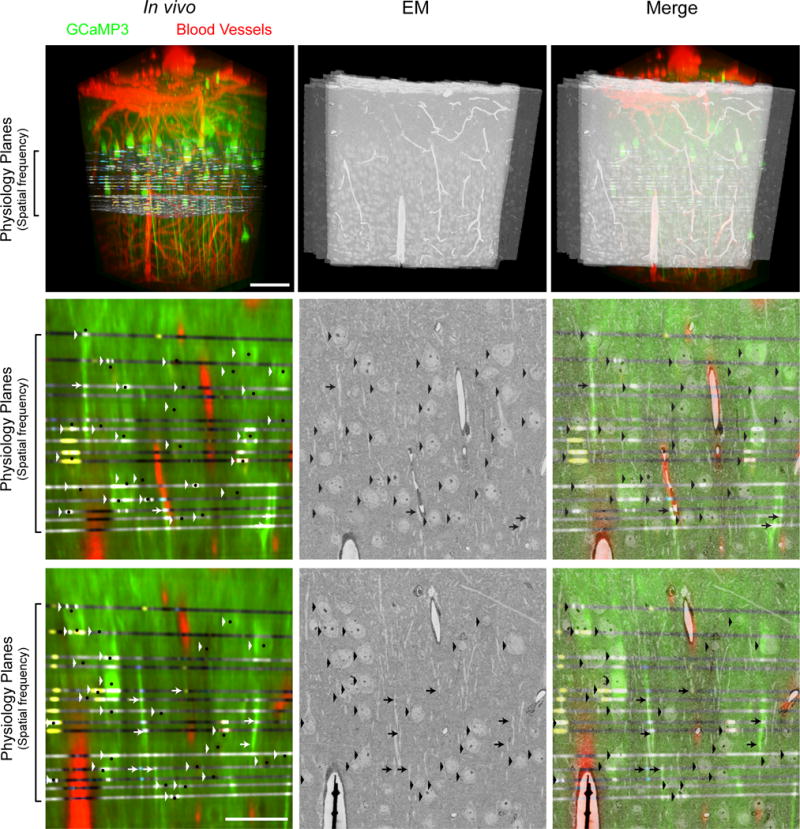
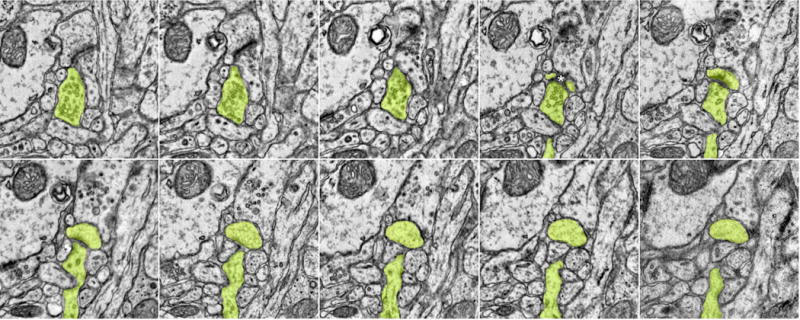
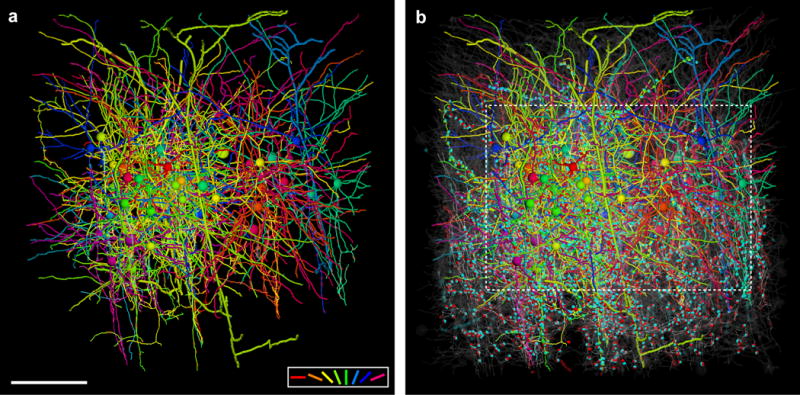
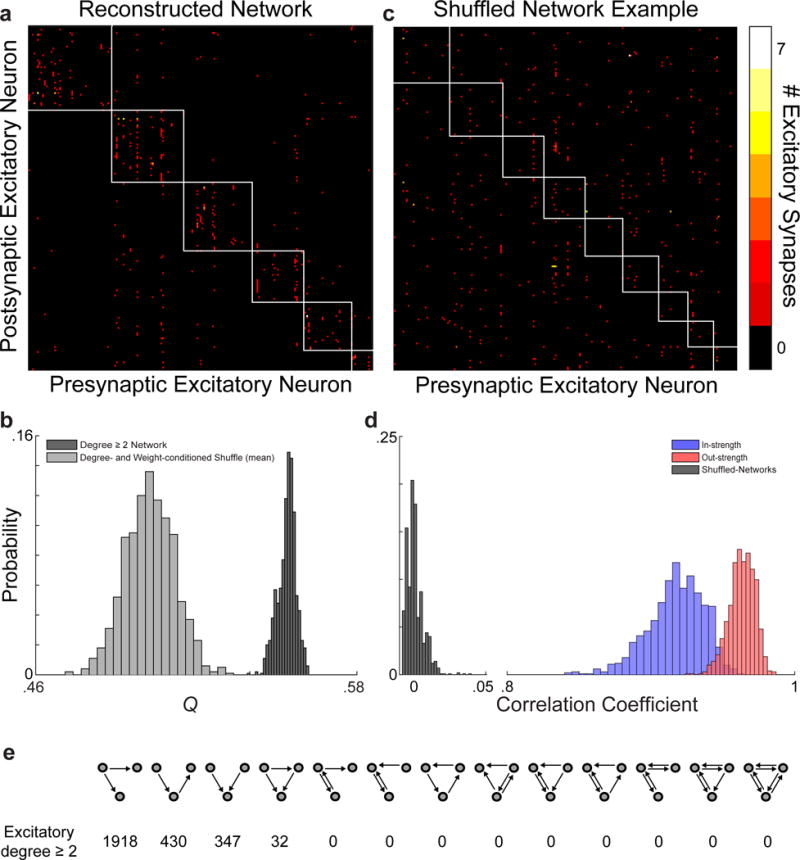
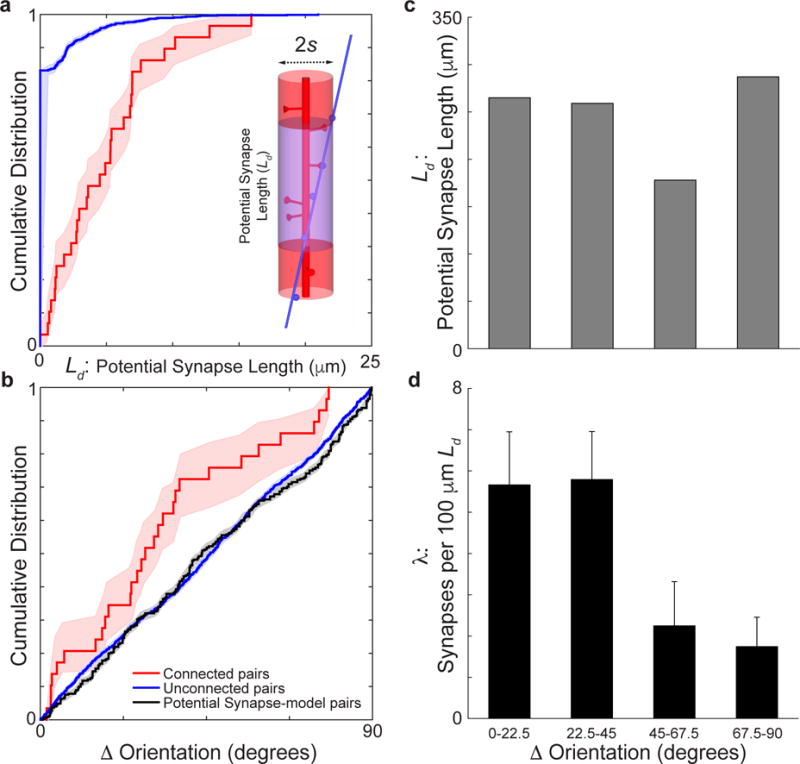
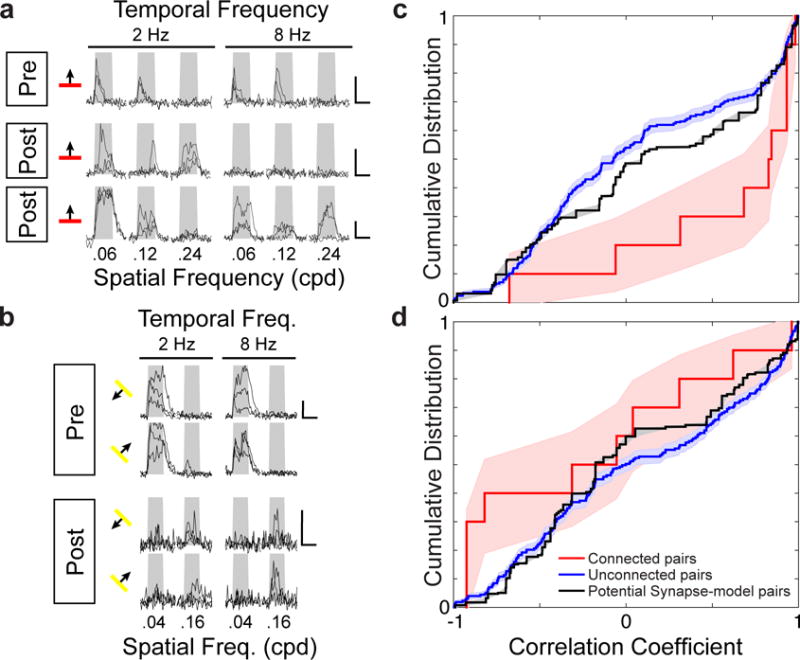
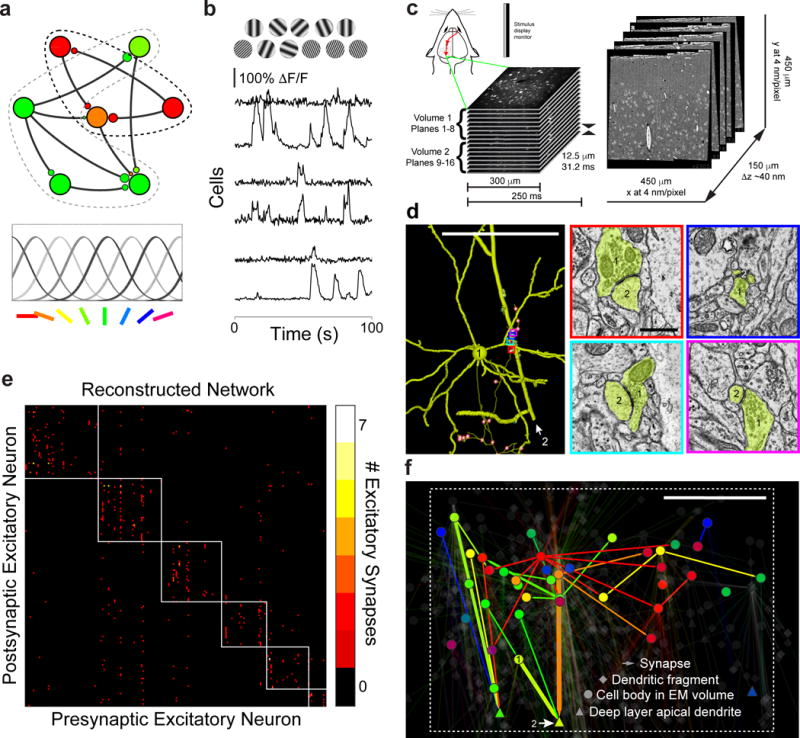
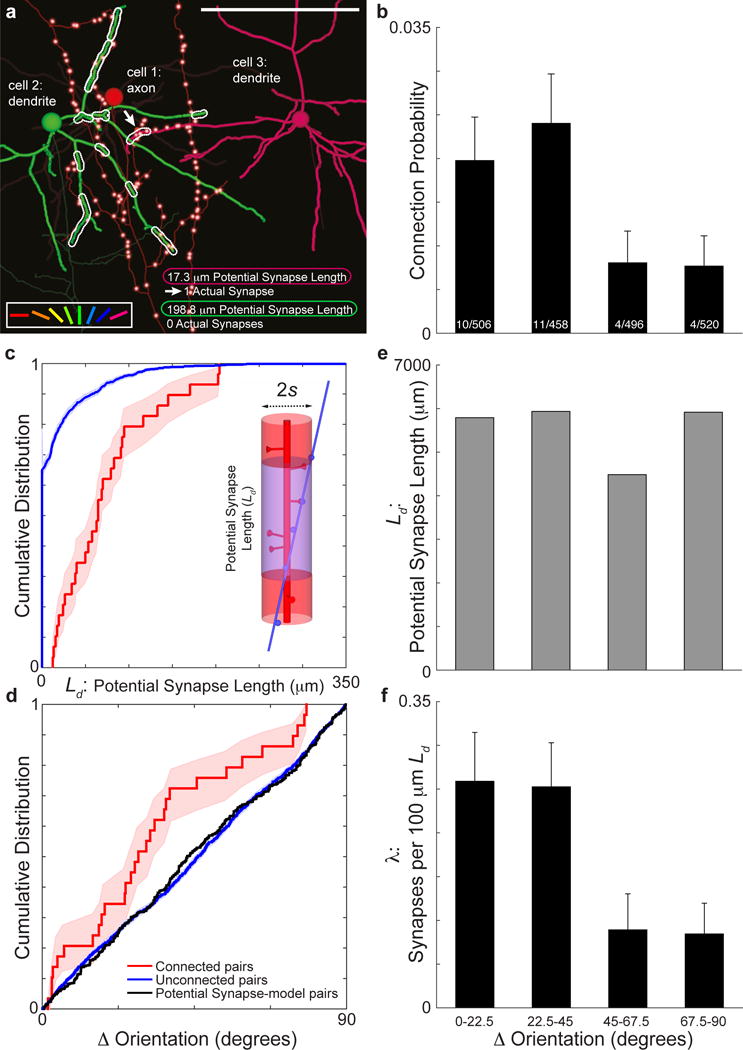
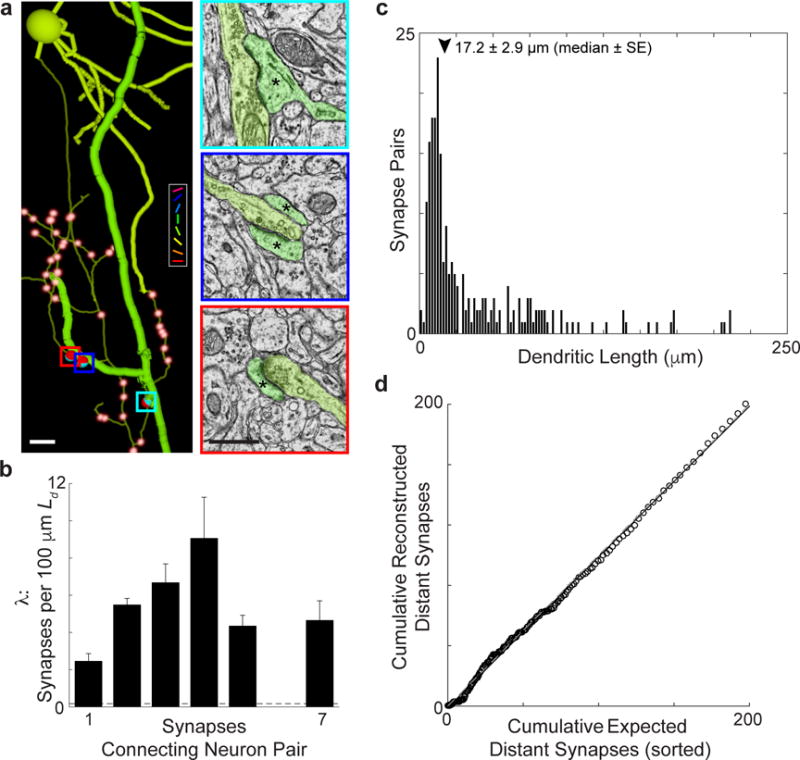
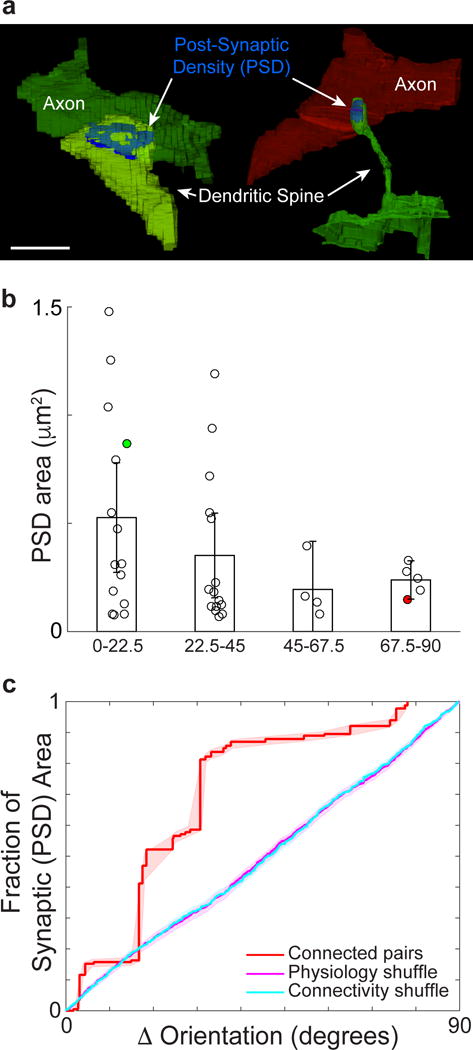
Circuits in the cerebral cortex consist of thousands of neurons connected by millions of synapses. A precise understanding of these local networks requires relating circuit activity with the underlying network structure. For pyramidal cells in superficial mouse visual cortex (V1), a consensus is emerging that neurons with similar visual response properties excite each other, but the anatomical basis of this recurrent synaptic network is unknown. Here we combined physiological imaging and large-scale electron microscopy to study an excitatory network in V1. We found that layer 2/3 neurons organized into subnetworks defined by anatomical connectivity, with more connections within than between groups. More specifically, we found that pyramidal neurons with similar orientation selectivity preferentially formed synapses with each other, despite the fact that axons and dendrites of all orientation selectivities pass near (<5 μm) each other with roughly equal probability. Therefore, we predict that mechanisms of functionally specific connectivity take place at the length scale of spines. Neurons with similar orientation tuning formed larger synapses, potentially enhancing the net effect of synaptic specificity. With the ability to study thousands of connections in a single circuit, functional connectomics is proving a powerful method to uncover the organizational logic of cortical networks.


Conflict of interest statement

The authors declare no competing financial interests.

Figures

Extended Data Figure 1
Extended Data Figure 1. Sensory physiology is maintained over days
a, Visually evoked calcium responses are maintained across days. Three example neurons (rows) on the first, ninth, and twelfth day (columns) of in vivo two-photon calcium imaging. Three individual trial responses (black lines) of 8 directions, 3 spatial and 2 temporal frequencies (left column, day 1); or 16 directions, 2 spatial and 2 temporal frequencies (middle and right rows, days 9 and 12). Scale bars, 100% ΔF/F and 4 seconds. Standard deviation of preferred direction across days for each neuron is to the upper right of activity matrices. b, Neurons direction selectivity is stable over days. Cumulative distribution of standard deviation of peak preferred direction (4.1° ± 1.7°, median ± SE) across days for 25 neurons measured over multiple days.
Extended Data Figure 2
Extended Data Figure 2. Deep layer apical responses are likely suprathreshold reflecting activity at the soma
Example ΔF/F time courses from a deep layer apical dendrite optically sectioned in vivo across 6–8 planes. Note, activity is correlated across depth and relatively stable over days (Extended Data Fig. 1).
Extended Data Figure 3
Extended Data Figure 3. Distribution of orientation and direction tuned cells
Histograms of functionally characterized cells with measured a, peak orientation and b, direction preference.
Extended Data Figure 4
Extended Data Figure 4. In vivo to EM correspondence of neuronal targets
(top row) Volumetric projections of the aligned in vivo and EM imaged volumes. Physiology planes were acquired horizontally and EM sections cut frontally (coronally) from the brain. Interdigitated physiology planes are from 2 representative volumetrically scanned experiments stacked atop one another in space (Fig. 1c) so as to span from the border of L1 and L2 through the depth of L2/3. Scale bar, 100 μm. (middle and bottom rows) Re-sliced planes through the in vivo volume corresponding to EM sections. Arrowheads indicate matching cell bodies, and arrows deep layer (putative L5) apical dendrites. Small black dots mark the centers of cell bodies corresponding principally to nuclei where calcium indicator fluorescence is typically excluded. Scale bar, 50 μm.
Extended Data Figure 5
Extended Data Figure 5. En face synapse example
Serial sections from an obliquely cut synapse (Fig. 1d, top right, same scale). Color overlays correspond to peak orientation preference (colour key, same as Fig. 1a, bottom).
Extended Data Figure 6
Extended Data Figure 6. Network reconstruction
3-D rendering of dendrites and axons, cell bodies (large spheres), and synapses (small spheres) of a, 50 functionally characterized neurons reconstructed in the EM volume. Cell bodies, dendrites, axons, and synapses colour coded by peak preferred stimulus orientation (colour key, bottom right). Axons are the thinnest processes, dendrites of L2/3 neurons are thicker, and deep layer apical dendrites are rendered with the largest caliber. Dendritic spines were traced only if they participated in connections between reconstructed neurons. b, ~1800 additional neuronal targets reconstructed in the EM volume (transparent gray). Input and output synapses are coloured cyan and red respectively when orientation selectivity was not known. Bounding box matches region in Fig. 1f. Scale bar, 150 μm.
Extended Data Figure 7
Extended Data Figure 7. Network modularity is significantly non-random
a, Connectivity matrix of 201 excitatory neuronal targets in our network reconstruction with multiple synaptic partners (i.e. degree ≥ 2, no leaf nodes, same as Fig. 1e). Colour represents the number of synapses (colour key, (c) right) between pre- and post-synaptic neurons (same neuron order on both ordinate and abscissa). Subnetworks of interconnected neurons (white boxes) detected using a consensus method of Louvain clustering,. b, Modularity (Q) of the reconstructed network is significantly greater than null models with degree, weight, and strength preserved. Histograms of the modularity values for the reconstructed network (dark gray, Qmean = 0.55 ± .003, mean ± SD, computed 1000 times) is significantly greater than for the Qmean of shuffled null models (light gray, Qmean = 0.50 ± .009, mean ± SD, P ≈ 0, Permutation test, kshuffles = 1000). c, Example of the shuffled connectivity matrix with a Q closest to the mean of the shuffled distribution with clustering (white boxes) computed as in (a). d, Null models are well-shuffled, while approximating connection input and output strengths. Histograms of correlation coefficients between the reconstructed network and the null models’ in- (blue: .92 ± .02, mean ± SD) and out- (red: 96 ± .01, mean ± SD) strength and connectivity matrix (gray: 9.1×10⁻⁴ ± .01, mean ± SD). e, Occurrences of three neuron connectivity motifs found in the reconstructed network between excitatory neuronal targets.
Extended Data Figure 8
Extended Data Figure 8. Cell bodies are functionally intermingled
Differences in a, peak orientation and b, direction preference between neuron pairs plotted against the distance between their cell bodies. Uniform distributions of functional versus spatial distance suggest a salt and pepper intermingling of neuronal cell bodies across functional properties.
Extended Data Figure 9
Extended Data Figure 9. Axons and dendrites are functionally intermingled at shorter length scales
Uniform functional diversity and prediction of connectivity at finer length scales suggest a salt and pepper intermingling of axons and dendrites. (a-d) same as Fig. 2c–f for s = 1 μm. Significance tests: (a) P ≈ 0, Permutation test, nconnected pairs = 29, nunconnected pairs = 1951. (b) Between connected (red line) and unconnected pairs (blue line, P < 0.05, Permutation test, nconnected pairs = 29, nunconnected pairs = 1951) or a model distribution based on potential synapse length (black line, P < 0.01, Permutation test, nconnected pairs = 29, nunconnected pairs = 1951). Shaded regions, a-b, and error bars, d, represent bootstrapped standard error.
Extended Data Figure 10
Extended Data Figure 10. Connectivity is not predicted by residual signal correlation after removal of orientation preference
(a–b), Example activity (ΔF/F individual trial time courses) for connected neurons from experiments varying direction, spatial and temporal frequencies of grating stimuli. a, Presynaptic cell (top row) and two of its postsynaptic partners’ (middle and bottom rows) for 3 spatial and 2 temporal frequencies and one orientation (orientation tuning was virtually identical). b, Presynaptic cell (top) and a postsynaptic deep layer apical dendrite’s (bottom) responses to 2 spatial and 2 temporal frequencies, and 2 directions, (again, orientation tuning was virtually identical). Gray window delineates time of stimulus presentation. Scale bars, 100% ΔF/F and 4 seconds. c, Cumulative distribution of signal correlations from simultaneously measured cells was significantly greater between connected than unconnected pairs (P < 0.01, Permutation test, nconnected pairs = 10, nunconnected pairs = 426) or a model distribution based on potential synaptic connectivity (P < 0.05, Permutation test). d, After averaging over orientations, the cumulative distribution of signal correlations was similar between connected and unconnected pairs (P > 0.14, Permutation test, nconnected pairs = 10, nunconnected pairs = 426) and a model distribution based on potential synaptic connectivity (P > 0.25, Permutation test, nconnected pairs = 10, nunconnected pairs = 426). Shaded regions, c-d, represent bootstrapped standard error.
Figure 1
Figure 1. Functional organization of cortical excitatory network connectivity
a, Schematic representation of functionally selective connections between excitatory neurons. Excitatory pyramidal cells (large circles) with different preferred orientations provide synaptic input (smaller circles) to one another (bottom: colour code used throughout to indicate stimulus orientation that evokes peak physiological responses). b, Example stimuli (top) and time courses ΔF/F signals from single cells. c, Combined in vivo two-photon calcium imaging followed by electron microscopy (EM). (top left) Schematic of imaging in the awake mouse, targeting the monocular region of the primary visual cortex (largest dotted-outlined region surrounded by higher visual areas). Red arrows represent the visual pathway from eye to visual thalamus to cortex. Serial EM sections (right) were cut orthogonal to the functional imaging planes (left). d, (left) Reconstruction of a layer 2/3 (L2/3) pyramidal neuron (cell 1) presynaptic to a deep layer apical dendrite (cell 2), reconstructed from EM (colour indicates peak stimulus orientation). The thinnest process is the axon, dendrites of the L2/3 neuron are thicker, and the deep layer apical dendrite is rendered with the largest caliber. Dendritic spines were traced only if they participated in connections between reconstructed neurons. Presynaptic boutons (small red spheres with white centers) not connecting this cell pair are semi-transparent. EM micrographs of synapses (right) with similar overlay colours corresponding to the very similar peak orientation preferences for cells 1 and 2. e, Connectivity matrix of 201 excitatory neuronal targets in our network reconstruction with multiple synaptic partners (i.e. degree ≥ 2, no leaf nodes). Colour represents the number of synapses (colour key, right) between pre- and post-synaptic neurons (same neuron order on both ordinate and abscissa). Subnetworks of interconnected neurons (white boxes) detected using a consensus method of Louvain clustering (Q = 0.55 ± .003, mean ± SD),. f, Network graph of functionally characterized pyramidal neurons and their connections to other excitatory neuronal targets (transparent) viewed coronally. Arrows represent synaptic connections and their shaft thickness is scaled by number of synapses (range: 1–7). Neuronal targets with cell bodies in the EM volume drawn as circles; large caliber apical dendrites that exit the volume (deep layer pyramidal cells) drawn as triangles; and other postsynaptic targets (dendritic fragments) drawn as diamonds. Nodes are positioned by cell body location, synapse location (for dendritic fragments), or, for deep layer apical dendrites, by the deepest position when exiting the volume. Cells labeled 1 and 2 are the same as in (d). Bounding box matches region in Extended Data Fig. 6. Scale bars, d, (left) 100 and (right) 1 μm, f, 100 μm.
Figure 2
Figure 2. Synaptically connected pyramidal cells predicted by function, over and above proximity
a, Reconstructions of three neurons with examples of potential synapse length (Ld, dotted outlines), which quantifies the dendritic path length of cells 2 and 3 within a maximal spine length (s = 5 μm) of the axon of cell 1. Neurons colour-coded by preferred stimulus orientation (colour key, bottom left; same as Figure 1). Note, the large Ld, but lack of actual synapses between cells 1 and 2 and small Ld between cells 1 and 3 where an actual synapse (arrow) is observed along the Ld. The axon of the postsynaptic cells and dendrites of the presynaptic cell are transparent. Only presynaptic boutons (small red spheres with white centers) from the presynaptic cell are visible. b, Synaptically connected neurons have similar orientation preference. Connection probability as function orientation preference difference across the reconstructed population (P < 0.05, Cochran–Armitage test, nconnected pairs = 29, nunconnected pairs = 1951). Bins include pairs of neurons with differences in preferred orientation of 0° to 22.5°, 22.5° to 45°, 45° to 67.5°, and 67.5° to 90°. Fractions at the bottom of bars are the number of connected over unconnected pairs in each bin. c, Synaptically connected neurons have greater potential synapse length. Cumulative distribution of potential synapse length was significantly greater between connected (red line) than unconnected pairs (blue line, P ≈ 0, Permutation test, nconnected pairs = 29, nunconnected pairs = 1951, s = 5 μm). Inset: Schematic of a cylinder of length Ld (transparent purple) around the dendrite (red) with a radius (s) equivalent to a maximal spine’s length where the axon (blue) comes within proximity to make a synapse. d, Cumulative distribution of differences in orientation preference was significantly less between connected (red line) than unconnected pairs (blue line, P < 0.05, Permutation test, nconnected pairs = 29, nunconnected pairs = 1951) or a model distribution based on potential synapse length (black line, P < 0.05, Permutation test, nconnected pairs = 29, nunconnected pairs = 1951). e, Potential synapse length (Ld) is uniform across differences in peak orientation preference between neurons in the model distribution. f, Synapse rate (λ: reconstructed synapses normalized by Ld) decreases with orientation preference difference across the reconstructed population (P < 0.05, Cochran–Armitage test, nsynapses = 39, s = 5 μm). Error bars, b, f, and shaded regions, c-d, represent bootstrapped standard error. Scale bar, a, 100 μm.
Figure 3
Figure 3. Multiple synapses between neurons are found above chance levels; clustered synapses are frequently observed, but are not specifically enriched
a, Anatomical reconstruction (left) of a L2/3 pyramidal cell presynaptic to a deep layer apical dendrite (thick process) by multiple synapses (right, corresponding colored boxes). Asterisks denote postsynaptic cell. Colour key and synapses not connecting this cell pair are rendered as in Figs. 1 and 2. Of 130 reconstructed presynaptic neurons, 51 had axons making multiple synapses onto individual neuronal targets. b, Synapse rates (λ) normalized by potential synapse length (Ld, s = 5 μm) for neuron pairs connect by 1–7 synapses are significantly higher than expected from a Poisson process with a synapse rate = λ (P ≈ 0, Permutation tests, nsynapses = 292). Dashed line is λavg from Fig. 2f. c, Histogram of the dendritic path length between pairs of synapses connecting neurons with multiple synapses. The median distance between synapses connecting neuron pairs was 17.2 ± 2.9 μm (median ± SE, arrowhead). d, Multiple synapses are distributed randomly, with equal tendency to be clustered or distant. The cumulative number of distant (> 20 μm) reconstructed synapses, vs. nearby (< 20 μm), follows the cumulative number expected from a constant synapse rate, based on synapse multiplicity normalized by Ld, for each cell pair. X-axis sorted by expected number of distant synapses; the dashed line is unity. Error bars, b, represent standard error. Scale bars, a, (left) 10 and (right) 1 μm.
Figure 4
Figure 4. Sensory physiology predicts synaptic size
a, Volumetric reconstructions of synapses between functionally characterized cells. Examples of postsynaptic densities (PSDs, blue) for a pair of iso-oriented neurons and for cross-oriented neurons (colour key as in previous figures). b, PSD area decreases as difference in orientation preference increases (examples in (a) labeled green and red respectively; bins: 0° to 22.5°, 22.5° to 45°, 45° to 67.5°, and 67.5° to 90°). c, Cumulative fraction of PSD area accounted for by connections as a function of the difference in orientation preference (red line) is significantly greater than controls (shuffled orientation preference (magenta), or connectivity (cyan), both P < 0.01, Permutation tests, nsynapses = 39). Error bars, b, represent 95% confidence intervals and shaded regions, c, represent bootstrapped standard error. Scale bar, a, 1 μm.

References

    1. Harris KD, Mrsic-Flogel TD. Cortical connectivity and sensory coding. Nature. 2013;503:51–58. doi: 10.1038/nature12654. - DOI - PubMed
    1. Ko H, et al. Functional specificity of local synaptic connections in neocortical networks. Nature. 2011 doi: 10.1038/nature09880. - DOI - PMC - PubMed
    1. Li YT, Ibrahim LA, Liu BH, Zhang LI, Tao HW. Linear transformation of thalamocortical input by intracortical excitation. Nat Neurosci. 2013;16:1324–1330. doi: 10.1038/nn.3494. - DOI - PMC - PubMed
    1. Lien AD, Scanziani M. Tuned thalamic excitation is amplified by visual cortical circuits. Nat Neurosci. 2013;16:1315–1323. doi: 10.1038/nn.3488. - DOI - PMC - PubMed
    1. Wertz A, et al. Single-cell-initiated monosynaptic tracing reveals layer-specific cortical network modules. Science. 2015;349:70–74. doi: 10.1126/science.aab1687. - DOI - PubMed

Publication types