. 2016 Jun 15;7(6):700-9.
doi: 10.1021/acschemneuro.5b00277. Epub 2016 Mar 28.

Enhanced Dopamine Release by Dopamine Transport Inhibitors Described by a Restricted Diffusion Model and Fast-Scan Cyclic Voltammetry

Affiliations

Enhanced Dopamine Release by Dopamine Transport Inhibitors Described by a Restricted Diffusion Model and Fast-Scan Cyclic Voltammetry

Alexander F Hoffman et al. ACS Chem Neurosci. .

Abstract

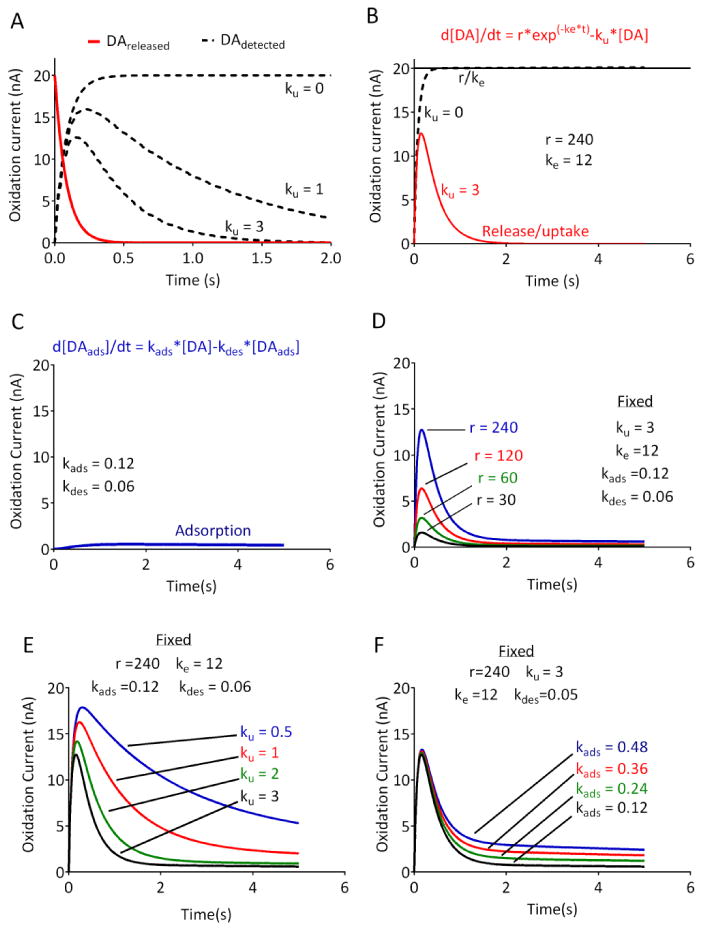
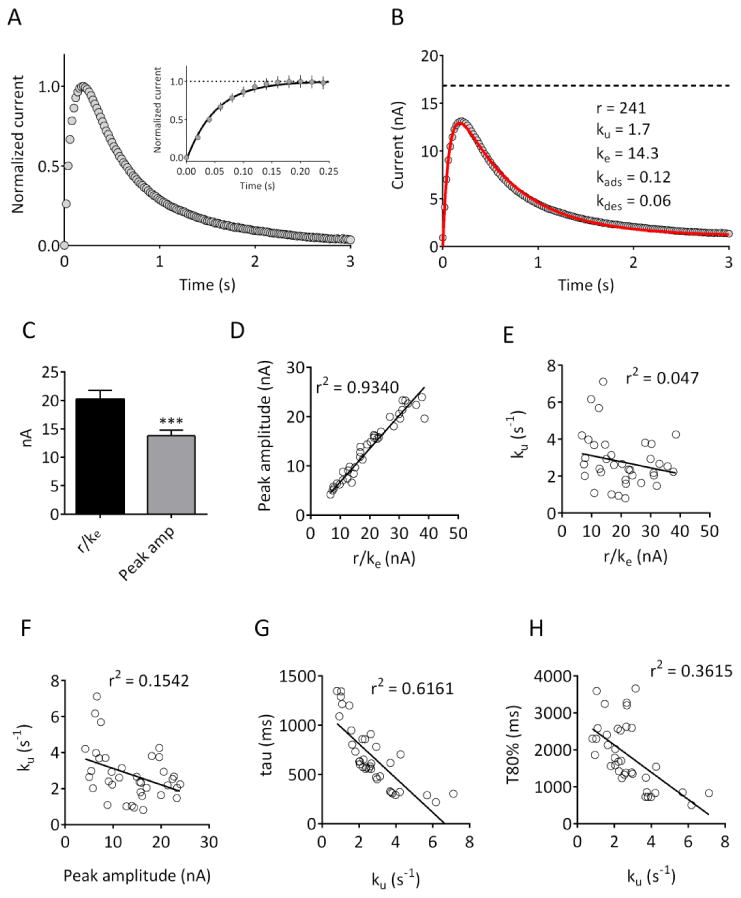
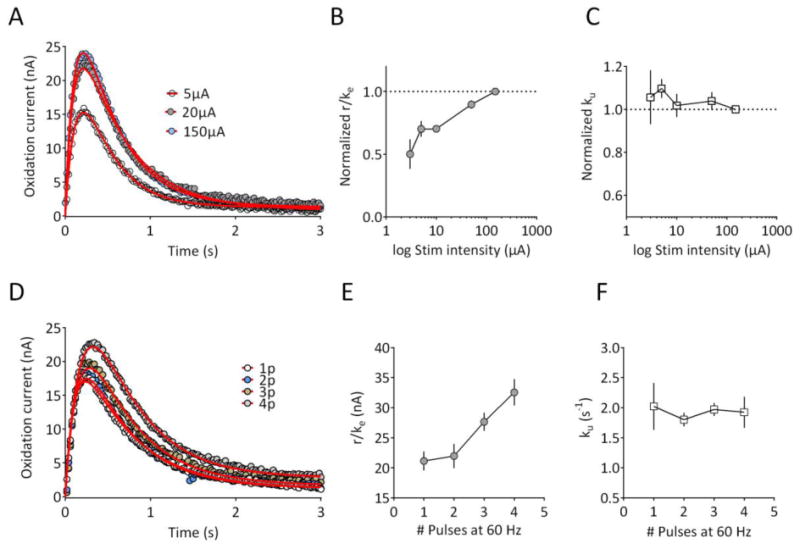
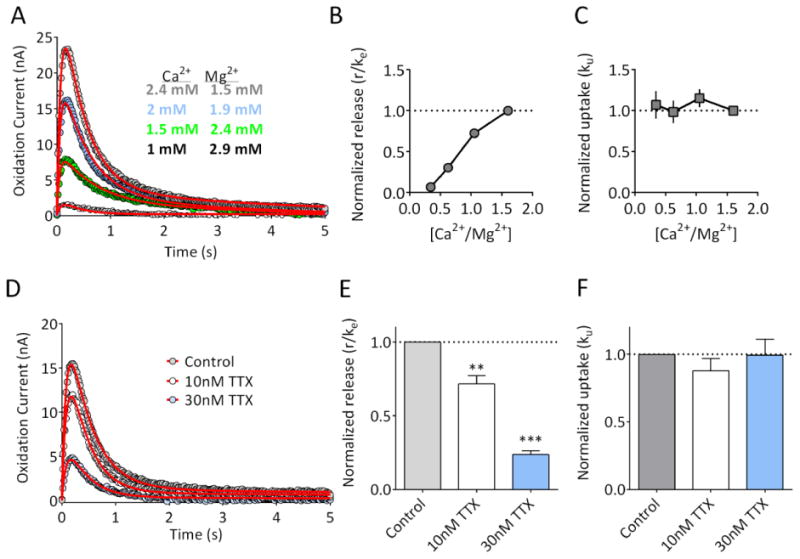
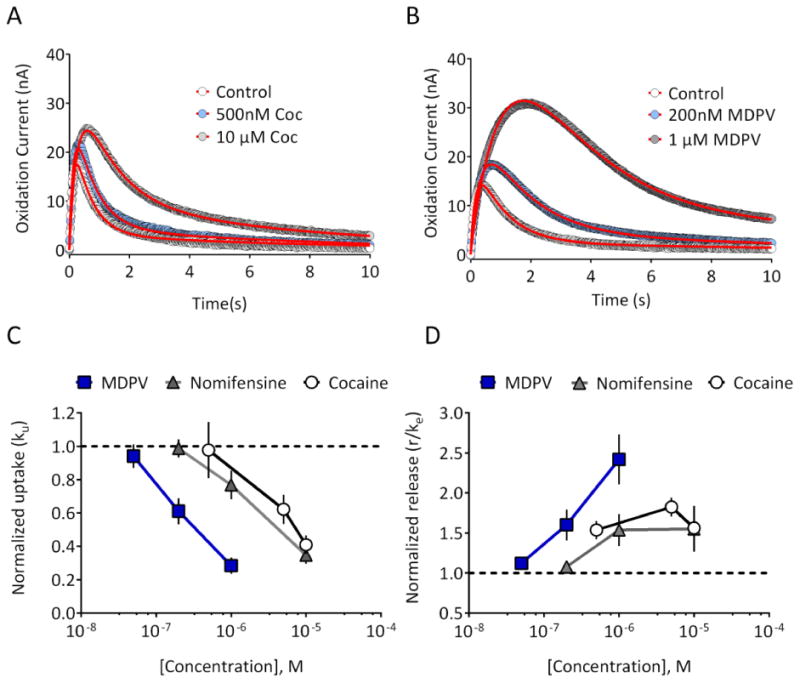
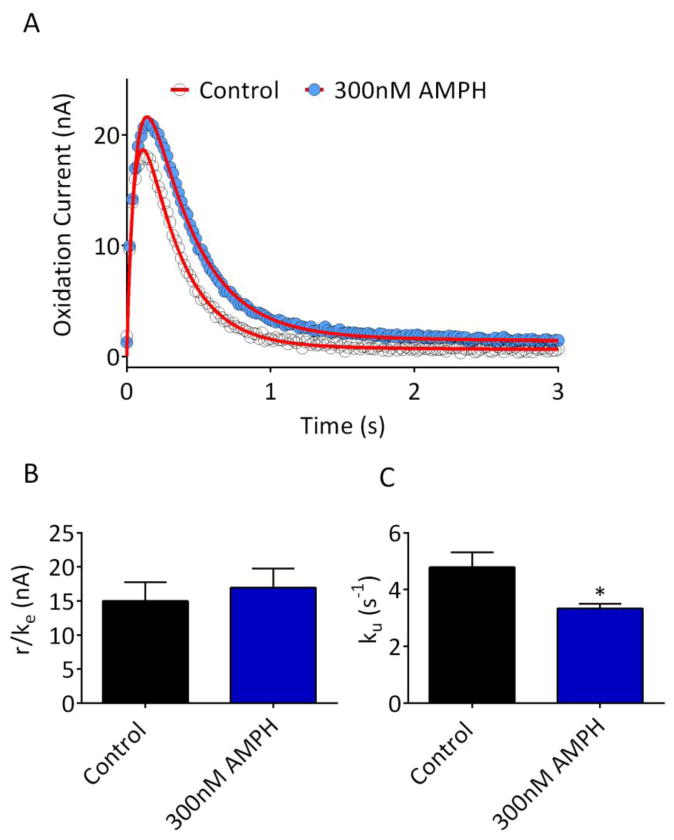
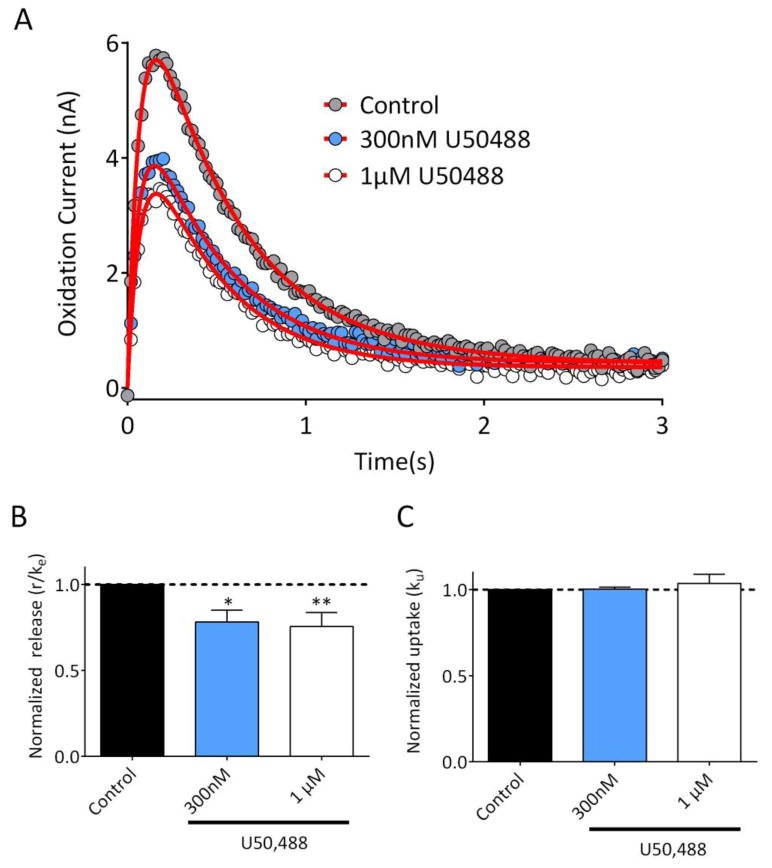
Fast-scan cyclic voltammetry (FSCV) using carbon fiber electrodes is widely used to rapidly monitor changes in dopamine (DA) levels in vitro and in vivo. Current analytical approaches utilize parameters such as peak oxidation current amplitude and decay times to estimate release and uptake processes, respectively. However, peak amplitude changes are often observed with uptake inhibitors, thereby confounding the interpretation of these parameters. To overcome this limitation, we demonstrate that a simple five-parameter, two-compartment model mathematically describes DA signals as a balance of release (r/ke) and uptake (ku), summed with adsorption (kads and kdes) of DA to the carbon electrode surface. Using nonlinear regression, we demonstrate that our model precisely describes measured DA signals obtained in brain slice recordings. The parameters extracted from these curves were then validated using pharmacological manipulations that selectively alter vesicular release or DA transporter (DAT)-mediated uptake. Manipulation of DA release through altering the Ca(2+)/Mg(2+) ratio or adding tetrodotoxin reduced the release parameter with no effect on the uptake parameter. DAT inhibitors methylenedioxypyrovalerone, cocaine, and nomifensine significantly reduced uptake and increased vesicular DA release. In contrast, a low concentration of amphetamine reduced uptake but had no effect on DA release. Finally, the kappa opioid receptor agonist U50,488 significantly reduced vesicular DA release but had no effect on uptake. Together, these data demonstrate a novel analytical approach to distinguish the effects of manipulations on DA release or uptake that can be used to interpret FSCV data.

Keywords: Voltammetry; brain slice; cathinones; dopamine transporter; drug abuse; kinetics.


Figures

Figure 1
Figure 1. DA release and uptake modeled with 5 parameters
(A) The kinetic scheme underlying the model. Red line indicates the DA released into the tissue, and dashed lines indicate the DA detected at the carbon fiber electrode. As described in the text, the transfer of DA from the inner compartment is mirrored by its appearance in the outer compartment. In the absence of any uptake (ku = 0), the asymptotic portion of the curve for DA detection will reflect the initial DA released at time 0. Increasing uptake will reduce the peak amplitude of the signal, and force the signal away from the asymptote. (B) The mathematical representation of the kinetic model (see Methods). Solid line shows the release term r/ke, which represents the maximal release in the absence of any uptake (e.g., ku = 0, dashed line). Note the difference between r/ke and the peak amplitude of the signal when uptake is present (red trace). (C) The equation modeling DA adsorption to the electrode. (D-F) Simulated DA current vs. time profile, which reflects the sum of the curves using the parameters and equations from (B) and (C). Curves were modeled by using fixed parameters as indicated and varying r, ku, or kads, respectively. Note the distinct changes in the shapes of the curves produced by the changes in each parameter. Parameters were chosen based on typical values obtained in brain slices.
Figure 2
Figure 2. Fitting of the model to DA signals obtained in rat brain slices
(A) Averaged current responses obtained in 37 brain slices obtained from 10 rats. Peak current was normalized for each slice. In this and subsequent figures, data are aligned so that time 0 corresponds to delivery of a single, 1 ms duration constant current pulse. The inset plot shows the initial rising phase of the current on an expanded time scale. Note that the increase in current was seen in the first data point sampled following stimulation (20 ms), and reached a plateau within 150-200 ms. (B) Raw data, from the same slices, fitted (solid red line) using the model described in the text. The parameters obtained are indicated; the dashed line represents r/ke. (C) Comparison of r/ke with peak amplitude values obtained in the same slices demonstrates that peak amplitude values are significantly lower than r/ke (n = 37; p <0.001, two-tailed paired t-test). (D)-(E) r/ke is strongly correlated with peak amplitude (p<0.0001) but is not correlated with the uptake parameter ku (p =0.1983). (F) Peak amplitude is significantly correlated with ku (p = 0.02). (G)-(H) Correlation of the uptake parameter ku with the decay time constant (tau; p <0.0001) and 80% decay time (T80%; p<0.0001) of the obtained signals.
Figure 3
Figure 3. Effect of varying stimulation intensity and number of stimulus pulses on release and uptake parameters
(A) Recording from a striatal slice using single pulse stimulation (1 ms) delivered at 5, 20, and 150μA. Data represent the mean of 3 signals obtained under each condition, and are plotted with circles. The fitted curves from which parameters were extracted are shown with the solid red line. (B) Normalized release parameter (r/ke) as a function of stimulus intensity for all slices (n = 12 from 3 rats). Data are normalized to the response obtained at 150μA. A repeated-measures, one way ANOVA revealed a significant effect of stimulus intensity (F(11,4) = 21.17, p <0.001). (C) Normalized uptake parameter (ku) obtained in the same set of slices. No significant effect of stimulus intensity was observed (F(11,4) = 0.735, p = 0.574). (D) Recording from a striatal slice using either a single, 150μA pulse, 2 pulse, 3 pulse, or 4 pulses delivered at 60 Hz. Data represent the mean of 3 signals obtained under each condition, and are plotted with circles. The fitted curves from which parameters were extracted are shown with the solid red line. (E) Mean release parameter (r/ke) plotted as function of the number of pulses (n = 4 slices, 2 rats). A repeated-measures, one way ANOVA revealed a significant effect of pulse number (F(3,3) = 15.33, p <0.001) on the release parameter. (F) Mean uptake parameter in the same group of slices. No significant effect of pulse number on the uptake parameter was observed (F(3,3) = 0.381, p =0.770). Parameter values for the fitted curves are provided in Supplementary Information.
Figure 4
Figure 4. Effect of Ca2+/Mg2+ and tetrodotoxin on DA release and uptake parameters
(A) Representative recording from a striatal brain slice, demonstrating the reduction in the response produced by lowering extracellular Ca2+ while raising Mg2+ in order to maintain divalent cation concentrations. Data represent the mean of 3 signals obtained under each condition, and are plotted with circles. The fitted curves from which parameters were extracted are shown with red lines. (B) Release parameter (r/ke) as a function of Ca2+/Mg2+ ratio (n = 5 slices from 2 rats). Release was significantly reduced by lowering Ca2+ and raising Mg2+ (RM-ANOVA, F(3,12) = 83.24, p<0.001). (C) The uptake parameter, ku, was not significantly affected by altering the Ca2+/Mg 2+ ratio (RM-ANOVA, F (3, 12) = 1.903, p =0.1830). (D) Representative recording from a striatal brain slice, demonstrating the reduction in the response produced by 10nM and 30 nM TTX. Data represent the mean of 3 signals obtained under each condition, and are plotted with circles. The fitted curves are shown with the red lines. (E) Summary of the effects of TTX on the release parameter (r/ke; n = 5 slices from 2 rats). Release was significantly reduced by TTX in a concentration-dependent manner (RM-ANOVA, F(2,8) = 176, p<0.001; **p<0.01, **p<0.001 vs. control, Dunnett's post-hoc). (F) The uptake parameter ku was not significantly affected by TTX application (RM-ANOVA, F (2, 8) = 0.6935, p =0.5276). Parameter values for the fitted curves are provided in Supplementary Information.
Figure 5
Figure 5. Inhibition of uptake and enhancement of vesicular DA release by DAT inhibitors
(A) Representative recording from a striatal brain slice, demonstrating the effects of 500nM and 10 μM cocaine. Data represent the mean of 3 signals obtained under each condition, and are plotted with circles. The fitted curves are shown with the red line. (B) Effects of MDPV (200 nM and 1 μM) on signals obtained in a different striatal slice. (C) Normalized uptake parameter, ku, was reduced in a concentration-dependent manner by MDPV (n = 7 slices from 2 rats), cocaine (n = 8 slices from 3 rats), and nomifensine (n = 7 slices from 2 rats). (D) The release parameter was increased in a concentration-dependent manner by MDPV, cocaine, and nomifensine. Parameter values for the fitted curves are provided in Supplementary Information.
Figure 6
Figure 6. Effect of amphetamine on modeled parameters
(A) Representative recording from a striatal brain slice, prior to (Control) and following bath application of 300nM amphetamine (AMPH). Data represent the mean of 3 signals obtained under each condition, and are plotted with circles. The fitted curves are shown with the red line. (B) Release parameter, r/ke, for all slices tested with AMPH (n = 9). No significant difference in release was observed (p = 0.07 vs. control, paired two-tailed t-test). (C) The uptake parameter (ku) was significantly reduced by 300nM AMPH (*p = 0.017 vs. control, paired two-tailed t-test). Parameter values for the fitted curves are provided in Supplementary Information.
Figure 7
Figure 7. Inhibition of striatal DA release by the kappa opioid receptor
(A) Representative recording from a striatal brain slice, demonstrating the effects of 300nM and 1 μM U50,488. Data represent the mean of 3 signals obtained under each condition, and are plotted with circles. The fitted curves are shown with the red line. (B) Summary of the release parameter, r/ke (n = 6 slices, 2 rats). U50,488 significantly reduced release at both 300nM and 1 μM (RM-ANOVA, F(2,10) = 9.42, p = 0.005; **p <0.05, ***p<0.01 vs. control, Dunnett's post hoc) . (C) The normalized uptake parameter, ku, was not significantly affected by U50,488 (RM-ANOVA, F (2, 10) = 0.5017, p = 0.620). Parameter values for the fitted curves are provided in Supplementary Information.

References

    1. Keithley RB, Takmakov P, Bucher ES, Belle AM, Owesson-White CA, Park J, Wightman RM. Higher sensitivity dopamine measurements with faster-scan cyclic voltammetry. Anal Chem. 2011;83:3563–3571. - PMC - PubMed
    1. Kile BM, Walsh PL, McElligott ZA, Bucher ES, Guillot TS, Salahpour A, Caron MG, Wightman RM. Optimizing the Temporal Resolution of Fast-Scan Cyclic Voltammetry. ACS Chem Neurosci. 2012;3:285–292. - PMC - PubMed
    1. Wightman RM, Zimmerman JB. Control of dopamine extracellular concentration in rat striatum by impulse flow and uptake. Brain Res Brain Res Rev. 1990;15:135–144. - PubMed
    1. Jones SR, Garris PA, Kilts CD, Wightman RM. Comparison of dopamine uptake in the basolateral amygdaloid nucleus, caudate-putamen, and nucleus accumbens of the rat. J Neurochem. 1995;64:2581–2589. - PubMed
    1. Wu Q, Reith ME, Wightman RM, Kawagoe KT, Garris PA. Determination of release and uptake parameters from electrically evoked dopamine dynamics measured by real-time voltammetry. J Neurosci Methods. 2001;112:119–133. - PubMed

MeSH terms

LinkOut - more resources