. 2016 Apr;41(7):610-7.
doi: 10.1097/BRS.0000000000001275.

Cost Effectiveness of Operative Versus Non-Operative Treatment of Geriatric Type-II Odontoid Fracture

Affiliations

Cost Effectiveness of Operative Versus Non-Operative Treatment of Geriatric Type-II Odontoid Fracture

Daniel R Barlow et al. Spine (Phila Pa 1976). 2016 Apr.

Abstract

Study design: Cost-effectiveness analysis.

Objective: To examine the cost-effectiveness of operative versus non-operative treatment of type-II odontoid fractures in patients older than 64 years old.

Summary of background data: Significant controversy exists regarding the optimum treatment of geriatric patients with type-II odontoid fractures. Operative treatment leads to lower rates of non-union but carries surgical risks. Non-operative treatment does not carry surgical risks but has higher non-union rates.

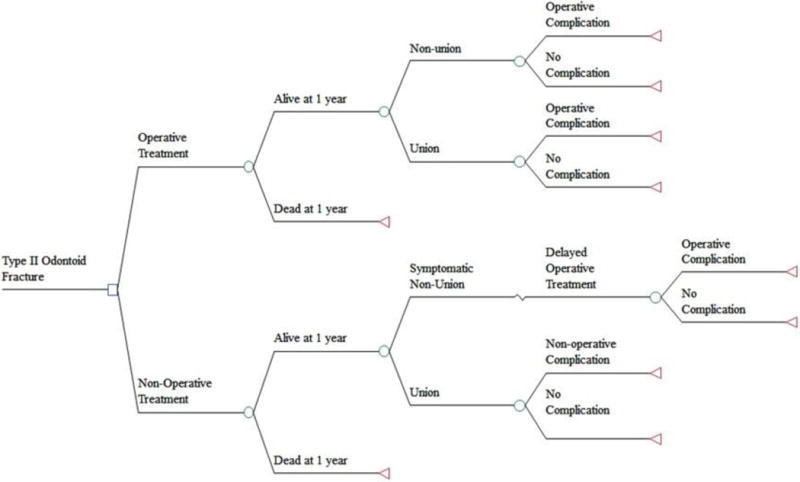
Methods: A decision-analytic model was created to compare operative and non-operative treatment of type-II odontoid fractures among three age cohorts (65-74, 75-84, >84) based on expected costs, quality-adjusted life years (QALYs) and incremental cost-effectiveness ratios (ICERs; cost per QALY gained). Age-specific mortality rates for both treatments, costs for treatment, and complication rates were taken from the literature, and data from 2010 US life tables were used for age-specific life expectancy. Costs of complications were estimated using data obtained at a level-I trauma center using micro-costing. Sensitivity analyses of all model parameters were conducted.

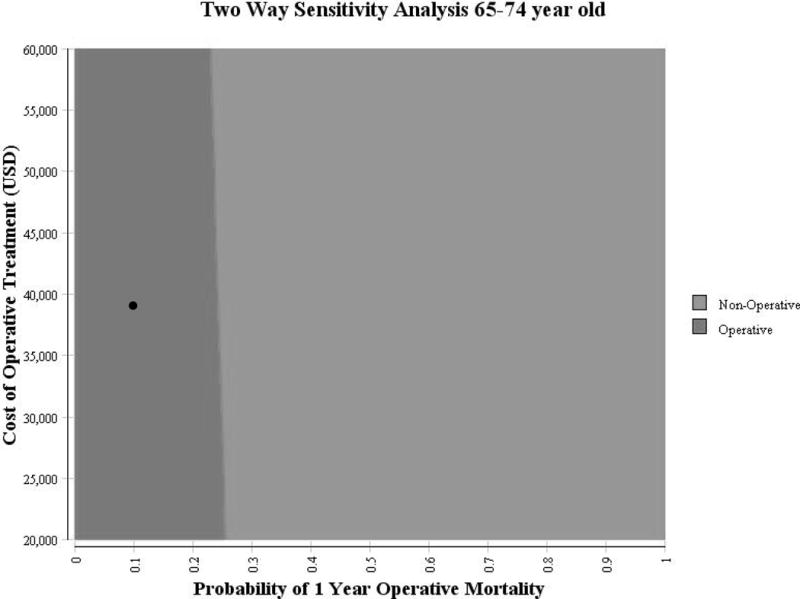
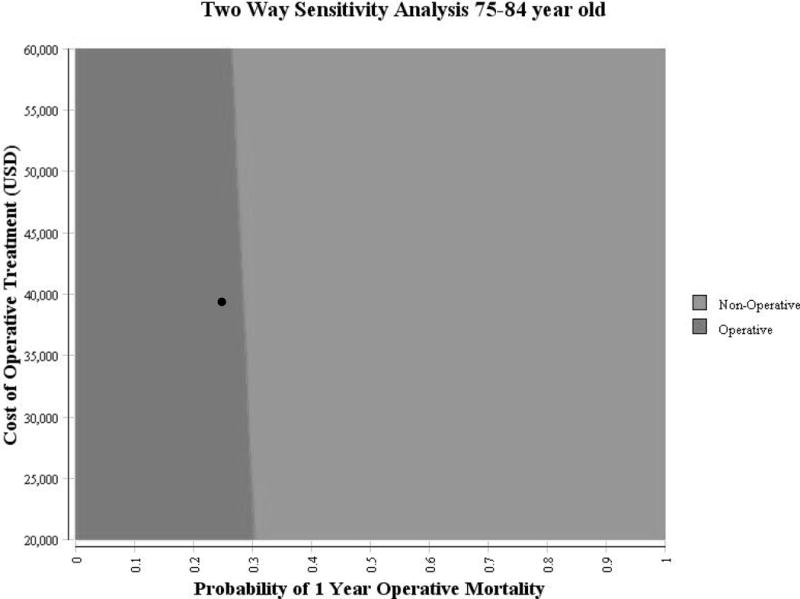
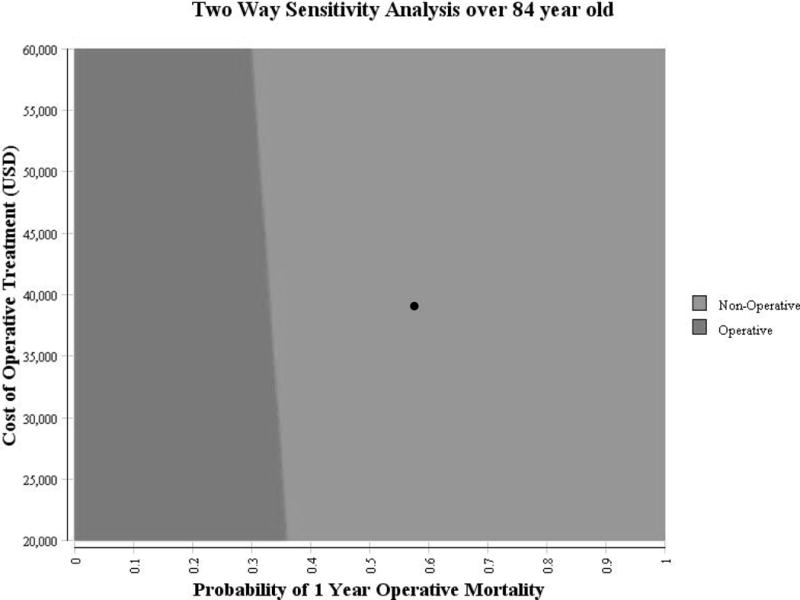
Results: Among the 65- to 74-year-old cohort, operative treatment was more costly ($53,407 vs. $30,553) and more effective (12.00 vs. 10.11 QALY), with an ICER of $12,078/QALY. Among the 75- to 84-year-old cohort, operative treatment was more costly ($51,308 vs. $29,789) and more effective (6.85 vs. 6.31 QALY), with an ICER of $40,467/QALY. Among the over-84 cohort, operative treatment was dominated by non-operative treatment as it was both more costly ($45,978 vs. $28,872) and less effective (2.48 vs. 3.73 QALY). The model was robust to sensitivity analysis across reasonable ranges for utility of union, disutility of complications and delayed surgery, and probabilities of non-union and complications.

Conclusion: Operative treatment is cost-effective in patients age 65 to 84 when using $100,000/QALY as a benchmark but less effective and more costly than non-operative treatment in patients older than 84 years.

Level of evidence: 2.


Figures

Figure 1
Figure 1
Model showing decision choice and possible complications and outcomes following a geriatric type-II odontoid fracture.
Figure 2
Figure 2
a: Sensitivity analysis on operative mortality and operative cost in 65–74 year old cohort Two-way sensitivity analysis for probability of 1-year mortality in operative group (x-axis) vs. the cost of operative treatment (y-axis). The boundary between the dark and light region indicates an ICER of $100,000 with the light region favoring non-operative treatment, and the dark region favoring operative treatment. The black circle indicates the base case for the 65–74 year old cohort b: Sensitivity analysis on operative mortality and operative cost in 75–84 year old cohort Two-way sensitivity analysis for probability of 1-year mortality in operative group (x-axis) vs. the cost of operative treatment (y-axis). The boundary between the dark and light region indicates an ICER of $100,000 with the light region favoring non-operative treatment, and the dark region favoring operative treatment. The black circle indicates the base case for the 75–84 year old cohort c: Sensitivity analysis on operative mortality and operative cost in over 84 year old cohort Two-way sensitivity analysis for probability of 1-year mortality in operative group (x-axis) vs. the cost of operative treatment (y-axis). The boundary between the dark and light region indicates an ICER of $100,000 with the light region favoring non-operative treatment, and the dark region favoring operative treatment. The black circle indicates the base case for the >84 year old cohort
Figure 2
Figure 2
a: Sensitivity analysis on operative mortality and operative cost in 65–74 year old cohort Two-way sensitivity analysis for probability of 1-year mortality in operative group (x-axis) vs. the cost of operative treatment (y-axis). The boundary between the dark and light region indicates an ICER of $100,000 with the light region favoring non-operative treatment, and the dark region favoring operative treatment. The black circle indicates the base case for the 65–74 year old cohort b: Sensitivity analysis on operative mortality and operative cost in 75–84 year old cohort Two-way sensitivity analysis for probability of 1-year mortality in operative group (x-axis) vs. the cost of operative treatment (y-axis). The boundary between the dark and light region indicates an ICER of $100,000 with the light region favoring non-operative treatment, and the dark region favoring operative treatment. The black circle indicates the base case for the 75–84 year old cohort c: Sensitivity analysis on operative mortality and operative cost in over 84 year old cohort Two-way sensitivity analysis for probability of 1-year mortality in operative group (x-axis) vs. the cost of operative treatment (y-axis). The boundary between the dark and light region indicates an ICER of $100,000 with the light region favoring non-operative treatment, and the dark region favoring operative treatment. The black circle indicates the base case for the >84 year old cohort

References

    1. Ryan MD, Henderson JJ. The epidemiology of fractures and fracture-dislocations of the cervical spine. Injury. 1992;23:38–40. - PubMed
    1. Greene KA, Dickman CA, Marciano FF, et al. Acute axis fractures. Analysis of management and outcome in 340 consecutive cases. Spine. 1997;22:1843–52. - PubMed
    1. Zusman NL, Ching AC, Hart RA, et al. Incidence of second cervical vertebral fractures far surpassed the rate predicted by the changing age distribution and growth among elderly persons in the United States (2005–2008) Spine. 2013;38:752–6. - PubMed
    1. Smith HE, Kerr SM, Fehlings MG, et al. Trends in epidemiology and management of type II odontoid fractures: 20-year experience at a model system spine injury tertiary referral center. Journal of spinal disorders & techniques. 2010;23:501–5. - PubMed
    1. Daniels AH, Arthur M, Esmende SM, et al. Incidence and cost of treating axis fractures in the United States from 2000 to 2010. Spine. 2014;39:1498–505. - PubMed

Publication types