. 2016 May;19(5):734-741.
doi: 10.1038/nn.4274. Epub 2016 Mar 28.

Agouti-related peptide neural circuits mediate adaptive behaviors in the starved state

Affiliations

Agouti-related peptide neural circuits mediate adaptive behaviors in the starved state

Stephanie L Padilla et al. Nat Neurosci. 2016 May.

Abstract

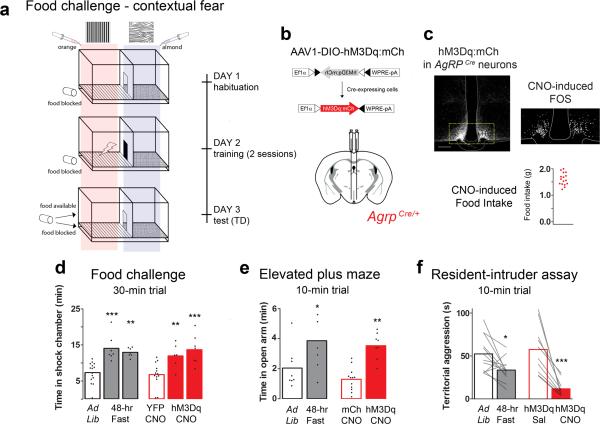
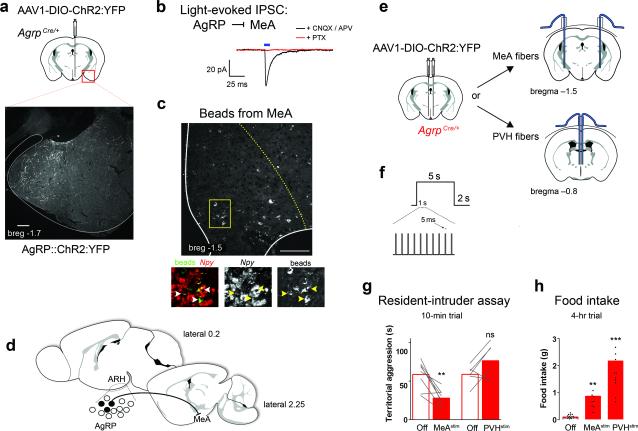
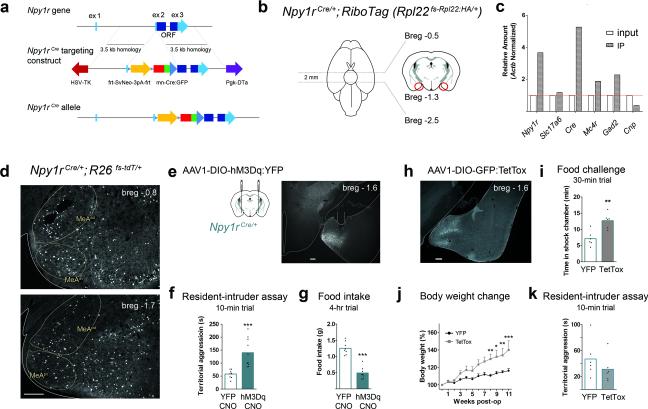
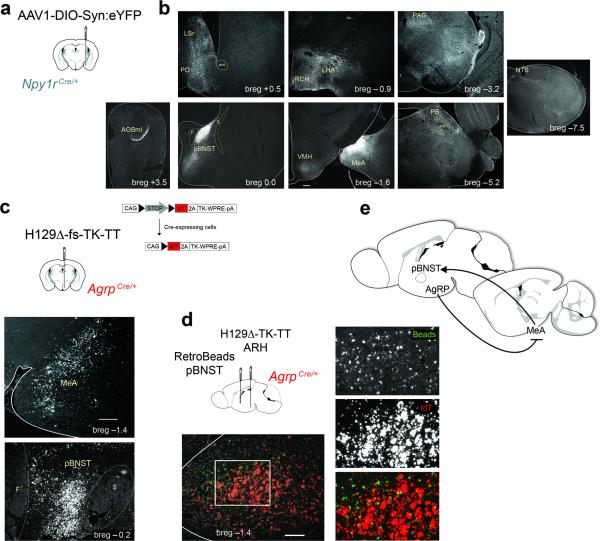
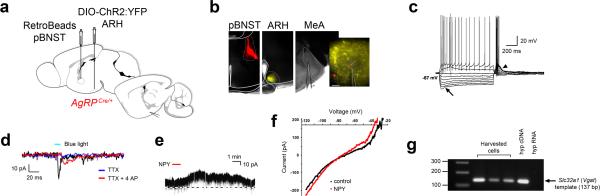
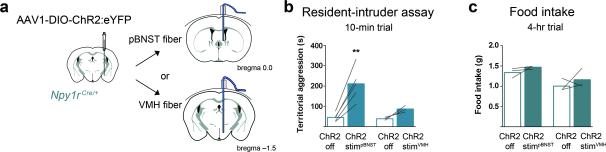
In the face of starvation, animals will engage in high-risk behaviors that would normally be considered maladaptive. Starving rodents, for example, will forage in areas that are more susceptible to predators and will also modulate aggressive behavior within a territory of limited or depleted nutrients. The neural basis of these adaptive behaviors likely involves circuits that link innate feeding, aggression and fear. Hypothalamic agouti-related peptide (AgRP)-expressing neurons are critically important for driving feeding and project axons to brain regions implicated in aggression and fear. Using circuit-mapping techniques in mice, we define a disynaptic network originating from a subset of AgRP neurons that project to the medial nucleus of the amygdala and then to the principal bed nucleus of the stria terminalis, which suppresses territorial aggression and reduces contextual fear. We propose that AgRP neurons serve as a master switch capable of coordinating behavioral decisions relative to internal state and environmental cues.


Figures

Figure 1
Figure 1
AgRP stimulation recapitulates fasting-related foraging and reduced territorialism. (a) Schematic diagram of the Pavlovian food-challenge assay used to assess risk taking. (b) Viral construct: AAV1-DIO-hM3Dq:mCh, and diagram of the stereotaxic injection site in AgrpCre mice. (c) Viral expression of hM3Dq:mCh in AgRP neurons in conjunction with CNO-induced Fos immunoreactivity; scale bar, 100 μm. Animals included in the study (red dots) consumed >1.0 g of food 4 hr post CNO (1 mg/kg IP). Note, four animals consumed <1.0 g of food in this test and were excluded from the study. (d) Postconditioning (TD) quantification of time spent in the shock-associated chamber, compared using a 1-way ANOVA with Bonferroni's multiple comparison tests. Experimental and control animals were evaluated with either the food available, or blocked on test day. There was no difference between controls under these conditions, and they are plotted together. The experimental animals are separated by either condition: food available (left) and food blocked trial (right). (e) Time spent in the open arms of a plus maze, compared using a 1-way ANOVA with Bonferroni's multiple comparison tests. (f) Paired two-tailed Student's t-test analysis of home-cage aggressive behavior. (d-f) Bar outlines indicate mouse genotype: red indicates AgrpCre, while black indicates C57BL/6. The condition or treatments of the animals are indicated below the x-axis. (d,e) Conducted during the light cycle (5:00 – 17:00), (f) Conducted in the dark (17:00 – 19:00). See methods for detailed statistics.
Figure 2
Figure 2
MeA-projecting AgRP neurons evoke hunger and inhibit territorial aggression. (a) ChR2:YFP-expressing AgRP fibers observed in the MeA. Scale bar, 200 μm. (b) Whole-cell, patch clamp recordings (voltage-clamp, -70 mV) of MeA cells in proximity to AgRP::ChR2-expressing fibers. Light-evoked responses were measured with 10-ms light pulse (472 nm, 10 mW power at the tip) in the presence of CNQX and AP5 (black trace), followed by picrotoxin (red trace). Cells were recorded from three ChR2-transduced animals (tissue from the fourth animal was excluded due to lack of fluorescent reporter expression in the targeted AgRP population). (c) Green fluorescent RetroBeads injected into MeA were retained in 7.1 ± 0.6 % of Npy-expressing ARH cells; indicated by arrows. Scale bar, 100 μm. (d) Schematic demonstrating that a subset of AgRP neurons (black filled) project to the MeA. (e) Bilateral injection of AAV1-DIO-ChR2:YFP into the ARH with duel fiber optic cannulas implanted above either the MeA or PVH. (f) Stimulation paradigm for behavioral studies: 10 Hz with 5-ms pulses that continue for 5 s followed by 2 s light-off recovery. (g) Paired two-tailed Student's t-test analysis of home-cage aggressive behavior, comparing light on versus light off conditions; conducted during the first 2 hr of the dark cycle (17:00 – 19:00). (h) Cumulative food intake measured during the light cycle (10:00 – 14:00) compared using a 1-way ANOVA with Bonferroni's multiple comparison tests. See methods for detailed statistics.
Figure 3
Figure 3
Npy1R neurons in the MeA can evoke aggression and inhibit feeding. (a) Npy1rCre:GFP knock-in targeting construct (diagram not to scale; see methods for complete details). (b) RiboTag mice contain a cre-dependent epitope-taged polyribosome gene. MeA tissue was harvested (red circles) from Npy1rCre; RiboTag mice. (c) Comparison of precipitated transcripts versus input sample, demonstrated enrichment of Npy1r and Cre transcripts along with Gad2 and Mc4r. (d) Npy1R expression in the anterior-dorsal (AD) and anterior-ventral (AV) MeA; lower, posterior-dorsal (PD) and posterior-ventral (PV) MeA; three animals were evaluated demonstrating a similar expression pattern. Scale bar, 200 μm. (e) Bilateral injection of AAV1-DIO-hM3Dq:YFP into the MeA of Npy1rCre mice; histology demonstrating the injection site and Cre-dependent YFP fluorescence. Note, two animals were excluded from the study following histological analysis due to lack of reporter expression. Scale bar, 200 μm. (f) Stimulation of Npy1RMeA cells of resident animals evokes aggressive behavior (assessed during between 17:00 – 19:00) and (g) decreased food consumption during the dark cycle (17:00 – 21:00); compared using unpaired two-tailed Student's t-tests. (h) Bilateral injection of AAV1-DIO-GFP:TetTox into the MeA of Npy1rCre mice with histology to demonstrate the injection site. (i - k) Npy1RMeA neuron silencing resulted decreased threat avoidance behavior, compared using an unpaired two-tailed Student's t-test (i), and increased body weight, compared using a 2-way repeated measures ANOVA (j). (k) We did not observe a difference in home-cage aggression in Npy1RMeA silenced animals; compared using an unpaired two-tailed Student's t-test. (k). Conditioned avoidance, i, was measured by time spent in the shock-associated side on test day (detailed in Fig. 1a). See methods for detailed statistics.
Figure 4
Figure 4
The posterior BNST is a secondary target of AgRP and receives direct input from Npy1RMeA neurons. (a) Injection of AAV1-DIO-Synaptophysin:YFP into the MeA of Npy1rCre mice. (b) Immuno-reactive YFP fibers in the: AOBmi (accessory olfactory bulb, mitral layer), LSr (lateral septal nucleus, rostroventral part), PO (preoptic area), pBNST (bed nucleus of the stria terminalis, posterior division, principle nucleus), RCH (retrochiasmatic area), LHA (lateral hypothalamic area), VMH (ventromedial hypothalamus), MeA (medial amygdala), PAG (periaqueductal gray), PB (parabrachial nucleus), NTS (nucleus of the solitary tract). This finding was similarly observed in 3 animals with properly targeted viral injections. All images were scaled equally; scale bar, 200 μm (see breg –1.3). (c) AgRP neurons relay information to the pBNST and MeA. The trans-synaptic virus, H129Δ-fs-TK-TT, was injected into the ARH of AgrpCre mice (top panel). Immunoreactive DsRed cells were present in the MeA (middle panel) and pBNST (bottom panel). Scale bar, 200 μm. (d) The MeA relays signals from AgRP neurons to the pBNST. Diagram shows co-injection of green RetroBeads into the pBNST and H129Δ-fs-TK-TT into the ARH of AgrpCre mice. DsRed immune-reactive cell bodies and retrobead-positive cells are present in the MeA. Scale bar, 100 μm. Two animals were evaluated with proper targeting of both the ARH and pBNST demonstrating a similar expression profile in the MeA. (e) Model of the AgRP → MeA circuit.
Figure 5
Figure 5
Identification of Vgat-expressing NPY-responsive cells in the MeA that received direct input from AgRP neurons and project to the pBNST. (a) Sagittal diagram of injection and recording sites. (b) Coronal sections confirming targeted injections of RetroBeads into the pBNST (left) and DIO-ChR2:YFP into the ARH (center). Recordings were performed on bead-labeled cells in the MeA (right); zoom image (right) represents a red cell in proximity to YFP fibers. Note, three of eight animals injected with both beads and ChR2 contained the correct ipsilateral targeting of both the ARH and pBNST. Scale bar, 50 μm. (c) Voltage response to current step injections. The majority of bead-positive neurons exhibited a prominent hyperpolarization-activated voltage sag (h-current; n = 10 cells; arrow) and a low threshold potential (a T type calcium current, n = 7 cells; arrow head). (d) Light-responsive, bead-positive cells in the MeA (n = 3 cells); blue light-evoked fast IPSP (black trace) was abolished in the presence of TTX (blue trace), and rescued with the addition of the K+ channel blocker 4-AP (red trace). (e) Bead-positive neurons that displayed an outward current in response to bath application of NPY (1 μM; red line) (14.5 ± 4.5 pA; n = 4 cells from 4 sections across 3 animals with proper targeting of the retrograde label) when held at –60 mV (note, gaps in the trace indicate the voltage ramp interval in f). (f) IV relationship during a voltage ramp performed on bead-positive, light-responsive cells, before (black) and after (red) NPY application. (g) PCR detection of Slc32a1 (Vgat) cDNA in cell lysates harvested from recorded cells. Reverse-transcribed cDNA from the hypothalamus was used as a positive control, while hypothalamic RNA was tested as the negative control, all light-responsive and bead-positive cells were harvested for post-hoc analysis.
Figure 6
Figure 6
Npy1RMeA neurons that project to the pBNST evoke territorialism. (a) Unilateral injection of AAV-DIO-ChR2:YFP into the MeA of Npy1rCre mice, with ipsilateral optic cannulas implanted above the pBNST or the VMH. (b) Stimulation of NpyRMeA fibers over pBNST increased aggression in a home-cage intruder assay (left panel), while stimulation of fibers over VMH does not (right panel); assessed during the dark cycle (17:00 – 19:00) and compared using paired two-tailed Student's t-tests. (c) Neither VMH nor pBNST-projecting Npy1RMeA cells decreased feeding (recorded from 17:00 – 21:00); compared using paired two-tailed Student's t-tests. Stimulation paradigm (472 nm, 10 mW power at the tip): 10 Hz with 5-ms pulses that continue for 5 s followed by 2 s light-off recovery. See methods for detailed statistics.

References

    1. Sih A. Optimal Behavior - Can Foragers Balance 2 Conflicting Demands. Science. 1980;210:1041–1043. - PubMed
    1. Krebs JR. Optimal Foraging, Predation Risk and Territory Defense. Ardea. 1980;68:83–90.
    1. Brown JL. Citation Classic - the Evolution of Diversity in Avian Territorial Systems. Cc/Agr Biol Environ. 1981:16–16.
    1. Anderson PK. Foraging Range in Mice and Voles - the Role of Risk. Can J Zool. 1986;64:2645–2653.
    1. Magnhagen C. Predation Risk and Foraging in Juvenile Pink (Oncorhynchus-Gorbuscha) and Chum Salmon (O-Keta). Can J Fish Aquat Sci. 1988;45:592–596.

Publication types

MeSH terms

Substances

LinkOut - more resources