. 2016 May;22(5):479-87.
doi: 10.1038/nm.4066. Epub 2016 Mar 28.

Spinal cord reconstitution with homologous neural grafts enables robust corticospinal regeneration

Affiliations

Spinal cord reconstitution with homologous neural grafts enables robust corticospinal regeneration

Ken Kadoya et al. Nat Med. 2016 May.

Abstract

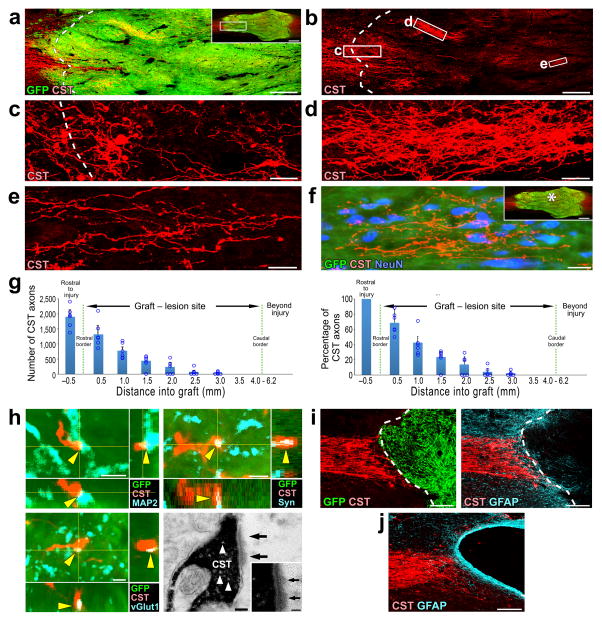
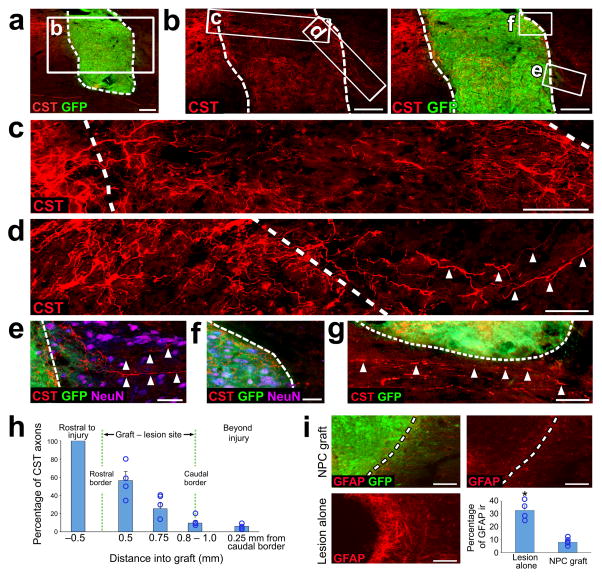
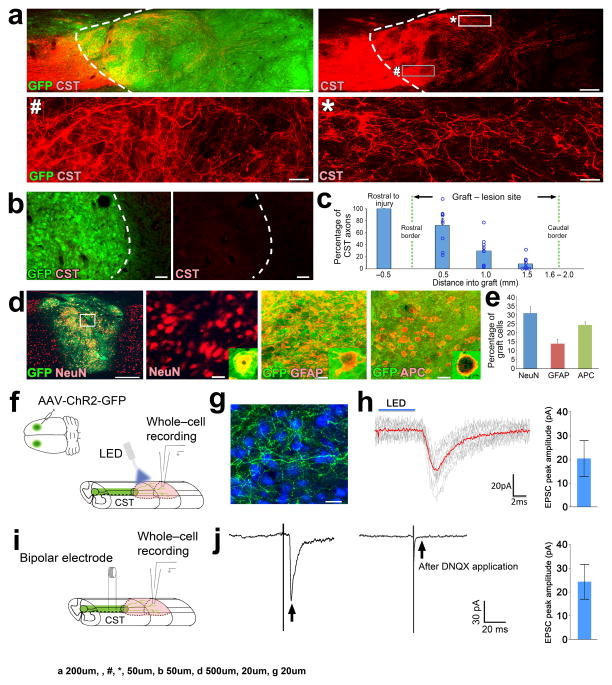
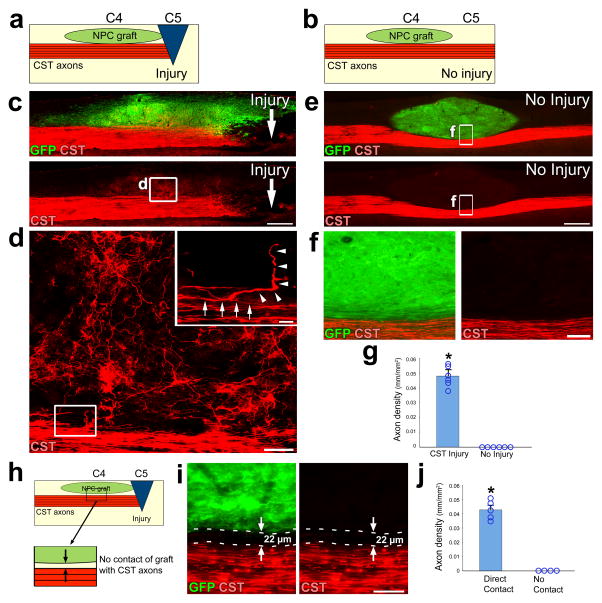
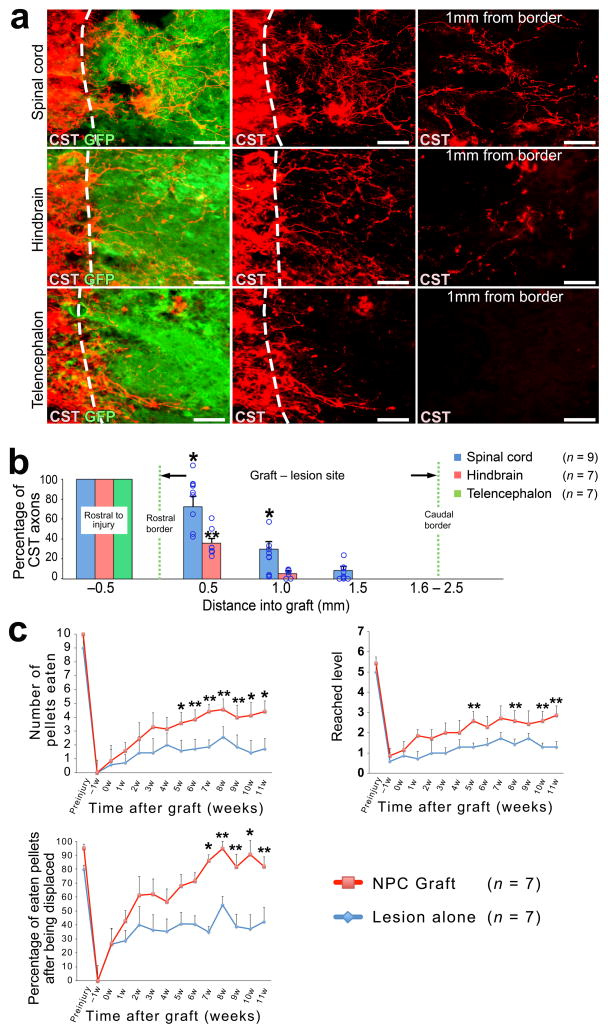
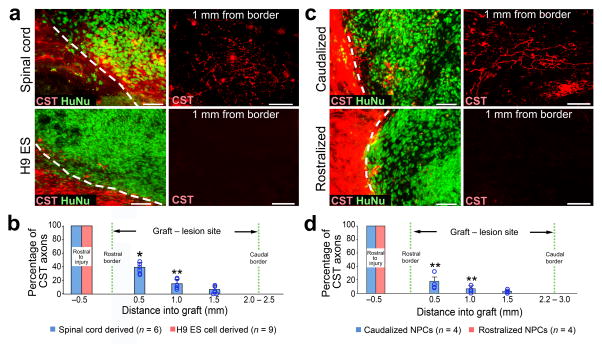
The corticospinal tract (CST) is the most important motor system in humans, yet robust regeneration of this projection after spinal cord injury (SCI) has not been accomplished. In murine models of SCI, we report robust corticospinal axon regeneration, functional synapse formation and improved skilled forelimb function after grafting multipotent neural progenitor cells into sites of SCI. Corticospinal regeneration requires grafts to be driven toward caudalized (spinal cord), rather than rostralized, fates. Fully mature caudalized neural grafts also support corticospinal regeneration. Moreover, corticospinal axons can emerge from neural grafts and regenerate beyond the lesion, a process that is potentially related to the attenuation of the glial scar. Rat corticospinal axons also regenerate into human donor grafts of caudal spinal cord identity. Collectively, these findings indicate that spinal cord 'replacement' with homologous neural stem cells enables robust regeneration of the corticospinal projection within and beyond spinal cord lesion sites, achieving a major unmet goal of SCI research and offering new possibilities for clinical translation.


Conflict of interest statement

The authors declare that they have no competing financial interests.

Figures

Figure 1
Figure 1. Corticospinal axons extensively regenerate into NPC grafts
(ab) Rostral aspect of a GFP-expressing multipotent NPC graft in the site of T3 complete spinal cord transection, shown in horizontal section. Rostral is left, caudal is right. CST axons are labeled with biotinylated dextran amine (BDA, shown in red). Inset shows overview of the graft. Scale bar, 240 μm; 1 mm (inset). (b) The CST approaches and regenerates into an NPC graft in the lesion site. Scale bar, 240 μm. (ce) Higher magnification views of boxed areas in b show the density, varicosities, and tortuosities of regenerating corticospinal axons that extend into the graft. Scale bars c, 60 μm; d, 30 μm; e, 20 μm. (f) Regenerating CST axons surround neurons in the center of the graft (* in the inset), 3mm from the rostral host–graft border. Inset shows overview of the graft. Scale bar, 20 μm; 1 mm (inset). (g) Quantification of CST axons in NPC grafts in six rats (left). Quantification of the proportion of CST axons in NPC grafts, normalized to the total number of CST axons 0.5mm rostral to the lesion site in six rats (right). Data are presented as mean ± SEM. Circles indicate data from individual rats. (h) Triple labeling for GFP, CST, and microtubule-associated protein 2 (MAP2) demonstrates a CST axon in the graft that exhibits a bouton-like swelling in close apposition to a dendrite of a grafted neuron, labeled with MAP2 (arrowheads; upper left, scale bar, 2 μm). Triple labeling for GFP, CST, and synaptophysin (Syn; upper right, scale bar, 2 μm) or vesicular glutamate transporter 1 (vGlut1; lower left, scale bar, 2 μm) in the graft indicates that the corticospinal axon in the graft is co-localized with presynaptic and excitatory synaptic markers, respectively (arrowheads). Electron microscopy image of a 3,3′-diaminobenzidine (DAB)–labeled CST axon terminal (black) forming a synapse (arrows) with a neuronal process within the graft (lower right). Arrowheads indicate presynaptic vesicles. Scale bar, 100 nm. (i) Sagittal images of GPF-expressing syngenic bone marrow stromal cell (MSC) grafts in the site of C4 spinal cord transection. Left, double labeling for CST axons (red) and GFP expressing MSCs (green); right, double labeling for CST axons and glial fibrillary acidic protein (GFAP, blue). Dashed lines indicate rostral host/graft interface. Scale bar, 200 μm. (j) Sagittal image of CST axons in a C4 CST transection lesion in the absence of any graft. Scale bar, 200 μm.
Figure 2
Figure 2. Axonal regeneration beyond the graft in focal CST lesions
(a) Low magnification sagittal overview of CST axons (red) and a rat E14 spinal cord NPC graft (green) placed at the focal CST lesion site six weeks after injury. Scale bar, 200 μm. Dashed lines indicate host/graft interface throughout. Rostral is to the left throughout. (b) High magnification views of boxed area in a. Scale bar, 200 μm. (c) High magnification view of boxed area in b including rostral host/graft interface. Scale bar, 100 μm. (d) High magnification view of boxed area in b. Arrowheads indicate CST axons extending beyond the caudal host/graft interface. Scale bar, 50 μm. (ef) High magnification views of the boxed areas in b. Arrowheads indicate CST axons penetrating host gray matter (f, NeuN-positive) but not white matter (g, NeuN-negative) caudal to the graft/lesion site. Scale bars, e, 50 μm; f, 100 μm. (g) High magnification view of the area just ventral to the graft/lesion site. Arrowheads indicate spared ventral CST axons located close to the NPC graft. Scale bar, 50 μm. (h) Quantification of the proportion of regenerating CST axons found at different locations across the rostro-caudal axis of the NPC graft (n = 4 rats). (j) Example images of GFAP immunoreactivity in the vicinity of the host/graft interface of focal CST lesioned rats after receiving (top images) or not receiving (lower left) NPC graft. Scale bars, 100 μm. Quantification of GFAP immunoreactivity at the lesion boundary (n = 4 rats lesion alone, n = 4 rats NPC graft). Throughout, error bars represent mean ± s.e.m. Circles indicate data from individual rats. *P<0.05; Wilcoxon test.
Figure 3
Figure 3. Electrophysiological connectivity between regenerating corticospinal axons and grafted neurons
(a) Sagittal views of CST axons (red) and GFP-expressing NPC grafts (green) placed in C4 CST lesions in rats six weeks after injury. Dashed lines indicate rostral host/graft border. Rostral is to the left throughout. Lower panels are high magnification views of boxed areas in upper right panel. Scale bars, 200 μm (upper panels); 50 μm (lower panels). (b) Sagittal views of the caudal graft/host interface (dashed lines) in a C4 CST lesioned rat depicting CST axons (red) and GFP-expressing NPC grafts (green). Scale bars, 50 μm. (c) Quantification of the proportion of regenerating CST axons (normalized to the total number of CST axons 0.5mm rostral to the graft/lesion site) found at different locations across the rostro-caudal axis of the NPC graft (n = 9 rats). Circles indicate data from individual rats. (d) Double immunolabeling of GFP-labeled NPC grafts (green) with neuronal (NeuN, red), astrocytic (GFAP, red) and mature oligodendrocytic (adenomatous polyposis coli, APC, red) cell type markers. Boxed region in the low magnification image on the left is shown at higher magnification immediately to the right. Scale bars, 500 μm (left); 20 μm (all panels to the right). (e) Quantification of cell type marker immunoreactivity in grafts. (f) Experimental paradigm to record optogenetically-evoked synaptic responses. AAV2 vectors expressing ChR2 and GFP were injected into motor cortices, followed by NPCs grafts into lesion cavities two weeks later. Four weeks after NPC grafts, ChR2+ CST axons were stimulated with blue light (n = 3 rats) and whole-cell recordings of grafted neurons were performed. (g) Double immunolabeling for CST axons (green) and neurons (NeuN, blue). Scale bar, 20 μm. (h) EPSCs recorded from a grafted neuron evoked with 5 ms of 470 nm light (blue line). Red trace indicates the average of individual EPSCs (gray traces). Averaged peak EPSC amplitude from three responding cells is plotted to the right (i) Experimental paradigm to record electrically-evoked synaptic responses. During whole-cell recordings of grafted neurons, CST axons were stimulated by bipolar electrodes positioned 1mm rostral to graft. (j) Example of an evoked EPSC (arrow, left) recorded from a grafted neuron. Application of the AMPAR antagonist DNQX (20μM) abolished responses (arrow, right), indicative of a glutamatergic synapse. Averaged peak EPSC amplitude from seven responding cells is plotted to the right. Error bars represent mean ± s.e.m throughout.
Figure 4
Figure 4. Corticospinal regeneration requires an injury signal and contact with neural grafts
(ab) Experimental design to determine the requirement of an injury signal to enable CST axon regeneration. NPC grafts were placed into the spinal sensory columns at C4 immediately dorsal to the CST. In injured animals (a), a spinal cord lesion was placed at C5 transecting the dorsal corticospinal projection. “No injury” animals did not receive a lesion (b). (cf) Low and high magnification views of BDA-labeled CST axons (red) with GFP-expressing NPC graft (green) in the presence of (c, d) or absence of (e, f) CST injury. Rostral is left, caudal is right. Scale bars: c, e, 500 μm; d, 50 μm; f, 100 μm. (d) High magnification views of boxed area in c depicts a corticospinal axon in the main tract (arrows, inset) that gives off a branch (arrowheads, inset) which penetrates the graft (inset; scale bar, 10μm). (f) High magnification of boxed area in e. (g) Quantification of CST axon regeneration into grafts with or without C5 injury. *P<0.01, Wilcoxon test. (h) Experimental design to determine the requirement of physical contact between the NPC graft and injured CST axons. NPCs are grafted to C4 and a spinal cord injury is placed at C5 (as in a), but in some cases with a 22–50μm gap interposed between the graft and the CST. (i) High magnification views of a 22 μm gap between NPC graft and injured CST axons. Scale bar, 50 μm. (j) Quantification of CST axons in grafts with or without direct contact of grafts with CST. *P<0.01, Wilcoxon test. Error bars represent mean ± s.e.m. and circles indicate data from individual rats throughout.
Figure 5
Figure 5. Corticospinal regeneration requires caudalized, homotypic grafts and enables functional improvement
(a, b) To determine whether homology of graft tissue to the spinal cord is required for corticospinal regeneration, we placed CST lesions at C4 and grafted NPCs derived from either E14 rat spinal cord (upper panels), hindbrain (middle panels) or telencephalon (lower panels). Sagittal sections were double labeled for CST axons (red) and NPC graft (green). Dashed lines indicate rostral host/graft border. Scale bar, 50 μm. (b) Quantification of the proportion of CST axons in NPC grafts, normalized to the total number of CST axons 0.5mm rostral to the lesion site in six rats. ANOVA P<0.01; post hoc, *P<0.05 to hindbrain and telencephalon, **P<0.05 to telencephlon. Kruskal-Wallis ANOVA with post hoc Steel-Dwass test. Circles indicate data from individual animals. (c) Behavioral outcomes on staircase test after C4 right quadrant lesions and NPC grafts. Number of pellets eaten (upper left); repeated measures ANOVA P<0.05 with post-hoc Fischer’s on individual days indicated by asterisks; *P<0.01, **P<0.05. Maximum depth of staircase reached (upper right) and pellet grasping accuracy (lower right): repeated measures ANOVA P = 0.07 on both tasks; exploratory post-hoc Fischer’s shown with *P<0.01, **P<0.05. Throughout, error bars represent mean ± s.e.m.
Figure 6
Figure 6. Homotypic human NPC grafts support corticospinal regeneration
(a) Sagittal views of human NPC grafts derived either from spinal cord (upper panels), or from the H9 ESC line driven toward a rostral midbrain fate (lower panels) placed at C4 CST injury in immunodeficient rats. Graft cells are labeled with human nuclear marker (HuNu, green) and CST axons are BDA labeled (red). (b) Quantification of proportion of CST axons in NPC grafts, normalized to total number of CST axons 0.5mm rostral to lesion site. n = 6 rats, spinal cord-derived grafts. n = 9 rats, H9 ESC-derived grafts. Wilcoxon test, *P<0.01, **P<0.05. (c) Sagittal views of human NPC grafts comprised of either caudalized (hindbrain, upper panels) or rostralized (forebrain, lower panels) NPCs derived from human induced pluripotent stem cells (iPSCs) placed in C4 CST lesion sites in immunodeficient rats. (d) Quantification of the proportion of CST axons in NPC grafts, normalized to the total number of CST axons 0.5mm rostral to the lesion site. n = 4 rats each for caudalized or rostralized iPSC-derived grafts. Wilcoxon test, **P<0.05. Throughout, rostral is left, dashed lines indicate rostral host/graft border. Scale bars, 50 μm for all images. Error bars represent mean ± s.e.m and circles indicate data from individual animals, throughout.

References

    1. Liu K, Tedeschi A, Park KK, He Z. Neuronal intrinsic mechanisms of axon regeneration. Annu Rev Neurosci. 2011;34:131–152. - PubMed
    1. Tuszynski MH, Steward O. Concepts and methods for the study of axonal regeneration in the CNS. Neuron. 2012;74:777–791. - PMC - PubMed
    1. Bareyre FM, et al. The injured spinal cord spontaneously forms a new intraspinal circuit in adult rats. Nat Neurosci. 2004;7:269–277. - PubMed
    1. Rosenzweig ES, et al. Extensive spontaneous plasticity of corticospinal projections after primate spinal cord injury. Nat Neurosci. 2010;13:1505–1510. - PMC - PubMed
    1. Weidner N, Ner A, Salimi N, Tuszynski MH. Spontaneous corticospinal axonal plasticity and functional recovery after adult central nervous system injury. Proc Natl Acad Sci U S A. 2001;98:3513–3518. - PMC - PubMed

Publication types

MeSH terms