. 2016 Jun;15(6):621-7.
doi: 10.1038/nmat4609. Epub 2016 Mar 28.

Extreme sensitivity biosensing platform based on hyperbolic metamaterials

Affiliations

Extreme sensitivity biosensing platform based on hyperbolic metamaterials

Kandammathe Valiyaveedu Sreekanth et al. Nat Mater. 2016 Jun.

Abstract

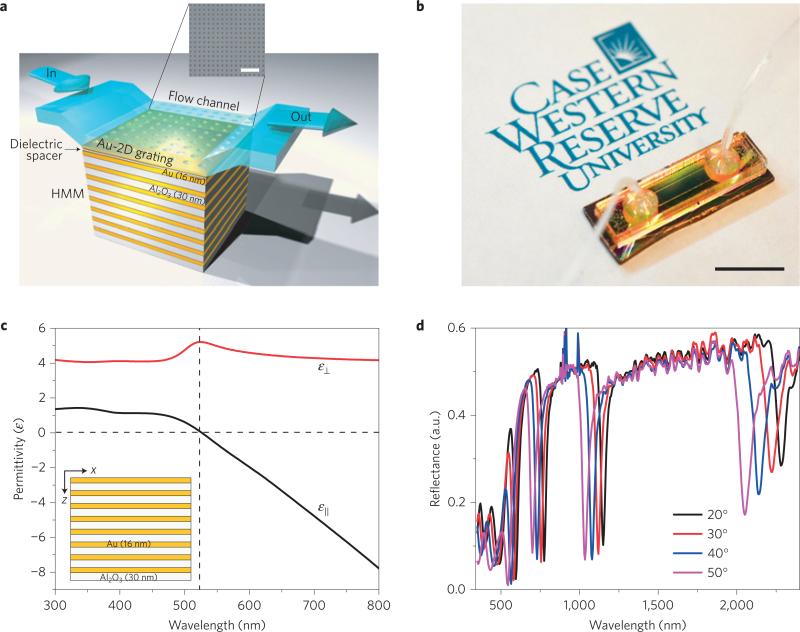
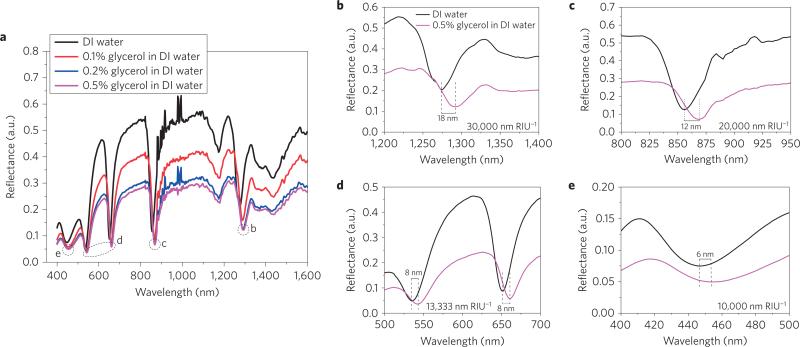
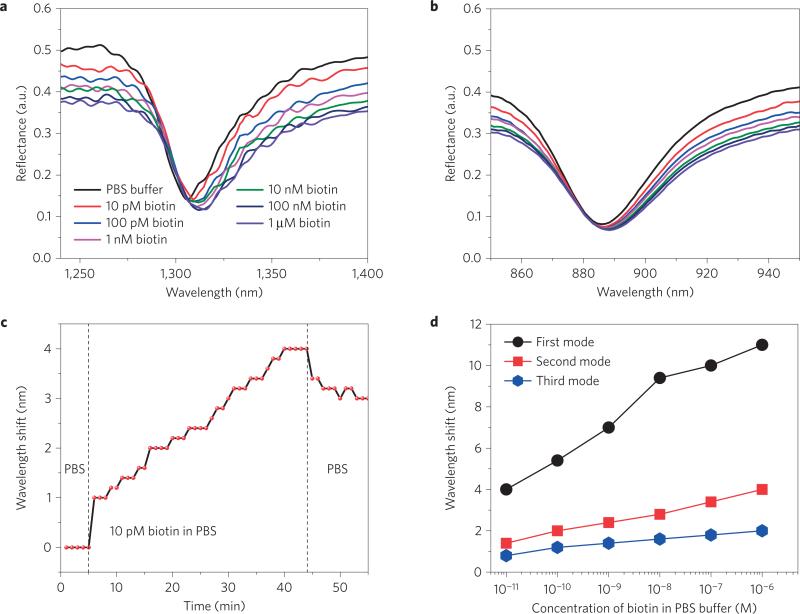
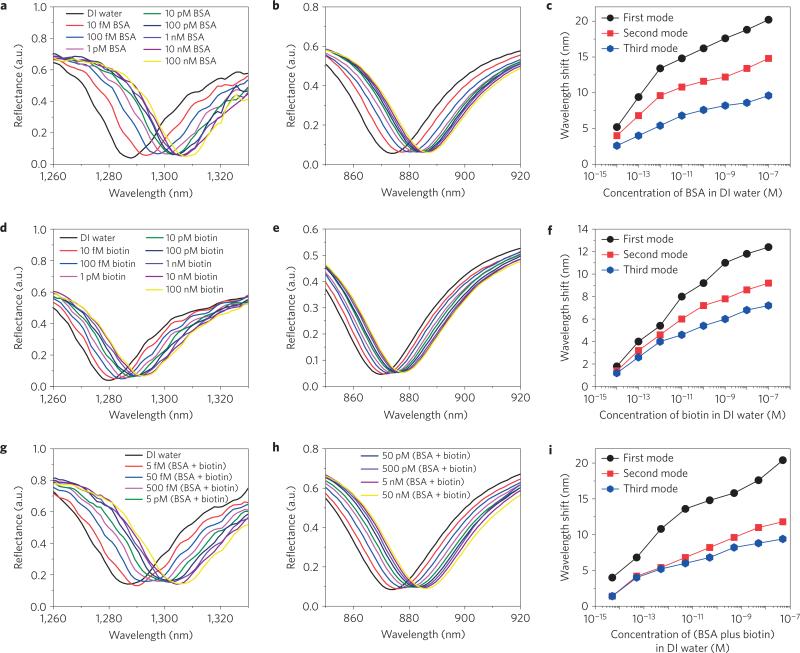
Optical sensor technology offers significant opportunities in the field of medical research and clinical diagnostics, particularly for the detection of small numbers of molecules in highly diluted solutions. Several methods have been developed for this purpose, including label-free plasmonic biosensors based on metamaterials. However, the detection of lower-molecular-weight (<500 Da) biomolecules in highly diluted solutions is still a challenging issue owing to their lower polarizability. In this context, we have developed a miniaturized plasmonic biosensor platform based on a hyperbolic metamaterial that can support highly confined bulk plasmon guided modes over a broad wavelength range from visible to near infrared. By exciting these modes using a grating-coupling technique, we achieved different extreme sensitivity modes with a maximum of 30,000 nm per refractive index unit (RIU) and a record figure of merit (FOM) of 590. We report the ability of the metamaterial platform to detect ultralow-molecular-weight (244 Da) biomolecules at picomolar concentrations using a standard affinity model streptavidin-biotin.


Figures

Figure 1
Figure 1. Fabrication and characterization of a metamaterial sensor device integrated with microfluidics
a, A schematic representation of the fabricated miniaturized GC-HMM sensor device with a fluid flow channel and a SEM image of the fabricated 2D subwavelength gold diffraction grating on top of the HMM with an average period of 500 nm and hole size of 160 nm (scale bar, 2 μm). b, Photograph of the GC-HMM sensor device fully integrated with a microfluidic channel and sample tubing. Scale bar, 10 mm. c, Real parts of effective permittivity of gold/Al2O3 HMM determined using effective media theory, which shows a hyperbolic dispersion at λ≥520 nm (dashed vertical line). The experimentally obtained permittivity values of gold and Al2O3 were used in these calculations. The fabricated eight pairs of gold/Al2O3 HMMs are shown in the inset. d, Reflectance spectra of the GC-HMM at different angles of incidence. The GC-HMM sample shows four prominent reflectance dips, corresponding to the bulk plasmon polariton modes, and two weak reflectance minima in the shorter wavelengths, corresponding to the SPP modes. A blue shift in resonance wavelength with increasing angle of incidence shows all six modes are guided modes.
Figure 2
Figure 2. Sensor calibration test results
a, Experimentally obtained reflectance spectra of the sensor device obtained by injecting different weight percentage concentrations of glycerol in distilled (DI) water. A red shift in resonance wavelength is observed when the glycerol weight percentage increases. b–e, Enlarged plots of the reflectance spectra (at the positions indicated in a) for distilled water and 0.5% glycerol in distilled water of four BPP modes and one SPP mode. The wavelength spectroscopic resolution is set to 1 nm.
Figure 3
Figure 3. Evaluation of sensor performance using lower-molecular-weight biomolecules
a,b, Reflectance spectra of the sensor device for different concentrations (10 pM to 1 μM) of biotin in PBS for the first mode (a) and the second mode (b). c, The variation of wavelength shift in the presence of 10 pM biotin in PBS over time. The wavelength spectroscopic resolution is set to 0.2 nm. The wavelength shift shows a distinct red shift over time. d, The variation of wavelength shift for three modes with different concentrations of biotin in PBS. The size of the data points in d represents the error bar.
Figure 4
Figure 4. Evaluation of sensor performance without functionalization
a,d,g, Reflectance spectra of the first mode for different concentrations of BSA in distilled water (10 fM to 100 nM) (a), biotin in distilled water (10 fM to 100 nM) (d) and BSA plus biotin in distilled water (5 fM to 50 nM) (g). b,e,h, Reflectance spectra of the second mode for different concentrations of BSA in distilled water (10 fM to 100 nM) (b), biotin in distilled water (10 fM to 100 nM) (e) and BSA plus biotin in distilled water (5 fM to 50 nM) (h). c,f,i, Variation of the wavelength shift for the three modes with different concentrations of BSA (c), biotin (f) and BSA plus biotin (i) in distilled water. The wavelength spectroscopic resolution is set to 0.4 nm. The size of the data points in c,f,i, represents the error bar.

References

    1. Huang B, Babcock H, Zhuang X. Breaking the diffraction barrier: super-resolution imaging of cell. Cell. 2010;143:1047–1058. - PMC - PubMed
    1. De Angelis F, et al. Breaking the diffusion limit with super-hydrophobic delivery of molecules to plasmonic nanofocusing SERS structures. Nature Photon. 2011;5:682–687.
    1. Zeng S, Baillargeat D, Hod HE, Yong K-T. Nanomaterials enhanced surface plasmon resonance for biological and chemical sensing applications. Chem. Soc. Rev. 2014;43:3426–3452. - PubMed
    1. Roy R, Hohng S, Ha T. A practical guide to single-molecule FRET. Nature Methods. 2008;5:507–516. - PMC - PubMed
    1. Poma A, et al. Interactions between saporin, a ribosome-inactivating protein, and DNA: a study by atomic force microscopy. J. Microsc. 2005;217:69–74. - PubMed

Publication types

MeSH terms