. 2017 Apr;18(3):391-404.
doi: 10.1111/mpp.12407. Epub 2016 Jun 10.

Deep sequencing leads to the identification of eukaryotic translation initiation factor 5A as a key element in Rsv1-mediated lethal systemic hypersensitive response to Soybean mosaic virus infection in soybean

Affiliations

Deep sequencing leads to the identification of eukaryotic translation initiation factor 5A as a key element in Rsv1-mediated lethal systemic hypersensitive response to Soybean mosaic virus infection in soybean

Hui Chen et al. Mol Plant Pathol. 2017 Apr.

Abstract

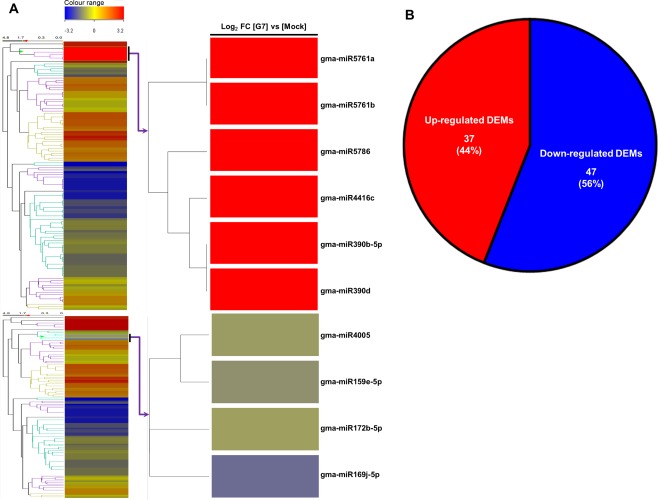
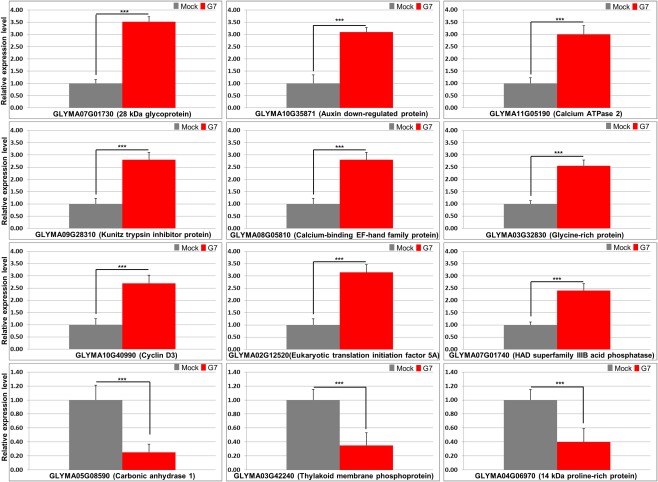
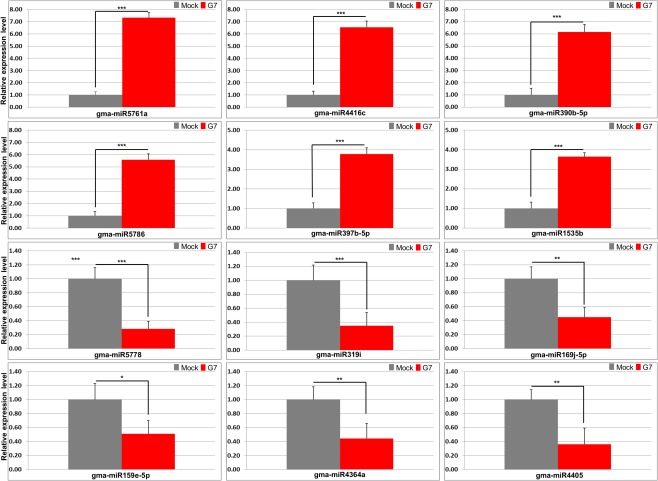
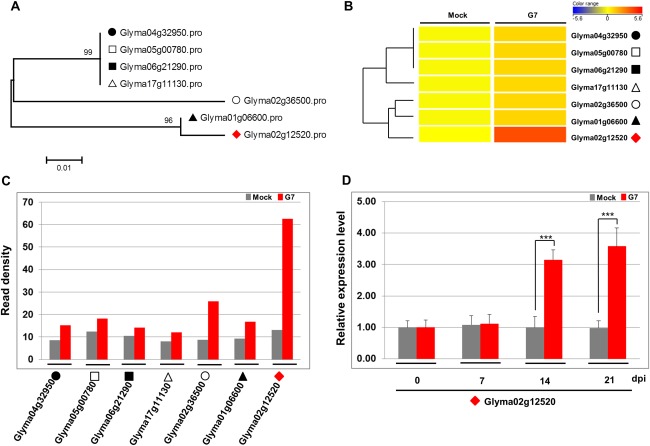
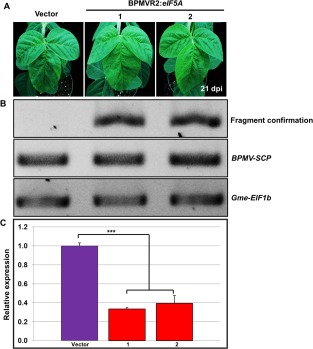
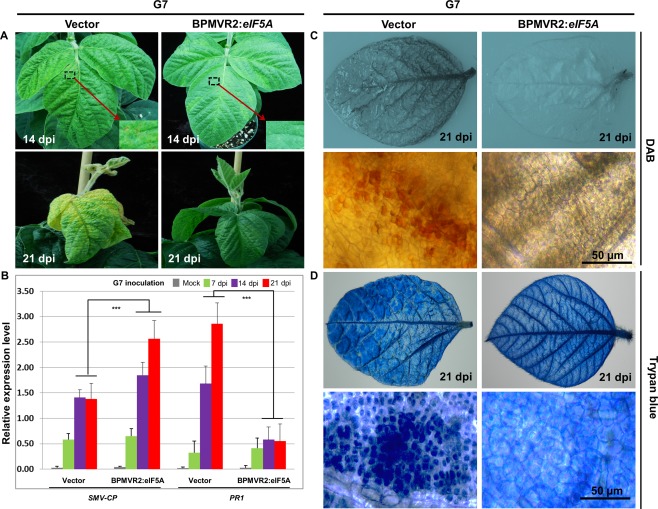
Rsv1, a single dominant resistance locus in soybean, confers extreme resistance to the majority of Soybean mosaic virus (SMV) strains, but is susceptible to the G7 strain. In Rsv1-genotype soybean, G7 infection provokes a lethal systemic hypersensitive response (LSHR), a delayed host defence response. The Rsv1-mediated LSHR signalling pathway remains largely unknown. In this study, we employed a genome-wide investigation to gain an insight into the molecular interplay between SMV G7 and Rsv1-genotype soybean. Small RNA (sRNA), degradome and transcriptome sequencing analyses were used to identify differentially expressed genes (DEGs) and microRNAs (DEMs) in response to G7 infection. A number of DEGs, DEMs and microRNA targets, and the interaction network of DEMs and their target mRNAs responsive to G7 infection, were identified. Knock-down of one of the identified DEGs, the eukaryotic translation initiation factor 5A (eIF5A), diminished the LSHR and enhanced viral accumulation, suggesting the essential role of eIF5A in the G7-induced, Rsv1-mediated LSHR signalling pathway. This work provides an in-depth genome-wide analysis of high-throughput sequencing data, and identifies multiple genes and microRNA signatures that are associated with the Rsv1-mediated LSHR.

Keywords: Soybean mosaic virus; degradome-seq; eukaryotic translation initiation factor; lethal systemic hypersensitive response; sRNA-seq; transcriptome-seq; virus-host interaction.


Figures

Figure 1
Figure 1
Global transcriptional response to G7 infection in Rsv1‐genotype soybean (PI96983). (A) At 14 days after inoculation, Soybean mosaic virus (SMV) G7‐infected plants had 906 differentially expressed genes (DEGs) compared with mock‐inoculated plants. The heat map depicts these 906 genes and presents a detailed view of the genes within the two branches. Colours indicate the log2 fold changes (FCs) in G7‐infected plants relative to mock‐inoculated plants according to the average normalized signal values. Red denotes up‐regulation and blue indicates down‐regulation. Significance was determined using a fold change threshold of at least two. (B) Venn diagram of significant up‐regulated and down‐regulated DEGs by G7 infection relative to the mock‐inoculated control. Of the 906 DEGs, 318 were up‐regulated and 588 were down‐regulated.
Figure 2
Figure 2
Differentially expressed microRNAs (DEMs) in response to G7 infection in Rsv1‐genotype soybean (PI96983). (A) At 14 days after inoculation, Soybean mosaic virus (SMV) G7‐infected plants had 84 DEMs compared with mock‐inoculated plants. The heat map represents these miRNAs as well as a detailed view of the DEMs from the two branches. Colours indicate the log2 fold changes (FCs) in G7‐infected plants relative to mock‐inoculated controls according to the average normalized signal values. All down‐regulations are indicated with a negative sign and are shown in blue. All up‐regulations are shown in red. Significance was determined using a fold change threshold of at least two. (B) Venn diagram of significant up‐regulated and down‐regulated DEMs by G7 infection relative to mock‐inoculated control. Of the 84 DEMs, 37 were up‐regulated and 47 were down‐regulated.
Figure 3
Figure 3
Reverse transcription‐quantitative polymerase chain reaction (RT‐qPCR) validation of differentially expressed genes (DEGs) in response to G7 infection in Rsv1‐genotype soybean (PI96983). From the RNA sequencing analysis, 12 G7‐responsive DEGs (nine up‐regulated and three down‐regulated) were selected for validation by RT‐qPCR analysis. The soybean Actin (GmACT11) gene was used as an internal control. Error bars represent mean ± standard deviation (SD) and the data are averages from three biological replicates. Asterisks indicate statistically significant differences compared with the mock control (Student's t‐test): *** P < 0.001.
Figure 4
Figure 4
Stem‐loop reverse transcription‐quantitative polymerase chain reaction (RT‐qPCR) analysis of differentially expressed microRNAs (DEMs) in response to G7 infection in Rsv1‐genotype soybean (PI96983). The accumulation of 12 top DEMs (six up‐regulated and six down‐regulated) was validated by stem‐loop RT‐qPCR. Soybean 18S rRNA was used as the internal control. Error bars represent mean ± standard deviation (SD) and the data are averages from three biological replicates. Asterisks indicate statistically significant differences compared with the mock control (Student's t‐test): * P < 0.05; ** P < 0.01; *** P < 0.001; ns, not significant.
Figure 5
Figure 5
Expression levels of GmelF5A induced by G7 infection. (A) Phylogenetic analysis of seven homologous soybean GmeIF5A genes. The numbers at the nodes are percentages of bootstrap values (1000 replicates). The scale bar indicates 0.01 substitutions per nucleotide position. (B) Heat map displaying the hierarchical clustering of the expression patterns of seven soybean eIF5A genes induced by Soybean mosaic virus (SMV) inoculation at 14 days post‐inoculation (dpi). Colours indicate the log‐scaled value of the normalized read count per kilobase of exon model per million reads. (C) The RNA‐seq read density of seven soybean GmeIF5A genes induced by SMV inoculation compared with mock‐inoculated plants. The read density value is the normalized read count per million reads. (D) The related expression level of Glyma02g12520 in systemic leaves was validated by reverse transcription‐quantitative polymerase chain reaction (RT‐qPCR) analysis at 0, 7, 14 and 21 dpi after SMV inoculation. The soybean Actin (GmACT11) gene was used as an internal control. Error bars represent mean ± standard deviation (SD) and the data are averages from three biological replicates. Asterisks indicate statistically significant differences compared with the mock control (Student's t‐test): *** P < 0.001.
Figure 6
Figure 6
Efficient silencing of GmeIF5A in Rsv1‐genotype soybean (PI96983) by a Bean pod mottle virus (BPMV)‐based virus‐induced gene silencing (VIGS) vector. (A) Modified BPMV‐based VIGS vector, containing a 320‐bp fragment specific to GmeIF5A, was used to silence the GmeIF5A gene in Rsv1 soybean. At 21 days post‐inoculation (dpi), mild BPMV viral symptoms developed on the systemic leaves of plants inoculated with the vector containing the GmeIF5A fragment. Vector, inoculated with the empty vector; BPMVR2:eIF5A, inoculated with the BPMVbased VIGS vector targeting the GmeIF5A gene. (B) Reverse transcription‐quantitative polymerase chain reaction (RT‐qPCR) analysis confirms vector infection in all samples. The eIF5a fragment is absent from the vector‐only control. The soybean Gme‐EIF1b served as an internal control for fragment specificity. (C) Following VIGS infection, the level of GmeIF5A mRNA was detected by RT‐qPCR in both the vector control and GmeIF5A‐silenced plant (1, 2). The soybean Actin (GmACT11) gene was used as an internal control. Error bars represent mean ± standard deviation (SD) and the data are averages from three biological replicates. Asterisks indicate statistically significant differences compared with the vector control (Student's t‐test): *** P < 0.001.
Figure 7
Figure 7
Effects of silencing of GmeIF5A on lethal systemic hypersensitive response (LSHR) severity and Soybean mosaic virus (SMV) G7 viral RNA accumulation in Rsv1‐genotype soybean (PI96983). (A) Vector‐only control plants and GmeIF5A virus‐induced gene‐silenced plants were inoculated with SMV G7. LSHR symptoms developed on leaves of both control and GmeIF5A‐silenced plants at 14 and 21 days post‐inoculation of G7. Vector, inoculated with the empty vector; BPMVR2:eIF5A, inoculated with the eIF5A‐BPMV vector. (B) Reverse transcription‐quantitative polymerase chain reaction (RT‐qPCR) analyses of the accumulated viral RNA (SMV coat protein, SMV‐CP) and the expression of pathogenesis‐related 1 (PR1) transcript in the control and GmeIF5A‐silenced plants at 7, 14 and 21 dpi of G7. The soybean Actin (GmACT11) gene was used as an internal control. Error bars represent mean ± standard deviation (SD) and the data are averages from three independent experiments. Asterisks indicate statistically significant differences between the vector control plant and the GmeIF5A‐silenced plant at 14 and 21 dpi after G7 inoculation (Student's t‐test): *** P < 0.001. The oxidative burst and LSHR formation in response to G7 infection were observed by staining with diaminobenzidine (DAB) (C) and trypan blue (D) in control and GmeIF5A‐silenced leaves at 21 dpi after G7 inoculation. Bars, 50 µm.

References

    1. Annamalai, P. and Rao, A.L. (2005) Replication‐independent expression of genome components and capsid protein of Brome mosaic virus in planta: a functional role for viral replicase in RNA packaging. Virology 338, 96–111. - PubMed
    1. Babu, M. , Gagarinova, A.G. , Brandle, J.E. and Wang, A. (2008) Association of the transcriptional response of soybean plants with Soybean mosaic virus systemic infection. J. Gen. Virol. 89, 1069–1080. - PubMed
    1. Baulcombe, D. (2004) RNA silencing in plants. Nature, 431, 356–363. - PubMed
    1. Bazzini, A.A. , Almasia, N.I. , Manacorda, C.A. , Mongelli, V.C. , Conti, G. , Maroniche, G.A. , Rodriguez, M.C. , Distéfano, A.J. , Hopp, H.E. and del Vas, M. (2009) Virus infection elevates transcriptional activity of miR164a promoter in plants. BMC Plant Biol. 9, 152. - PMC - PubMed
    1. Bilgin, D.D. , Aldea, M. , O'Neill, B.F. , Benitez, M. , Li, M. , Clough, S.J. and DeLucia, E.H. (2008) Elevated ozone alters soybean–virus interaction. Mol. Plant–Microbe Interact. 21, 1297–1308. - PubMed

Publication types

MeSH terms