. 2014 May 27;41(3):260-271.
doi: 10.1080/15230406.2014.890072. Epub 2014 Feb 26.

Geo-located Twitter as proxy for global mobility patterns

Affiliations

Geo-located Twitter as proxy for global mobility patterns

Bartosz Hawelka et al. Cartogr Geogr Inf Sci. .

Abstract

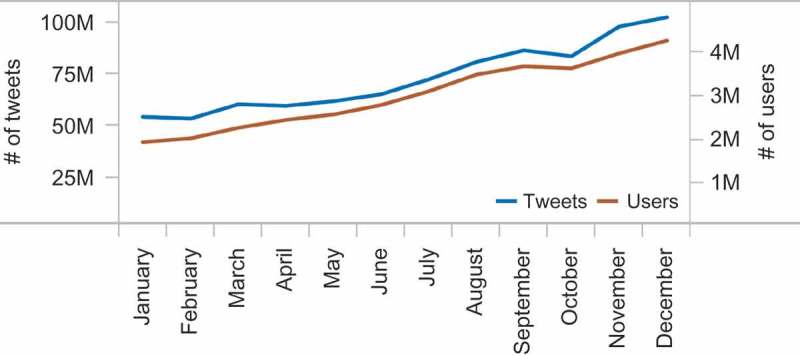
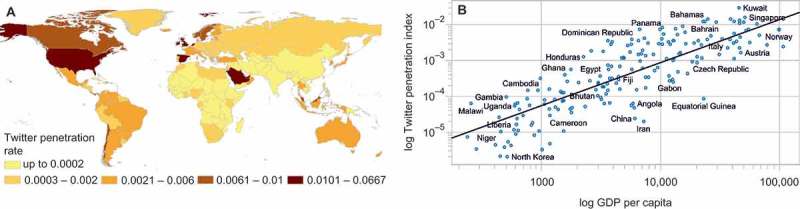
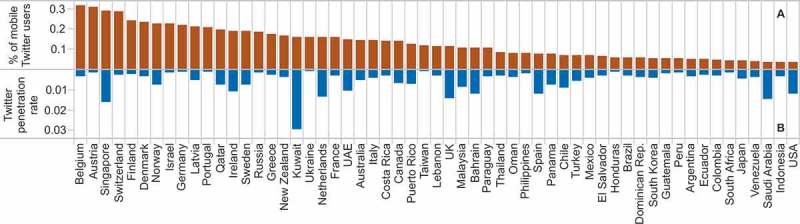
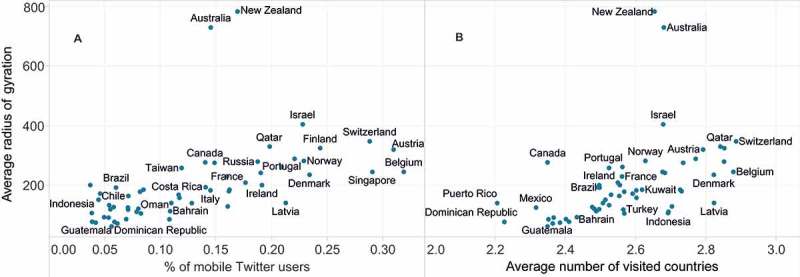
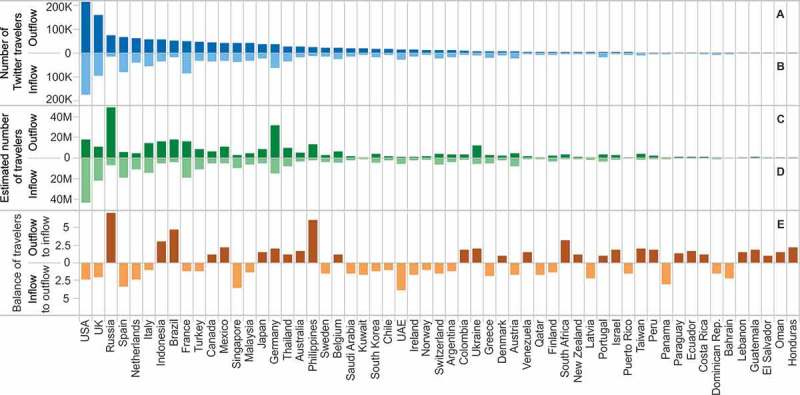
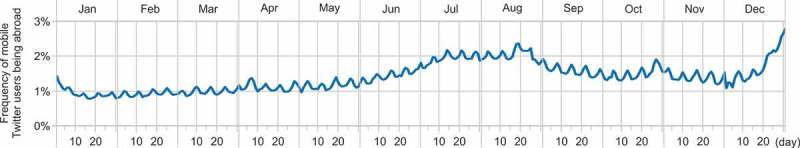
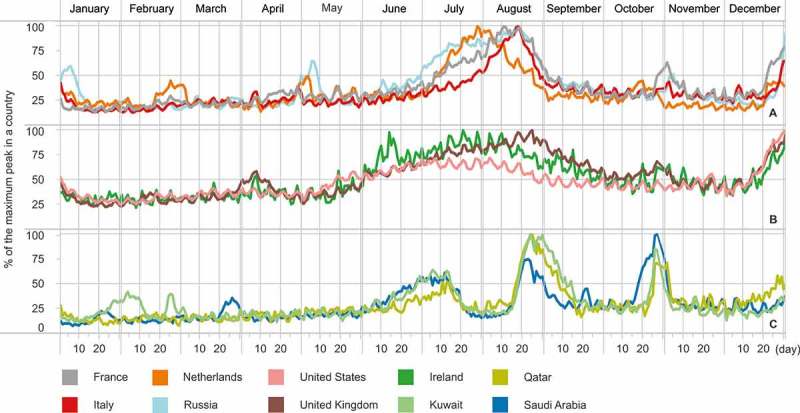
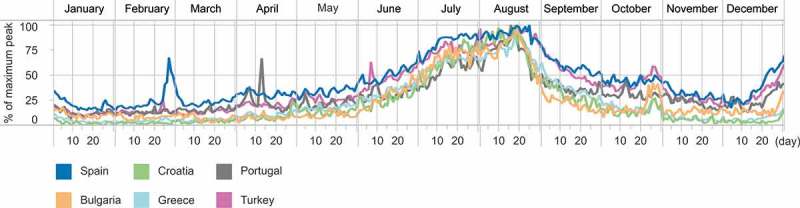
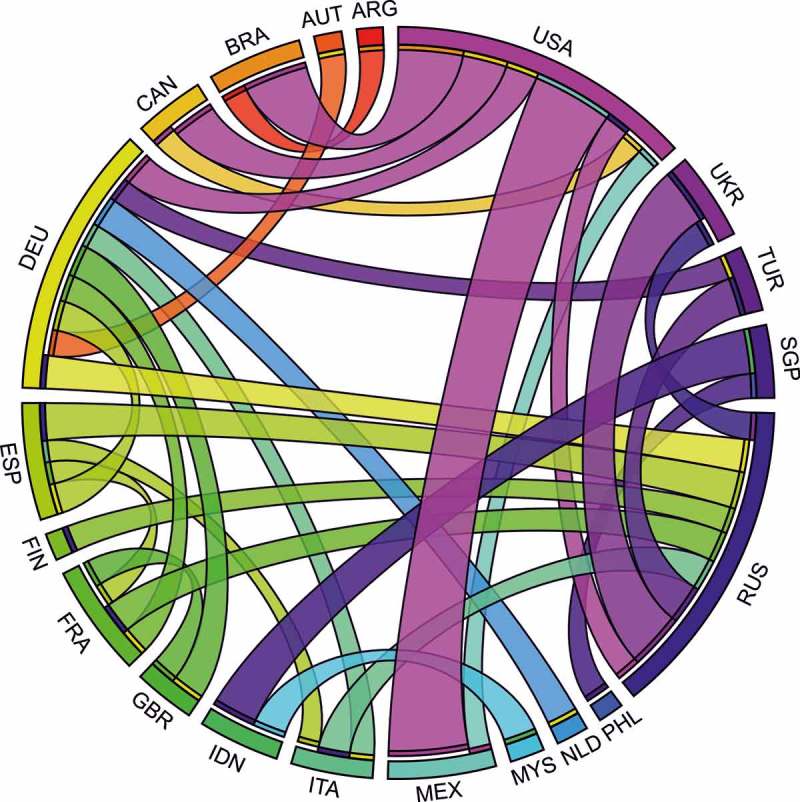
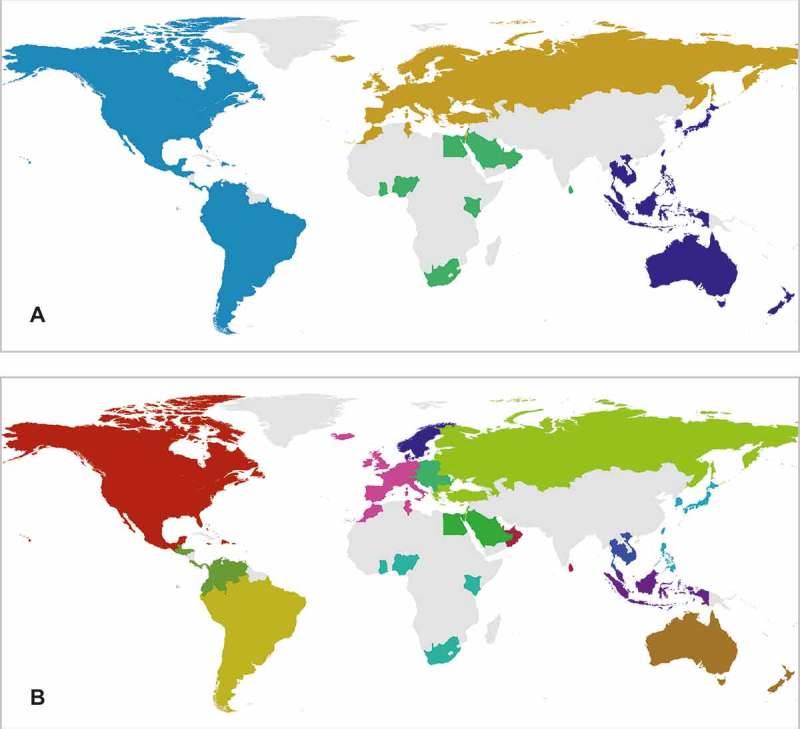
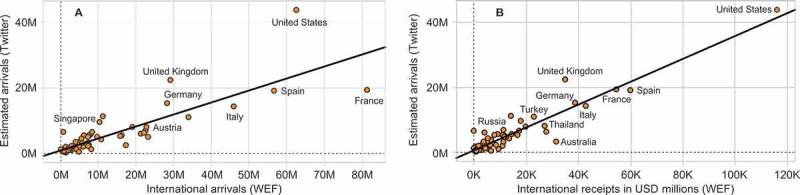
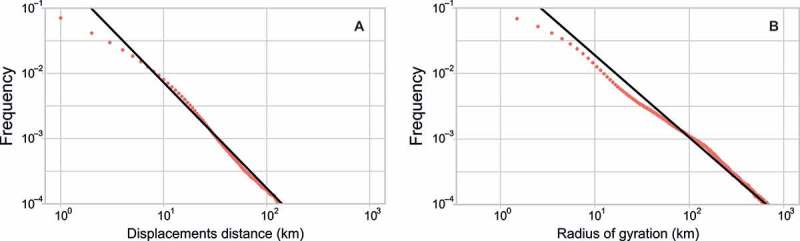
Pervasive presence of location-sharing services made it possible for researchers to gain an unprecedented access to the direct records of human activity in space and time. This article analyses geo-located Twitter messages in order to uncover global patterns of human mobility. Based on a dataset of almost a billion tweets recorded in 2012, we estimate the volume of international travelers by country of residence. Mobility profiles of different nations were examined based on such characteristics as mobility rate, radius of gyration, diversity of destinations, and inflow-outflow balance. Temporal patterns disclose the universally valid seasons of increased international mobility and the particular character of international travels of different nations. Our analysis of the community structure of the Twitter mobility network reveals spatially cohesive regions that follow the regional division of the world. We validate our result using global tourism statistics and mobility models provided by other authors and argue that Twitter is exceptionally useful for understanding and quantifying global mobility patterns.

Keywords: collective sensing; community detection; geo-located Twitter; global mobility patterns.


Figures

Figure 1.
Figure 1.
Number of geo-located tweets (blue line) and users (orange line) per month in 2012.
Figure 2.
Figure 2.
Twitter penetration rate across the countries of the world (A). Spatial distribution of the index. (B) Superlinear scaling of the penetration rate with per capita GDP of a country. R 2 coefficient equals 0.70.
Figure 3.
Figure 3.
Countries with the highest rates of users’ travel activity.
Figure 4.
Figure 4.
Average radius of gyration of users from different countries compared to (A) percentage of mobile Twitter users and (B) number of countries visited.
Figure 5.
Figure 5.
Number of visitors coming from or arriving in a country. (A and B) Number of Twitter travelers, (C and D) estimated total number of travelers (number of Twitter travelers normalized by the Twitter penetration rate in the country of origin of the visitor), and (E) the yearly ratio between the estimated inflow and outflow of travelers.
Figure 6.
Figure 6.
Global temporal pattern of abroad travels by Twitter users.
Figure 7.
Figure 7.
Normalized temporal patterns of mobility, by country of origin. The values for each country are scaled between 0 and 100% of the maximum daily number of travelers being abroad during 2012.
Figure 8.
Figure 8.
Destinations of tourist activity with increased inflow of international Twitter users over summer. The values for each country are scaled between 0 and 100% of the maximum daily number of international visitors during 2012.
Figure 9.
Figure 9.
Top 30 country-to-country estimated flows of visitors. Colors of the ribbons correspond to the destination of a trip; the country of origin is marked with a thin stripe at the end of a ribbon (visualization method based on Krzywinski et al. 2009).
Figure 10.
Figure 10.
Mobility regions uncovered by the partitioning of the country-to-country network of Twitter user flows. Regions distinguished at the first (A) and second (B) level of partitioning. Gray color indicates no data.
Figure 11.
Figure 11.
International arrivals estimated with Twitter data versus the arrivals (A) and nominal value of tourist receipts (expenditures by international inbound visitors, B) provided by WEF (2013). R 2 statistic equals 0.69 and 0.88, respectively.
Figure 12.
Figure 12.
Probability of displacement (A) and frequency of the radius of gyration (B).
Figure 13.
Figure 13.
Dependence of human flow (Fij) normalized with populations in countries of origin and destination (A piαpjβ) on the distance in comparison to a distance decay function (r–γ) modeled with the gravity law. (A) Network defined based on raw Twitter flows. (B) Network of total population flows estimated with the Twitter penetration rate in the country of origin.

References

    1. Amini A., Kung K., Kang C., Sobolevsky S., Ratti C.2013Proceedings of 3rd International Conference on the Analysis of Mobile Phone Data (NetMob 2013)
    1. Bajardi P., Poletto C., Ramasco J. J., Tizzoni M., Colizza V., Vespignani A. “Human Mobility Networks, Travel Restrictions, and the Global Spread of 2009 H1N1 Pandemic.”. PLoS ONE. 2011;6(1):e16591. doi: 10.1371/journal.pone.0016591. - DOI - PMC - PubMed
    1. Balcan D., Colizza V., Gonçalves B., Hu H., Ramasco J. J., Vespignani A. “Multiscale Mobility Networks and the Spatial Spreading of Infectious Diseases.”. Proceedings of the National Academy of Sciences. 2009;106(51):21484–21489. doi: 10.1073/pnas.0906910106. - DOI - PMC - PubMed
    1. Barrat A., Barthélemy M., Pastor-Satorras R., Vespignani A. “The Architecture of Complex Weighted Networks.”. Proceedings of the National Academy of Sciences of the United States of America. 2004;101(11):3747–3752. doi: 10.1073/pnas.0400087101. - DOI - PMC - PubMed
    1. Blondel V. 2011.