

Maintained larval growth in mussel larvae exposed to acidified under-saturated seawater
- PMID: 27020613
- PMCID: PMC4810423
- DOI: 10.1038/srep23728
Maintained larval growth in mussel larvae exposed to acidified under-saturated seawater
Erratum in
-
Corrigendum: Maintained larval growth in mussel larvae exposed to acidified under-saturated seawater.Sci Rep. 2018 Jun 27;8:46999. doi: 10.1038/srep46999. Sci Rep. 2018. PMID: 29947347 Free PMC article.
Abstract
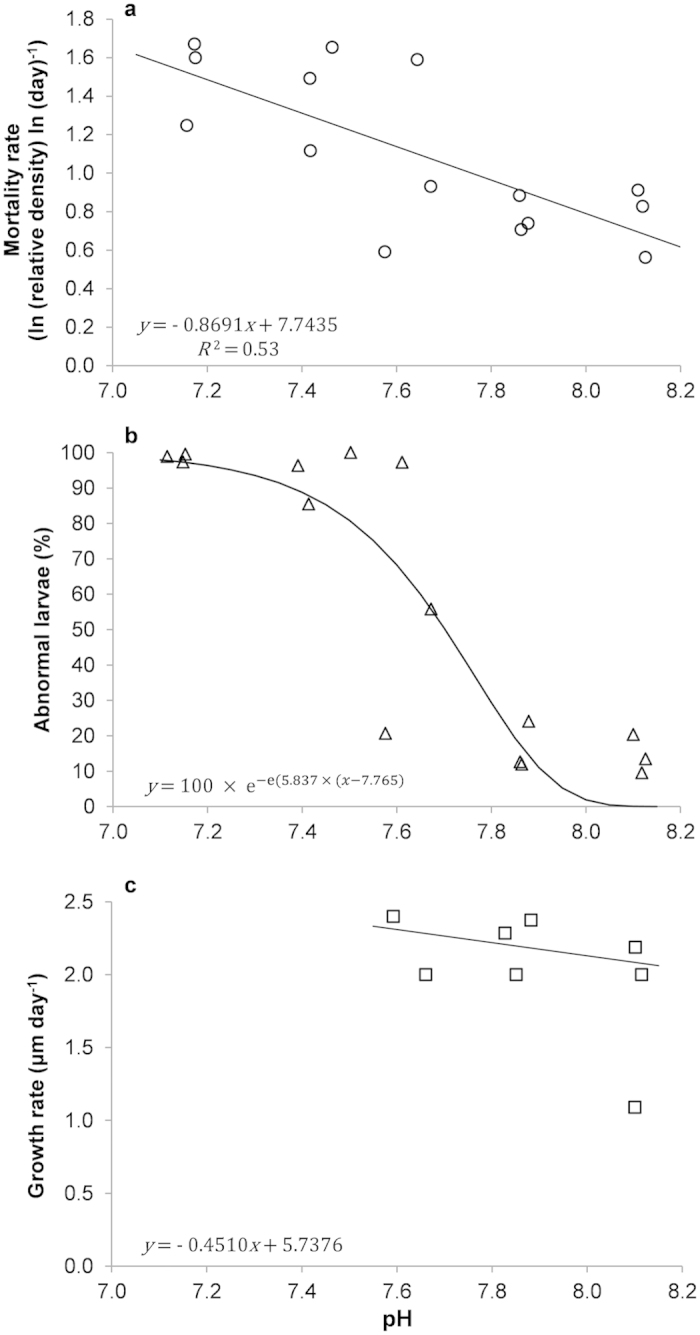
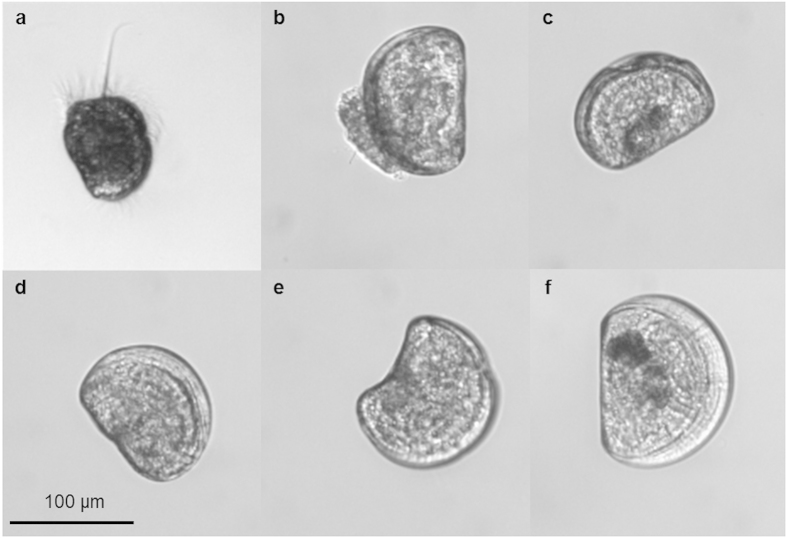
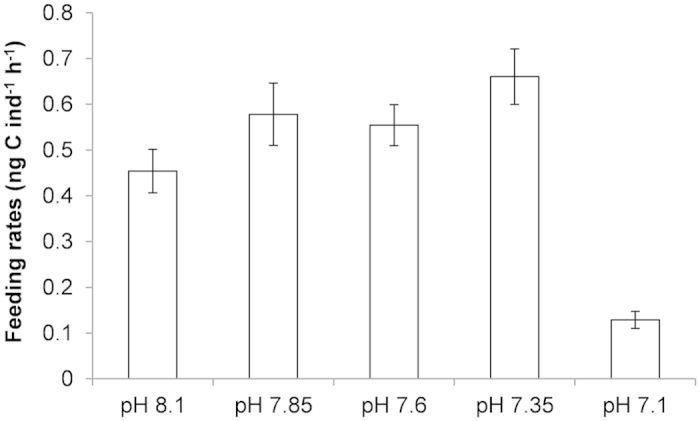
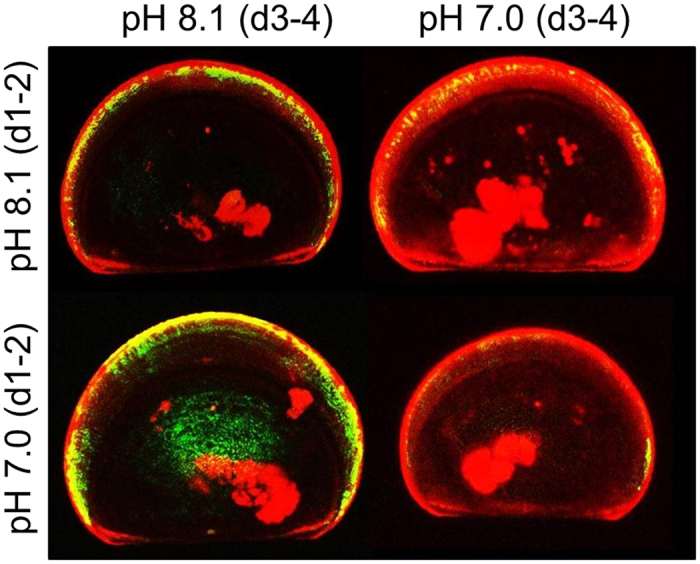
Ocean acidification (OA) is known to affect bivalve early life-stages. We tested responses of blue mussel larvae to a wide range of pH in order to identify their tolerance threshold. Our results confirmed that decreasing seawater pH and decreasing saturation state increases larval mortality rate and the percentage of abnormally developing larvae. Virtually no larvae reared at average pHT 7.16 were able to feed or reach the D-shell stage and their development appeared to be arrested at the trochophore stage. However larvae were capable of reaching the D-shell stage under milder acidification (pHT ≈ 7.35, 7.6, 7.85) including in under-saturated seawater with Ωa as low as 0.54 ± 0.01 (mean ± s. e. m.), with a tipping point for normal development identified at pHT 7.765. Additionally growth rate of normally developing larvae was not affected by lower pHT despite potential increased energy costs associated with compensatory calcification in response to increased shell dissolution. Overall, our results on OA impacts on mussel larvae suggest an average pHT of 7.16 is beyond their physiological tolerance threshold and indicate a shift in energy allocation towards growth in some individuals revealing potential OA resilience.
Figures
Similar articles
-
Mussel larvae modify calcifying fluid carbonate chemistry to promote calcification.Nat Commun. 2017 Nov 22;8(1):1709. doi: 10.1038/s41467-017-01806-8. Nat Commun. 2017. PMID: 29167466 Free PMC article.
-
Ocean Acidification Has Multiple Modes of Action on Bivalve Larvae.PLoS One. 2015 Jun 10;10(6):e0128376. doi: 10.1371/journal.pone.0128376. eCollection 2015. PLoS One. 2015. PMID: 26061095 Free PMC article.
-
Food supply and seawater pCO2 impact calcification and internal shell dissolution in the blue mussel Mytilus edulis.PLoS One. 2011;6(9):e24223. doi: 10.1371/journal.pone.0024223. Epub 2011 Sep 16. PLoS One. 2011. PMID: 21949698 Free PMC article.
-
Measurement of feeding rates, respiration, and pH regulatory processes in the light of ocean acidification research.Methods Cell Biol. 2019;150:391-409. doi: 10.1016/bs.mcb.2018.11.017. Epub 2018 Dec 21. Methods Cell Biol. 2019. PMID: 30777185 Review.
-
Bioremediation of waste under ocean acidification: Reviewing the role of Mytilus edulis.Mar Pollut Bull. 2016 Feb 15;103(1-2):5-14. doi: 10.1016/j.marpolbul.2015.12.040. Epub 2016 Jan 8. Mar Pollut Bull. 2016. PMID: 26778338 Review.
Cited by
-
Long-term study on survival and development of successive generations of Mytilus galloprovincialis cryopreserved larvae.Sci Rep. 2022 Aug 10;12(1):13632. doi: 10.1038/s41598-022-17935-0. Sci Rep. 2022. PMID: 35948747 Free PMC article.
-
Spatial risk assessment of global change impacts on Swedish seagrass ecosystems.PLoS One. 2020 Jan 24;15(1):e0225318. doi: 10.1371/journal.pone.0225318. eCollection 2020. PLoS One. 2020. PMID: 31978099 Free PMC article.
-
Resilience of the larval slipper limpet Crepidula onyx to direct and indirect-diet effects of ocean acidification.Sci Rep. 2017 Sep 21;7(1):12062. doi: 10.1038/s41598-017-12253-2. Sci Rep. 2017. PMID: 28935906 Free PMC article.
-
Ten years of marine evolutionary biology-Challenges and achievements of a multidisciplinary research initiative.Evol Appl. 2023 Jan 7;16(2):530-541. doi: 10.1111/eva.13389. eCollection 2023 Feb. Evol Appl. 2023. PMID: 36793681 Free PMC article.
-
Transgenerational Effects of pCO2-Driven Ocean Acidification on Adult Mussels Mytilus chilensis Modulate Physiological Response to Multiple Stressors in Larvae.Front Physiol. 2018 Oct 15;9:1349. doi: 10.3389/fphys.2018.01349. eCollection 2018. Front Physiol. 2018. PMID: 30374307 Free PMC article.
References
-
- Adelsman H. & Whitely Binder L. Ocean acidifaction: from knowledge to action, Washington state’s strategic response. Washington State Blue Ribbon Panel on Ocean Acidification. Washington Department of Ecology, Olympia. Washington. Publication no. 12-01-015 (2012).
-
- Doney S. C., Fabry V. J., Feely R. A. & Kleypas J. A. Ocean acidification: the other CO2 problem. Ann. Rev. Mar. Sci. 1, 169–92 (2009). - PubMed
-
- Roleda M. Y., Boyd P. W. & Hurd C. L. Before ocean acidification: calcifier chemistry lessons. J. Phycol. 48, 840–843 (2012). - PubMed
-
- Mount A. S., Wheeler A. P., Paradkar R. P. & Snider D. Hemocyte-mediated shell mineralization in the eastern oyster. Science 304, 297–300 (2004). - PubMed
-
- Tunnicliffe V. et al. Survival of mussels in extremely acidic waters on a submarine volcano. Nat. Geosci. 2, 344–348 (2009).
Publication types
MeSH terms
Substances
LinkOut - more resources
Full Text Sources
Other Literature Sources
